mirror of
https://github.com/grafana/grafana.git
synced 2026-01-14 13:21:26 +00:00
Compare commits
141 Commits
KD/export-
...
v10.3.5
| Author | SHA1 | Date | |
|---|---|---|---|
|
|
6db35ad6b4 | ||
|
|
cd81c5e4f9 | ||
|
|
423b47df74 | ||
|
|
8c933d49db | ||
|
|
7d9d17bab1 | ||
|
|
d80f83be01 | ||
|
|
b303c5c28a | ||
|
|
2a7adbb2fa | ||
|
|
1aea1aad23 | ||
|
|
31d9df1e6f | ||
|
|
5fe20a365d | ||
|
|
a5dc97b4fe | ||
|
|
053ff2bc2e | ||
|
|
cfc76de37f | ||
|
|
8da2f3c738 | ||
|
|
20a003a295 | ||
|
|
6b1e04976b | ||
|
|
b7aa8cdfe5 | ||
|
|
e5e165ec1a | ||
|
|
684c6af150 | ||
|
|
2e2932b9f4 | ||
|
|
f15bc2f246 | ||
|
|
ae52edd6e6 | ||
|
|
ffbc82f66c | ||
|
|
e954eeb344 | ||
|
|
d35a90ec10 | ||
|
|
5bde27379c | ||
|
|
93987476e7 | ||
|
|
d01813163a | ||
|
|
448d85cc30 | ||
|
|
84ed083fa5 | ||
|
|
4ca2f8bebe | ||
|
|
4bb2348d68 | ||
|
|
8d989735e0 | ||
|
|
72d03fab60 | ||
|
|
c5aef8fd27 | ||
|
|
9897b0965c | ||
|
|
5a5420ed64 | ||
|
|
f63de0ba6b | ||
|
|
acdd78d3b0 | ||
|
|
729204dacb | ||
|
|
ba4be08a3d | ||
|
|
1409398f32 | ||
|
|
8d687b4796 | ||
|
|
b51b4f987f | ||
|
|
7af760e6d6 | ||
|
|
876891b266 | ||
|
|
44455f0474 | ||
|
|
03ae322bee | ||
|
|
a2420cf050 | ||
|
|
bc11bd41a9 | ||
|
|
abff02cfce | ||
|
|
c2a2ee734a | ||
|
|
fe93eebcd3 | ||
|
|
b9d58cc277 | ||
|
|
cbceafc328 | ||
|
|
a9286551ff | ||
|
|
866eb7757f | ||
|
|
2e9be4bf1a | ||
|
|
65dba4e83b | ||
|
|
6537218eae | ||
|
|
84d9293ac0 | ||
|
|
f173b382ee | ||
|
|
887bda4c94 | ||
|
|
db28d71a67 | ||
|
|
9fb9ba0f52 | ||
|
|
27aeb3ef53 | ||
|
|
4aeab1fd55 | ||
|
|
f648781497 | ||
|
|
83c8c96b31 | ||
|
|
a03495567c | ||
|
|
bd144b53d6 | ||
|
|
6d54337286 | ||
|
|
4898cc1dac | ||
|
|
6f6607477e | ||
|
|
5d932e2cc5 | ||
|
|
9881e5e4fe | ||
|
|
f5ee831350 | ||
|
|
a2eb053adf | ||
|
|
c795674299 | ||
|
|
dbbf2c25ea | ||
|
|
f72a60f9ab | ||
|
|
a29045adeb | ||
|
|
e285daca88 | ||
|
|
45426decd8 | ||
|
|
482a89b553 | ||
|
|
f0778dd147 | ||
|
|
069704b39a | ||
|
|
5c10afaf63 | ||
|
|
c0049dcbd6 | ||
|
|
be850d677a | ||
|
|
c03a7b9806 | ||
|
|
cf586a09ae | ||
|
|
18e510b027 | ||
|
|
5ff228aeb6 | ||
|
|
557b86804e | ||
|
|
3d2005cd9b | ||
|
|
7bdc53053b | ||
|
|
3377dc411c | ||
|
|
534b23eb9d | ||
|
|
e6d2e4d8fe | ||
|
|
537d7b46cf | ||
|
|
330d3adae2 | ||
|
|
3417e99a19 | ||
|
|
f2f9ece03a | ||
|
|
8abe04662b | ||
|
|
8ce96414b0 | ||
|
|
5fcfade7f0 | ||
|
|
4e69ce0830 | ||
|
|
1c8d8b35c2 | ||
|
|
f4cf504009 | ||
|
|
b6ce5e5885 | ||
|
|
403d00b0e4 | ||
|
|
509313715a | ||
|
|
3e6b3a69b4 | ||
|
|
34709d74cc | ||
|
|
ea8a2c4083 | ||
|
|
28cf2b300d | ||
|
|
835744673c | ||
|
|
0177550993 | ||
|
|
b55cd1288c | ||
|
|
04b3a236f3 | ||
|
|
c2f0203662 | ||
|
|
b168ca8a9a | ||
|
|
c57ba08e28 | ||
|
|
0ec97b3878 | ||
|
|
38732d474b | ||
|
|
35a2b14c4b | ||
|
|
d19e5ec49f | ||
|
|
bfbe603bb2 | ||
|
|
8bf3055cb6 | ||
|
|
21e1008976 | ||
|
|
22d91ddb0b | ||
|
|
570736eb23 | ||
|
|
7b06079f0d | ||
|
|
8ba22b11cf | ||
|
|
b0f6404e0a | ||
|
|
6870f2381e | ||
|
|
7c2e5376c8 | ||
|
|
4ba9afa45f | ||
|
|
be211fbccb |
415
.drone.yml
415
.drone.yml
File diff suppressed because it is too large
Load Diff
4
.github/bot.md
vendored
4
.github/bot.md
vendored
@@ -9,8 +9,8 @@ Comment commands:
|
||||
|
||||
Label commands:
|
||||
|
||||
* Add label `bot/question` the the bot will close with standard question message and add label `type/question`
|
||||
* Add label `bot/duplicate` the the bot will close with standard duplicate message and add label `type/duplicate`
|
||||
* Add label `bot/question` the bot will close with standard question message and add label `type/question`
|
||||
* Add label `bot/duplicate` the bot will close with standard duplicate message and add label `type/duplicate`
|
||||
* Add label `bot/needs more info` for bot to request more info (or use comment command mentioned above)
|
||||
* Add label `bot/close feature request` for bot to close a feature request with standard message and adds label `not implemented`
|
||||
* Add label `bot/no new info` for bot to close an issue where we asked for more info but has not received any updates in at least 14 days.
|
||||
|
||||
2
.github/workflows/alerting-swagger-gen.yml
vendored
2
.github/workflows/alerting-swagger-gen.yml
vendored
@@ -16,7 +16,7 @@ jobs:
|
||||
- name: Set go version
|
||||
uses: actions/setup-go@v4
|
||||
with:
|
||||
go-version: '1.21.5'
|
||||
go-version: '1.21.8'
|
||||
- name: Build swagger
|
||||
run: |
|
||||
make -C pkg/services/ngalert/api/tooling post.json api.json
|
||||
|
||||
2
.github/workflows/codeql-analysis.yml
vendored
2
.github/workflows/codeql-analysis.yml
vendored
@@ -47,7 +47,7 @@ jobs:
|
||||
name: Set go version
|
||||
uses: actions/setup-go@v4
|
||||
with:
|
||||
go-version: '1.21.5'
|
||||
go-version: '1.21.8'
|
||||
|
||||
# Initializes the CodeQL tools for scanning.
|
||||
- name: Initialize CodeQL
|
||||
|
||||
@@ -1,5 +1,5 @@
|
||||
# Owned by grafana-delivery-squad
|
||||
# Intended to be dropped into the base repo (Ex: grafana/grafana) for use in the security mirror.
|
||||
# Owned by grafana-release-guild
|
||||
# Intended to be dropped into the base repo (Ex: grafana/grafana) for use in the security mirror.
|
||||
name: Create security patch
|
||||
run-name: create-security-patch
|
||||
on:
|
||||
@@ -17,7 +17,7 @@ jobs:
|
||||
trigger_downstream_create_security_patch:
|
||||
concurrency: create-patch-${{ github.ref_name }}
|
||||
uses: grafana/security-patch-actions/.github/workflows/create-patch.yml@main
|
||||
if: github.repository == 'grafana/grafana-security-mirror'
|
||||
if: github.repository == 'grafana/grafana-security-mirror'
|
||||
with:
|
||||
repo: "${{ github.repository }}"
|
||||
src_ref: "${{ github.head_ref }}" # this is the source branch name, Ex: "feature/newthing"
|
||||
|
||||
2
.github/workflows/pr-codeql-analysis-go.yml
vendored
2
.github/workflows/pr-codeql-analysis-go.yml
vendored
@@ -26,7 +26,7 @@ jobs:
|
||||
- name: Set go version
|
||||
uses: actions/setup-go@v4
|
||||
with:
|
||||
go-version: '1.21.5'
|
||||
go-version: '1.21.8'
|
||||
|
||||
# Initializes the CodeQL tools for scanning.
|
||||
- name: Initialize CodeQL
|
||||
|
||||
2
.github/workflows/pr-patch-check.yml
vendored
2
.github/workflows/pr-patch-check.yml
vendored
@@ -1,4 +1,4 @@
|
||||
# Owned by grafana-delivery-squad
|
||||
# Owned by grafana-release-guild
|
||||
# Intended to be dropped into the base repo Ex: grafana/grafana
|
||||
name: Check for patch conflicts
|
||||
run-name: check-patch-conflicts-${{ github.base_ref }}-${{ github.head_ref }}
|
||||
|
||||
2
.github/workflows/publish-kinds-next.yml
vendored
2
.github/workflows/publish-kinds-next.yml
vendored
@@ -36,7 +36,7 @@ jobs:
|
||||
- name: "Setup Go"
|
||||
uses: "actions/setup-go@v4"
|
||||
with:
|
||||
go-version: '1.21.5'
|
||||
go-version: '1.21.8'
|
||||
|
||||
- name: "Verify kinds"
|
||||
run: go run .github/workflows/scripts/kinds/verify-kinds.go
|
||||
|
||||
2
.github/workflows/publish-kinds-release.yml
vendored
2
.github/workflows/publish-kinds-release.yml
vendored
@@ -39,7 +39,7 @@ jobs:
|
||||
- name: "Setup Go"
|
||||
uses: "actions/setup-go@v4"
|
||||
with:
|
||||
go-version: '1.21.5'
|
||||
go-version: '1.21.8'
|
||||
|
||||
- name: "Verify kinds"
|
||||
run: go run .github/workflows/scripts/kinds/verify-kinds.go
|
||||
|
||||
@@ -55,7 +55,7 @@ jobs:
|
||||
# Tags aren't necessarily made to the HEAD of the version branch.
|
||||
# The documentation to be published is always on the HEAD of the version branch.
|
||||
if: "steps.has-matching-release-tag.outputs.bool == 'true' && github.ref_type == 'tag'"
|
||||
run: "git switch --detach origin/${{ steps.target.output.target }}.x"
|
||||
run: "git switch --detach origin/${{ steps.target.outputs.target }}.x"
|
||||
|
||||
- name: "Publish to website repository (release)"
|
||||
if: "steps.has-matching-release-tag.outputs.bool == 'true'"
|
||||
|
||||
2
.github/workflows/sync-mirror.yml
vendored
2
.github/workflows/sync-mirror.yml
vendored
@@ -1,4 +1,4 @@
|
||||
# Owned by grafana-delivery-squad
|
||||
# Owned by grafana-release-guild
|
||||
# Intended to be dropped into the base repo, Ex: grafana/grafana
|
||||
name: Sync to mirror
|
||||
run-name: sync-to-mirror-${{ github.ref_name }}
|
||||
|
||||
2
.github/workflows/verify-kinds.yml
vendored
2
.github/workflows/verify-kinds.yml
vendored
@@ -18,7 +18,7 @@ jobs:
|
||||
- name: "Setup Go"
|
||||
uses: "actions/setup-go@v4"
|
||||
with:
|
||||
go-version: '1.21.5'
|
||||
go-version: '1.21.8'
|
||||
|
||||
- name: "Verify kinds"
|
||||
run: go run .github/workflows/scripts/kinds/verify-kinds.go
|
||||
|
||||
143
CHANGELOG.md
143
CHANGELOG.md
@@ -1,3 +1,146 @@
|
||||
<!-- 10.3.4 START -->
|
||||
|
||||
# 10.3.4 (2024-03-06)
|
||||
|
||||
### Features and enhancements
|
||||
|
||||
- **Chore:** Improve domain validation for Google OAuth - Backport 83229 to v10.3.x. [#83725](https://github.com/grafana/grafana/issues/83725), [@linoman](https://github.com/linoman)
|
||||
|
||||
### Bug fixes
|
||||
|
||||
- **LDAP:** Fix LDAP users authenticated via auth proxy not being able to use LDAP active sync. [#83750](https://github.com/grafana/grafana/issues/83750), [@Jguer](https://github.com/Jguer)
|
||||
- **Tempo:** Add template variable interpolation for filters (#83213). [#83706](https://github.com/grafana/grafana/issues/83706), [@joey-grafana](https://github.com/joey-grafana)
|
||||
- **Elasticsearch:** Fix adhoc filters not applied in frontend mode. [#83596](https://github.com/grafana/grafana/issues/83596), [@svennergr](https://github.com/svennergr)
|
||||
- **Dashboards:** Fixes issue where panels would not refresh if time range updated while in panel view mode. [#83525](https://github.com/grafana/grafana/issues/83525), [@kaydelaney](https://github.com/kaydelaney)
|
||||
- **Auth:** Fix email verification bypass when using basic authentication. [#83484](https://github.com/grafana/grafana/issues/83484)
|
||||
- **AuthProxy:** Invalidate previous cached item for user when changes are made to any header. [#83203](https://github.com/grafana/grafana/issues/83203), [@klesh](https://github.com/klesh)
|
||||
- **LibraryPanels/RBAC:** Fix issue where folder scopes weren't being correctly inherited. [#82902](https://github.com/grafana/grafana/issues/82902), [@kaydelaney](https://github.com/kaydelaney)
|
||||
- **LibraryPanels:** Fix issue with repeated library panels. [#82259](https://github.com/grafana/grafana/issues/82259), [@kaydelaney](https://github.com/kaydelaney)
|
||||
- **Plugins:** Don't auto prepend app sub url to plugin asset paths. [#82147](https://github.com/grafana/grafana/issues/82147), [@wbrowne](https://github.com/wbrowne)
|
||||
- **Elasticsearch:** Set middlewares from Grafana's `httpClientProvider`. [#81929](https://github.com/grafana/grafana/issues/81929), [@svennergr](https://github.com/svennergr)
|
||||
- **Folders:** Fix failure to update folder in SQLite. [#81862](https://github.com/grafana/grafana/issues/81862), [@papagian](https://github.com/papagian)
|
||||
- **Loki/Elastic:** Assert queryfix value to always be string. [#81463](https://github.com/grafana/grafana/issues/81463), [@svennergr](https://github.com/svennergr)
|
||||
|
||||
### Breaking changes
|
||||
|
||||
We're adding a between the response of the ID token HD parameter and the list of allowed domains. This feature can be disabled through the configuration toggle `validate_hd `. Anyone using the legacy Google OAuth configuration should disable this validation if the ID Token response doesn't have the HD parameter. Issue [#83725](https://github.com/grafana/grafana/issues/83725)
|
||||
|
||||
<!-- 10.3.4 END -->
|
||||
<!-- 10.3.3 START -->
|
||||
|
||||
# 10.3.3 (2024-02-02)
|
||||
|
||||
### Bug fixes
|
||||
|
||||
- **Elasticsearch:** Fix creating of legend so it is backward compatible with frontend produced frames. [#81786](https://github.com/grafana/grafana/issues/81786), [@ivanahuckova](https://github.com/ivanahuckova)
|
||||
- **ShareModal:** Fixes url sync issue that caused issue with save drawer. [#81721](https://github.com/grafana/grafana/issues/81721), [@ivanortegaalba](https://github.com/ivanortegaalba)
|
||||
|
||||
<!-- 10.3.3 END -->
|
||||
<!-- 10.3.1 START -->
|
||||
|
||||
# 10.3.1 (2024-01-22)
|
||||
|
||||
To resolve a technical issue within the Grafana release package management process, we are releasing both Grafana 10.3.0 and Grafana 10.3.1 simultaneously. The 10.3.1 release contains no breaking or functional changes from 10.3.0. Please refer to the [What’s New](https://grafana.com/docs/grafana/latest/whatsnew/whats-new-in-v10-3/) post for Grafana 10.3.0 for details on new features and changes in this release.
|
||||
|
||||
<!-- 10.3.1 END -->
|
||||
<!-- 10.3.0 START -->
|
||||
|
||||
# 10.3.0 (2024-01-22)
|
||||
|
||||
To resolve a technical issue within the Grafana release package management process, we are releasing both Grafana 10.3.0 and Grafana 10.3.1 simultaneously. The 10.3.1 release contains no breaking or functional changes from 10.3.0. Please refer to the [What’s New](https://grafana.com/docs/grafana/latest/whatsnew/whats-new-in-v10-3/) post for Grafana 10.3.0 for details on new features and changes in this release.
|
||||
|
||||
### Features and enhancements
|
||||
|
||||
- **Alerting:** Guided legacy alerting upgrade dry-run. [#80071](https://github.com/grafana/grafana/issues/80071), [@JacobsonMT](https://github.com/JacobsonMT)
|
||||
- **Explore:** Preserve time range when creating a dashboard panel from Explore. [#80070](https://github.com/grafana/grafana/issues/80070), [@Elfo404](https://github.com/Elfo404)
|
||||
- **Explore:** Init with mixed DS if there's no root DS in the URL and queries have multiple datasources. [#80068](https://github.com/grafana/grafana/issues/80068), [@Elfo404](https://github.com/Elfo404)
|
||||
- **QueryEditor:** Display error even if error field is empty. [#79943](https://github.com/grafana/grafana/issues/79943), [@idastambuk](https://github.com/idastambuk)
|
||||
- **K8s:** Enable api-server by default. [#79942](https://github.com/grafana/grafana/issues/79942), [@ryantxu](https://github.com/ryantxu)
|
||||
- **Parca:** Add standalone building configuration. [#79896](https://github.com/grafana/grafana/issues/79896), [@fabrizio-grafana](https://github.com/fabrizio-grafana)
|
||||
- **Auth:** Hide forgot password if grafana auth is disabled. [#79895](https://github.com/grafana/grafana/issues/79895), [@Jguer](https://github.com/Jguer)
|
||||
- **Plugins:** Add uninstall requested message for cloud plugins. [#79748](https://github.com/grafana/grafana/issues/79748), [@oshirohugo](https://github.com/oshirohugo)
|
||||
- **Loki:** Open log context in new tab. [#79723](https://github.com/grafana/grafana/issues/79723), [@svennergr](https://github.com/svennergr)
|
||||
- **Alerting:** Allow linking to library panels. [#79693](https://github.com/grafana/grafana/issues/79693), [@gillesdemey](https://github.com/gillesdemey)
|
||||
- **Loki:** Drop all errors in volume requests. [#79686](https://github.com/grafana/grafana/issues/79686), [@svennergr](https://github.com/svennergr)
|
||||
- **Loki Logs volume:** Added a query splitting loading indicator to the Logs Volume graph. [#79681](https://github.com/grafana/grafana/issues/79681), [@matyax](https://github.com/matyax)
|
||||
- **Plugins:** Disable add new data source for incomplete install. [#79658](https://github.com/grafana/grafana/issues/79658), [@oshirohugo](https://github.com/oshirohugo)
|
||||
- **RBAC:** Render team, service account and user list when a user can see entities but not roles attached to them. [#79642](https://github.com/grafana/grafana/issues/79642), [@kalleep](https://github.com/kalleep)
|
||||
- **InfluxDB:** Use database input for SQL configuration instead of metadata. [#79579](https://github.com/grafana/grafana/issues/79579), [@itsmylife](https://github.com/itsmylife)
|
||||
- **Tempo:** Support special characters in identifiers. [#79565](https://github.com/grafana/grafana/issues/79565), [@fabrizio-grafana](https://github.com/fabrizio-grafana)
|
||||
- **Alerting:** Display "Show all" button for cloud rules. [#79512](https://github.com/grafana/grafana/issues/79512), [@VikaCep](https://github.com/VikaCep)
|
||||
- **React Hook Form:** Update to v 7.49.2. [#79493](https://github.com/grafana/grafana/issues/79493), [@Clarity-89](https://github.com/Clarity-89)
|
||||
- **Loki:** Add timeRange to labels requests in LogContext to reduce loading times. [#79478](https://github.com/grafana/grafana/issues/79478), [@svennergr](https://github.com/svennergr)
|
||||
- **InfluxDB:** Enable SQL support by default. [#79474](https://github.com/grafana/grafana/issues/79474), [@itsmylife](https://github.com/itsmylife)
|
||||
- **OAuth:** Remove accessTokenExpirationCheck feature toggle. [#79455](https://github.com/grafana/grafana/issues/79455), [@mgyongyosi](https://github.com/mgyongyosi)
|
||||
- **Units:** Add scalable unit option. [#79411](https://github.com/grafana/grafana/issues/79411), [@Develer](https://github.com/Develer)
|
||||
- **Alerting:** Add export mute timings feature to the UI. [#79395](https://github.com/grafana/grafana/issues/79395), [@soniaAguilarPeiron](https://github.com/soniaAguilarPeiron)
|
||||
- **Config:** Can add static headers to email messages. [#79365](https://github.com/grafana/grafana/issues/79365), [@owensmallwood](https://github.com/owensmallwood)
|
||||
- **Alerting:** Drop NamespaceID from responses on unstable ngalert API endpoints in favor of NamespaceUID. [#79359](https://github.com/grafana/grafana/issues/79359), [@alexweav](https://github.com/alexweav)
|
||||
- **Cloudwatch:** Update cloudwatchNewRegionsHandler to General Availability. [#79348](https://github.com/grafana/grafana/issues/79348), [@sarahzinger](https://github.com/sarahzinger)
|
||||
- **Plugins:** Include Azure settings as a part of Grafana config sent in plugin requests. [#79342](https://github.com/grafana/grafana/issues/79342), [@aangelisc](https://github.com/aangelisc)
|
||||
- **Plugins:** Add hide_angular_deprecation setting. [#79296](https://github.com/grafana/grafana/issues/79296), [@xnyo](https://github.com/xnyo)
|
||||
- **Table:** Add select/unselect all column values to table filter. [#79290](https://github.com/grafana/grafana/issues/79290), [@ahuarte47](https://github.com/ahuarte47)
|
||||
- **Anonymous:** Add configurable device limit. [#79265](https://github.com/grafana/grafana/issues/79265), [@Jguer](https://github.com/Jguer)
|
||||
- **Frontend:** Detect new assets / versions / config changes. [#79258](https://github.com/grafana/grafana/issues/79258), [@ryantxu](https://github.com/ryantxu)
|
||||
- **Plugins:** Add option to disable TLS in the socks proxy. [#79246](https://github.com/grafana/grafana/issues/79246), [@PoorlyDefinedBehaviour](https://github.com/PoorlyDefinedBehaviour)
|
||||
- **Frontend:** Reload the browser when backend configuration/assets change. [#79057](https://github.com/grafana/grafana/issues/79057), [@torkelo](https://github.com/torkelo)
|
||||
- **Chore:** Refactor dataviz aria-label e2e selectors to data-testid. [#78938](https://github.com/grafana/grafana/issues/78938), [@khushijain21](https://github.com/khushijain21)
|
||||
- **SSO:** Add GitHub auth configuration page. [#78933](https://github.com/grafana/grafana/issues/78933), [@Clarity-89](https://github.com/Clarity-89)
|
||||
- **PublicDashboards:** Add setting to disable the feature. [#78894](https://github.com/grafana/grafana/issues/78894), [@AgnesToulet](https://github.com/AgnesToulet)
|
||||
- **Variables:** Interpolate variables used in custom variable definition. [#78800](https://github.com/grafana/grafana/issues/78800), [@torkelo](https://github.com/torkelo)
|
||||
- **Table:** Highlight row on shared crosshair. [#78392](https://github.com/grafana/grafana/issues/78392), [@mdvictor](https://github.com/mdvictor)
|
||||
- **Stat:** Add Percent Change Option. [#78250](https://github.com/grafana/grafana/issues/78250), [@drew08t](https://github.com/drew08t)
|
||||
- **Plugins:** Add Command Palette extension point. [#78098](https://github.com/grafana/grafana/issues/78098), [@sd2k](https://github.com/sd2k)
|
||||
- **Transformations:** Add frame source picker to allow transforming annotations. [#77842](https://github.com/grafana/grafana/issues/77842), [@leeoniya](https://github.com/leeoniya)
|
||||
- **Pyroscope:** Send start/end with profile types query. [#77523](https://github.com/grafana/grafana/issues/77523), [@bryanhuhta](https://github.com/bryanhuhta)
|
||||
- **Explore:** Create menu for short link button. [#77336](https://github.com/grafana/grafana/issues/77336), [@gelicia](https://github.com/gelicia)
|
||||
- **Alerting:** Don't record annotations for mapped NoData transitions, when NoData is mapped to OK. [#77164](https://github.com/grafana/grafana/issues/77164), [@alexweav](https://github.com/alexweav)
|
||||
- **Canvas:** Add Pan and Zoom. [#76705](https://github.com/grafana/grafana/issues/76705), [@drew08t](https://github.com/drew08t)
|
||||
- **Alerting:** In migration, create one label per channel. [#76527](https://github.com/grafana/grafana/issues/76527), [@JacobsonMT](https://github.com/JacobsonMT)
|
||||
- **Alerting:** Separate overlapping legacy and UA alerting routes. [#76517](https://github.com/grafana/grafana/issues/76517), [@JacobsonMT](https://github.com/JacobsonMT)
|
||||
- **Tooltip:** Improved Timeseries and Candlestick tooltips. [#75841](https://github.com/grafana/grafana/issues/75841), [@adela-almasan](https://github.com/adela-almasan)
|
||||
- **Alerting:** Support hysteresis command expression. [#75189](https://github.com/grafana/grafana/issues/75189), [@yuri-tceretian](https://github.com/yuri-tceretian)
|
||||
- **Plugins:** Add update for instance plugins. (Enterprise)
|
||||
- **React Hook Form:** Update to v 7.49.2. (Enterprise)
|
||||
- **Plugins:** Improve cloud plugins install error treatment. (Enterprise)
|
||||
|
||||
### Bug fixes
|
||||
|
||||
- **Transformations:** Fix bug where having NaN in the input to regression analysis transformation causes all predictions to be NaN. [#80079](https://github.com/grafana/grafana/issues/80079), [@oscarkilhed](https://github.com/oscarkilhed)
|
||||
- **Alerting:** Fix URL timestamp conversion in historian API in annotation mode. [#80026](https://github.com/grafana/grafana/issues/80026), [@alexweav](https://github.com/alexweav)
|
||||
- **Fix:** Switch component not being styled as disabled when is checked. [#80012](https://github.com/grafana/grafana/issues/80012), [@soniaAguilarPeiron](https://github.com/soniaAguilarPeiron)
|
||||
- **Tempo:** Fix Spans table format. [#79938](https://github.com/grafana/grafana/issues/79938), [@fabrizio-grafana](https://github.com/fabrizio-grafana)
|
||||
- **Gauges:** Fixing broken auto sizing. [#79926](https://github.com/grafana/grafana/issues/79926), [@torkelo](https://github.com/torkelo)
|
||||
- **Barchart:** Fix percent stacking regression. [#79903](https://github.com/grafana/grafana/issues/79903), [@nmarrs](https://github.com/nmarrs)
|
||||
- **Alerting:** Fix reusing last url in tab when reopening a new tab in rule detail a…. [#79801](https://github.com/grafana/grafana/issues/79801), [@soniaAguilarPeiron](https://github.com/soniaAguilarPeiron)
|
||||
- **Azure Monitor:** Fix multi-resource bug "Missing required region params, requested QueryParams: api-version:2017-12-01-preview...". [#79669](https://github.com/grafana/grafana/issues/79669), [@bossinc](https://github.com/bossinc)
|
||||
- **Explore:** Fix URL sync with async queries import . [#79584](https://github.com/grafana/grafana/issues/79584), [@Elfo404](https://github.com/Elfo404)
|
||||
- **Dashboards:** Skip inherited object variable names. [#79567](https://github.com/grafana/grafana/issues/79567), [@jarben](https://github.com/jarben)
|
||||
- **Alerting:** Fix queries and expressions in rule view details. [#79497](https://github.com/grafana/grafana/issues/79497), [@soniaAguilarPeiron](https://github.com/soniaAguilarPeiron)
|
||||
- **Tempo:** Fix cache in TraceQL editor. [#79468](https://github.com/grafana/grafana/issues/79468), [@adrapereira](https://github.com/adrapereira)
|
||||
- **Nested Folders:** Fix /api/folders pagination. [#79447](https://github.com/grafana/grafana/issues/79447), [@papagian](https://github.com/papagian)
|
||||
- **Elasticsearch:** Fix modify query with backslashes. [#79430](https://github.com/grafana/grafana/issues/79430), [@svennergr](https://github.com/svennergr)
|
||||
- **Cloudwatch:** Fix errors while loading queries/datasource on Safari. [#79417](https://github.com/grafana/grafana/issues/79417), [@kevinwcyu](https://github.com/kevinwcyu)
|
||||
- **Stat:** Fix inconsistent center padding. [#79389](https://github.com/grafana/grafana/issues/79389), [@torkelo](https://github.com/torkelo)
|
||||
- **Tempo:** Fix autocompletion with strings. [#79370](https://github.com/grafana/grafana/issues/79370), [@fabrizio-grafana](https://github.com/fabrizio-grafana)
|
||||
- **Alerting:** Fix for data source filter on cloud rules. [#79327](https://github.com/grafana/grafana/issues/79327), [@soniaAguilarPeiron](https://github.com/soniaAguilarPeiron)
|
||||
- **Alerting:** Fix UI inheriting mute timings from parent when calculating the polic…. [#79295](https://github.com/grafana/grafana/issues/79295), [@soniaAguilarPeiron](https://github.com/soniaAguilarPeiron)
|
||||
- **Auth:** Fix a panic during logout when OAuth provider is not set. [#79271](https://github.com/grafana/grafana/issues/79271), [@dmihai](https://github.com/dmihai)
|
||||
- **Tempo:** Fix read-only assignment. [#79183](https://github.com/grafana/grafana/issues/79183), [@fabrizio-grafana](https://github.com/fabrizio-grafana)
|
||||
- **Templating:** Json interpolation of single-value default selection does not create valid json. [#79137](https://github.com/grafana/grafana/issues/79137), [@kaydelaney](https://github.com/kaydelaney)
|
||||
- **Heatmap:** Fix null options migration. [#79083](https://github.com/grafana/grafana/issues/79083), [@overvenus](https://github.com/overvenus)
|
||||
- **Dashboards:** Run shared queries even when source panel is in collapsed row. [#77792](https://github.com/grafana/grafana/issues/77792), [@kaydelaney](https://github.com/kaydelaney)
|
||||
- **PDF:** Fix support for large panels. (Enterprise)
|
||||
- **Reporting:** Fix daylight saving time support for custom schedules. (Enterprise)
|
||||
- **RBAC:** Fix role assignment removal . (Enterprise)
|
||||
|
||||
### Breaking changes
|
||||
|
||||
Users who have InfluxDB datasource configured with SQL querying language must update their database information. They have to enter their `bucket name` into the database field. Issue [#79579](https://github.com/grafana/grafana/issues/79579)
|
||||
|
||||
Removes `NamespaceID` from responses of all GET routes underneath the path `/api/ruler/grafana/api/v1/rules` - 3 affected endpoints. All affected routes are not in the publicly documented or `stable` marked portion of the ngalert API. This only breaks clients who are directly using the unstable portion of the API. Such clients should use `NamespaceUID` rather than `NamespaceID` to identify namespaces. Issue [#79359](https://github.com/grafana/grafana/issues/79359)
|
||||
|
||||
<!-- 10.3.0 END -->
|
||||
<!-- 10.2.3 START -->
|
||||
|
||||
# 10.2.3 (2023-12-18)
|
||||
|
||||
@@ -1,9 +1,9 @@
|
||||
# syntax=docker/dockerfile:1
|
||||
|
||||
ARG BASE_IMAGE=alpine:3.18.3
|
||||
ARG JS_IMAGE=node:20-alpine3.18
|
||||
ARG BASE_IMAGE=alpine:3.19.1
|
||||
ARG JS_IMAGE=node:20-alpine
|
||||
ARG JS_PLATFORM=linux/amd64
|
||||
ARG GO_IMAGE=golang:1.21.5-alpine3.18
|
||||
ARG GO_IMAGE=golang:1.21.8-alpine
|
||||
|
||||
ARG GO_SRC=go-builder
|
||||
ARG JS_SRC=js-builder
|
||||
|
||||
2
Makefile
2
Makefile
@@ -261,7 +261,7 @@ build-docker-full-ubuntu: ## Build Docker image based on Ubuntu for development.
|
||||
--build-arg COMMIT_SHA=$$(git rev-parse HEAD) \
|
||||
--build-arg BUILD_BRANCH=$$(git rev-parse --abbrev-ref HEAD) \
|
||||
--build-arg BASE_IMAGE=ubuntu:22.04 \
|
||||
--build-arg GO_IMAGE=golang:1.21.5 \
|
||||
--build-arg GO_IMAGE=golang:1.21.8 \
|
||||
--tag grafana/grafana$(TAG_SUFFIX):dev-ubuntu \
|
||||
$(DOCKER_BUILD_ARGS)
|
||||
|
||||
|
||||
@@ -134,6 +134,9 @@ log_queries =
|
||||
# For "mysql", use either "true", "false", or "skip-verify".
|
||||
ssl_mode = disable
|
||||
|
||||
# For "postregs", use either "1" to enable or "0" to disable SNI
|
||||
ssl_sni =
|
||||
|
||||
# Database drivers may support different transaction isolation levels.
|
||||
# Currently, only "mysql" driver supports isolation levels.
|
||||
# If the value is empty - driver's default isolation level is applied.
|
||||
@@ -246,7 +249,7 @@ reporting_distributor = grafana-labs
|
||||
# for new versions of grafana. The check is used
|
||||
# in some UI views to notify that a grafana update exists.
|
||||
# This option does not cause any auto updates, nor send any information
|
||||
# only a GET request to https://raw.githubusercontent.com/grafana/grafana/main/latest.json to get the latest version.
|
||||
# only a GET request to https://grafana.com/api/grafana/versions/stable to get the latest version.
|
||||
check_for_updates = true
|
||||
|
||||
# Set to false to disable all checks to https://grafana.com
|
||||
@@ -664,6 +667,7 @@ token_url = https://oauth2.googleapis.com/token
|
||||
api_url = https://openidconnect.googleapis.com/v1/userinfo
|
||||
signout_redirect_url =
|
||||
allowed_domains =
|
||||
validate_hd = false
|
||||
hosted_domain =
|
||||
allowed_groups =
|
||||
role_attribute_path =
|
||||
|
||||
@@ -124,6 +124,9 @@
|
||||
# For "mysql", use either "true", "false", or "skip-verify".
|
||||
;ssl_mode = disable
|
||||
|
||||
# For "postregs", use either "1" to enable or "0" to disable SNI
|
||||
;ssl_sni =
|
||||
|
||||
# Database drivers may support different transaction isolation levels.
|
||||
# Currently, only "mysql" driver supports isolation levels.
|
||||
# If the value is empty - driver's default isolation level is applied.
|
||||
@@ -253,7 +256,7 @@
|
||||
# for new versions of grafana. The check is used
|
||||
# in some UI views to notify that a grafana update exists.
|
||||
# This option does not cause any auto updates, nor send any information
|
||||
# only a GET request to https://raw.githubusercontent.com/grafana/grafana/main/latest.json to get the latest version.
|
||||
# only a GET request to https://grafana.com/api/grafana/versions/stable to get the latest version.
|
||||
;check_for_updates = true
|
||||
|
||||
# Set to false to disable all checks to https://grafana.com
|
||||
@@ -643,6 +646,7 @@
|
||||
;api_url = https://openidconnect.googleapis.com/v1/userinfo
|
||||
;signout_redirect_url =
|
||||
;allowed_domains =
|
||||
;validate_hd =
|
||||
;hosted_domain =
|
||||
;allowed_groups =
|
||||
;role_attribute_path =
|
||||
|
||||
@@ -26,6 +26,6 @@ Grafana employees can find more details in our internal docs.
|
||||
|
||||
## Announced deprecations.
|
||||
|
||||
| Name | Annoucement Date | Disabling date | Removal Date | Description | Status |
|
||||
| ------------------------------------------------------------------------ | ---------------- | -------------- | ------------ | ----------------------------------------------------------------------------------------------------------------------- | ------- |
|
||||
| [Support for Mysql 5.7](https://github.com/grafana/grafana/issues/68446) | 2023-05-15 | October 2023 | | MySQL 5.7 is being deprecated in October 2023 and Grafana's policy is to test against the officially supported version. | Planned |
|
||||
| Name | Announcement Date | Disabling date | Removal Date | Description | Status |
|
||||
| ------------------------------------------------------------------------ | ----------------- | -------------- | ------------ | ----------------------------------------------------------------------------------------------------------------------- | ------- |
|
||||
| [Support for Mysql 5.7](https://github.com/grafana/grafana/issues/68446) | 2023-05-15 | October 2023 | | MySQL 5.7 is being deprecated in October 2023 and Grafana's policy is to test against the officially supported version. | Planned |
|
||||
|
||||
@@ -14,4 +14,4 @@ The Drone pipelines are built with [Starlark](https://github.com/bazelbuild/star
|
||||
- Open a PR where you can do test runs for your changes. If you need to experiment with secrets, create a PR in the [grafana-ci-sandbox repo](https://github.com/grafana/grafana-ci-sandbox), before opening a PR in the main repo.
|
||||
- Run `make drone` after making changes to the Starlark files. This builds the `.drone.yml` file.
|
||||
|
||||
For further questions, reach out to the grafana-delivery squad.
|
||||
For further questions, reach out to the grafana-release-guild squad.
|
||||
|
||||
@@ -180,7 +180,7 @@ const getStyles = (theme: GrafanaTheme2) => ({
|
||||
});
|
||||
```
|
||||
|
||||
Use hook useStyles2(getStyles) to memoize the styles generation and try to avoid passing props to the the getStyles function and instead compose classes using emotion cx function.
|
||||
Use hook useStyles2(getStyles) to memoize the styles generation and try to avoid passing props to the getStyles function and instead compose classes using emotion cx function.
|
||||
|
||||
#### Use `ALL_CAPS` for constants.
|
||||
|
||||
|
||||
109
docs/make-docs
109
docs/make-docs
@@ -6,7 +6,44 @@
|
||||
# [Semantic versioning](https://semver.org/) is used to help the reader identify the significance of changes.
|
||||
# Changes are relevant to this script and the support docs.mk GNU Make interface.
|
||||
#
|
||||
|
||||
# ## 6.0.1 (2024-02-28)
|
||||
#
|
||||
# ### Added
|
||||
#
|
||||
# - Suppress new errors relating to absent content introduced in https://github.com/grafana/website/pull/17561.
|
||||
#
|
||||
# ## 6.0.0 (2024-02-16)
|
||||
#
|
||||
# ### Changed
|
||||
#
|
||||
# - Require `jq` for human readable `make doc-validator` output.
|
||||
#
|
||||
# ## 5.4.0 (2024-02-12)
|
||||
#
|
||||
# ### Changed
|
||||
#
|
||||
# - Set `WEBSITE_MOUNTS=true` when a user includes the `website` project.
|
||||
#
|
||||
# Ensures consistent behavior across repositories.
|
||||
# To disable website mounts, add `export WEBSITE_MOUNTS := false` to your `variables.mk` or `variables.mk.local` file.
|
||||
# - Use website mounts and container volumes also when a user includes the `grafana-cloud` project.
|
||||
#
|
||||
# ## 5.3.0 (2024-02-08)
|
||||
#
|
||||
# ### Changed
|
||||
#
|
||||
# - Updated support for plugins monorepo now that multiple projects have been moved into it.
|
||||
# - Use `printf` instead of `echo` for better portability of output.
|
||||
#
|
||||
# https://www.in-ulm.de/~mascheck/various/echo+printf/
|
||||
#
|
||||
# ## 5.2.0 (2024-01-18)
|
||||
#
|
||||
# ### Changed
|
||||
#
|
||||
# - Updated `make vale` to use latest Vale style and configuration.
|
||||
# - Updated `make vale` to use platform appropriate image.
|
||||
#
|
||||
# ## 5.1.2 (2023-11-08)
|
||||
#
|
||||
# ### Added
|
||||
@@ -191,8 +228,6 @@ readonly DOC_VALIDATOR_SKIP_CHECKS="${DOC_VALIDATOR_SKIP_CHECKS:-^image-}"
|
||||
readonly HUGO_REFLINKSERRORLEVEL="${HUGO_REFLINKSERRORLEVEL:-WARNING}"
|
||||
readonly VALE_MINALERTLEVEL="${VALE_MINALERTLEVEL:-error}"
|
||||
readonly WEBSITE_EXEC="${WEBSITE_EXEC:-make server-docs}"
|
||||
# If set, the docs-base image will run a prebuild script that sets up Hugo mounts.
|
||||
readonly WEBSITE_MOUNTS="${WEBSITE_MOUNTS:-}"
|
||||
|
||||
PODMAN="$(if command -v podman >/dev/null 2>&1; then echo podman; else echo docker; fi)"
|
||||
|
||||
@@ -264,10 +299,7 @@ SOURCES_helm_charts_mimir_distributed='mimir'
|
||||
SOURCES_helm_charts_tempo_distributed='tempo'
|
||||
SOURCES_opentelemetry='opentelemetry-docs'
|
||||
SOURCES_plugins_grafana_datadog_datasource='datadog-datasource'
|
||||
SOURCES_plugins_grafana_jira_datasource='jira-datasource'
|
||||
SOURCES_plugins_grafana_mongodb_datasource='mongodb-datasource'
|
||||
SOURCES_plugins_grafana_oracle_datasource='oracle-datasource'
|
||||
SOURCES_plugins_grafana_splunk_datasource='splunk-datasource'
|
||||
|
||||
VERSIONS_as_code='UNVERSIONED'
|
||||
VERSIONS_grafana_cloud='UNVERSIONED'
|
||||
@@ -278,10 +310,7 @@ VERSIONS_grafana_cloud_data_configuration_integrations='UNVERSIONED'
|
||||
VERSIONS_grafana_cloud_frontend_observability_faro_web_sdk='UNVERSIONED'
|
||||
VERSIONS_opentelemetry='UNVERSIONED'
|
||||
VERSIONS_plugins_grafana_datadog_datasource='latest'
|
||||
VERSIONS_plugins_grafana_jira_datasource='latest'
|
||||
VERSIONS_plugins_grafana_mongodb_datasource='latest'
|
||||
VERSIONS_plugins_grafana_oracle_datasource='latest'
|
||||
VERSIONS_plugins_grafana_splunk_datasource='latest'
|
||||
VERSIONS_technical_documentation='UNVERSIONED'
|
||||
VERSIONS_website='UNVERSIONED'
|
||||
VERSIONS_writers_toolkit='UNVERSIONED'
|
||||
@@ -291,10 +320,7 @@ PATHS_helm_charts_mimir_distributed='docs/sources/helm-charts/mimir-distributed'
|
||||
PATHS_helm_charts_tempo_distributed='docs/sources/helm-charts/tempo-distributed'
|
||||
PATHS_mimir='docs/sources/mimir'
|
||||
PATHS_plugins_grafana_datadog_datasource='docs/sources'
|
||||
PATHS_plugins_grafana_jira_datasource='docs/sources'
|
||||
PATHS_plugins_grafana_mongodb_datasource='docs/sources'
|
||||
PATHS_plugins_grafana_oracle_datasource='docs/sources'
|
||||
PATHS_plugins_grafana_splunk_datasource='docs/sources'
|
||||
PATHS_tempo='docs/sources/tempo'
|
||||
PATHS_website='content'
|
||||
|
||||
@@ -418,7 +444,7 @@ proj_url() {
|
||||
$1
|
||||
POSIX_HERESTRING
|
||||
|
||||
if [ "${_project}" = 'website' ]; then
|
||||
if [ "${_project}" = website ]; then
|
||||
echo "http://localhost:${DOCS_HOST_PORT}/docs/"
|
||||
|
||||
unset _project _version
|
||||
@@ -452,7 +478,7 @@ proj_dst() {
|
||||
$1
|
||||
POSIX_HERESTRING
|
||||
|
||||
if [ "${_project}" = 'website' ]; then
|
||||
if [ "${_project}" = website ]; then
|
||||
echo '/hugo/content'
|
||||
|
||||
unset _project _version
|
||||
@@ -511,7 +537,7 @@ proj_canonical() {
|
||||
$1
|
||||
POSIX_HERESTRING
|
||||
|
||||
if [ "${_project}" = 'website' ]; then
|
||||
if [ "${_project}" = website ]; then
|
||||
echo '/docs'
|
||||
|
||||
unset _project _version
|
||||
@@ -580,12 +606,11 @@ await_build() {
|
||||
while [ "${i}" -ne "${max}" ]
|
||||
do
|
||||
sleep 1
|
||||
debg "Retrying request to webserver assuming the process is still starting up."
|
||||
debg "Retrying request to web server assuming the process is still starting up."
|
||||
i=$((i + 1))
|
||||
|
||||
if ${req} "${url}"; then
|
||||
echo
|
||||
echo "View documentation locally:"
|
||||
printf '\r\nView documentation locally:\r\n'
|
||||
for x in ${url_src_dst_vers}; do
|
||||
IFS='^' read -r url _ _ <<POSIX_HERESTRING
|
||||
$x
|
||||
@@ -593,19 +618,18 @@ POSIX_HERESTRING
|
||||
|
||||
if [ -n "${url}" ]; then
|
||||
if [ "${_url}" != "arbitrary" ]; then
|
||||
echo " ${url}"
|
||||
printf '\r %s\r\n' "${url}"
|
||||
fi
|
||||
fi
|
||||
done
|
||||
echo
|
||||
echo 'Press Ctrl+C to stop the server'
|
||||
printf '\r\nPress Ctrl+C to stop the server\r\n'
|
||||
|
||||
unset i max req url
|
||||
return
|
||||
fi
|
||||
done
|
||||
|
||||
echo
|
||||
printf '\r\n'
|
||||
errr 'The build was interrupted or a build error occurred, check the previous logs for possible causes.'
|
||||
note 'You might need to use Ctrl+C to end the process.'
|
||||
|
||||
@@ -614,16 +638,16 @@ POSIX_HERESTRING
|
||||
|
||||
debg() {
|
||||
if [ -n "${DEBUG}" ]; then
|
||||
echo "DEBG: $1" >&2
|
||||
printf 'DEBG: %s\r\n' "$1" >&2
|
||||
fi
|
||||
}
|
||||
|
||||
errr() {
|
||||
echo "ERRR: $1" >&2
|
||||
printf 'ERRR: %s\r\n' "$1" >&2
|
||||
}
|
||||
|
||||
note() {
|
||||
echo "NOTE: $1" >&2
|
||||
printf 'NOTE: %s\r\n' "$1" >&2
|
||||
}
|
||||
|
||||
url_src_dst_vers="$(url_src_dst_vers "$@")"
|
||||
@@ -635,9 +659,16 @@ for arg in "$@"; do
|
||||
IFS=: read -r _project _ _repo _ <<POSIX_HERESTRING
|
||||
${arg}
|
||||
POSIX_HERESTRING
|
||||
if [ "${_project}" = website ]; then
|
||||
if [ "${_project}" = website ] || [ "${_project}" = grafana-cloud ]; then
|
||||
note "Please be patient, building the website can take some time."
|
||||
|
||||
# If set, the docs-base image will run a prebuild script that sets up Hugo mounts.
|
||||
if [ "${WEBSITE_MOUNTS}" = false ]; then
|
||||
unset WEBSITE_MOUNTS
|
||||
else
|
||||
readonly WEBSITE_MOUNTS=true
|
||||
fi
|
||||
|
||||
_repo="$(repo_path website)"
|
||||
volumes="--volume=${_repo}/config:/hugo/config"
|
||||
volumes="${volumes} --volume=${_repo}/layouts:/hugo/layouts"
|
||||
@@ -683,8 +714,15 @@ POSIX_HERESTRING
|
||||
|
||||
case "${image}" in
|
||||
'grafana/doc-validator')
|
||||
if ! command -v jq >/dev/null 2>&1; then
|
||||
errr '`jq` must be installed for the `doc-validator` target to work.'
|
||||
note 'To install `jq`, refer to https://jqlang.github.io/jq/download/,'
|
||||
|
||||
exit 1
|
||||
fi
|
||||
|
||||
proj="$(new_proj "$1")"
|
||||
echo
|
||||
printf '\r\n'
|
||||
"${PODMAN}" run \
|
||||
--init \
|
||||
--interactive \
|
||||
@@ -695,23 +733,25 @@ case "${image}" in
|
||||
"${DOCS_IMAGE}" \
|
||||
"--include=${DOC_VALIDATOR_INCLUDE}" \
|
||||
"--skip-checks=${DOC_VALIDATOR_SKIP_CHECKS}" \
|
||||
/hugo/content/docs \
|
||||
"$(proj_canonical "${proj}")" | sed "s#$(proj_dst "${proj}")#sources#"
|
||||
"/hugo/content$(proj_canonical "${proj}")" \
|
||||
"$(proj_canonical "${proj}")" \
|
||||
| sed "s#$(proj_dst "${proj}")#sources#" \
|
||||
| jq -r '"ERROR: \(.location.path):\(.location.range.start.line // 1):\(.location.range.start.column // 1): \(.message)" + if .suggestions[0].text then "\nSuggestion: \(.suggestions[0].text)" else "" end'
|
||||
;;
|
||||
'grafana/vale')
|
||||
proj="$(new_proj "$1")"
|
||||
echo
|
||||
printf '\r\n'
|
||||
"${PODMAN}" run \
|
||||
--init \
|
||||
--interactive \
|
||||
--platform linux/amd64 \
|
||||
--rm \
|
||||
--workdir /etc/vale \
|
||||
--tty \
|
||||
${volumes} \
|
||||
"${DOCS_IMAGE}" \
|
||||
"--minAlertLevel=${VALE_MINALERTLEVEL}" \
|
||||
--config=/etc/vale/.vale.ini \
|
||||
--output=line \
|
||||
'--glob=*.md' \
|
||||
--output=/etc/vale/rdjsonl.tmpl \
|
||||
/hugo/content/docs | sed "s#$(proj_dst "${proj}")#sources#"
|
||||
;;
|
||||
*)
|
||||
@@ -788,7 +828,8 @@ EOF
|
||||
-e '/rm -rf dist*/ d' \
|
||||
-e '/Press Ctrl+C to stop/ d' \
|
||||
-e '/make/ d' \
|
||||
-e '/WARNING: The manual_mount source directory/ d'
|
||||
-e '/WARNING: The manual_mount source directory/ d' \
|
||||
-e '/docs\/_index.md .* not found/ d'
|
||||
fi
|
||||
;;
|
||||
esac
|
||||
|
||||
@@ -42,6 +42,10 @@ title: Grafana open source documentation
|
||||
<img src="/static/img/logos/logo-docker.svg">
|
||||
<h5>Run Docker image</h5>
|
||||
</a>
|
||||
<a href="{{< relref "setup-grafana/installation/kubernetes/" >}}" class="nav-cards__item nav-cards__item--install">
|
||||
<img src="/static/img/logos/logo-kubernetes.svg">
|
||||
<h5>Run on Kubernetes</h5>
|
||||
</a>
|
||||
<a href="https://grafana.com/docs/grafana-cloud/" class="nav-cards__item nav-cards__item--install">
|
||||
<div class="nav-cards__icon fa fa-cloud">
|
||||
</div>
|
||||
@@ -77,8 +81,8 @@ title: Grafana open source documentation
|
||||
<h4>Provisioning</h4>
|
||||
<p>Learn how to automate your Grafana configuration.</p>
|
||||
</a>
|
||||
<a href="{{< relref "whatsnew/whats-new-in-v10-2/" >}}" class="nav-cards__item nav-cards__item--guide">
|
||||
<h4>What's new in v10.2</h4>
|
||||
<a href="{{< relref "whatsnew/whats-new-in-v10-3/" >}}" class="nav-cards__item nav-cards__item--guide">
|
||||
<h4>What's new in v10.3</h4>
|
||||
<p>Explore the features and enhancements in the latest release.</p>
|
||||
</a>
|
||||
|
||||
|
||||
@@ -10,7 +10,7 @@ description: Data source management information for Grafana administrators
|
||||
labels:
|
||||
products:
|
||||
- enterprise
|
||||
- oss
|
||||
- cloud
|
||||
title: Data source management
|
||||
weight: 100
|
||||
---
|
||||
@@ -21,27 +21,15 @@ Grafana supports many different storage backends for your time series data (data
|
||||
Refer to [data sources]({{< relref "../../datasources" >}}) for more information about using data sources in Grafana.
|
||||
Only users with the organization admin role can add data sources.
|
||||
|
||||
## Add a data source
|
||||
|
||||
Before you can create your first dashboard, you need to add your data source.
|
||||
|
||||
{{% admonition type="note" %}}
|
||||
Only users with the organization admin role can add data sources.
|
||||
{{% /admonition %}}
|
||||
|
||||
**To add a data source:**
|
||||
|
||||
1. Click **Connections** in the left-side menu.
|
||||
1. Enter the name of a specific data source in the search dialog. You can filter by **Data source** to only see data sources.
|
||||
1. Click the data source you want to add.
|
||||
1. Configure the data source following instructions specific to that data source.
|
||||
|
||||
For links to data source-specific documentation, see [Data sources]({{< relref "../../datasources" >}}).
|
||||
|
||||
## Data source permissions
|
||||
|
||||
You can configure data source permissions to allow or deny certain users the ability to query, edit, or administrate a data source. Each data source’s configuration includes a Permissions tab where you can restrict data source permissions to specific users, service accounts, teams, or roles.
|
||||
Query permission allows users to query the data source. Edit permission allows users to query the data source, edit the data source’s configuration and delete the data source. Admin permission allows users to query and edit the data source, change permissions on the data source and enable or disable query caching for the data source.
|
||||
|
||||
- The `query` permission allows users to query the data source.
|
||||
- The `edit` permission allows users to query the data source, edit the data source’s configuration and delete the data source.
|
||||
- The `admin` permission allows users to query and edit the data source, change permissions on the data source and enable or disable query caching for the data source.
|
||||
|
||||
{{% admonition type="note" %}}
|
||||
Available in [Grafana Enterprise]({{< relref "../../introduction/grafana-enterprise/" >}}) and [Grafana Cloud](/docs/grafana-cloud).
|
||||
@@ -71,7 +59,7 @@ You can assign data source permissions to users, service accounts, teams, and ro
|
||||
1. Click **Connections** in the left-side menu.
|
||||
1. Under Your connections, click **Data sources**.
|
||||
1. Select the data source for which you want to edit permissions.
|
||||
1. On the Permissions tab, find the user, service account, team, or role permission you want to update.
|
||||
1. On the Permissions tab, find the **User**, **Service Account**, **Team**, or **Role** permission you want to update.
|
||||
1. Select a different option in the **Permission** dropdown.
|
||||
|
||||
<div class="clearfix"></div>
|
||||
@@ -81,7 +69,7 @@ You can assign data source permissions to users, service accounts, teams, and ro
|
||||
1. Click **Connections** in the left-side menu.
|
||||
1. Under Your connections, click **Data sources**.
|
||||
1. Select the data source from which you want to remove permissions.
|
||||
1. On the Permissions tab, find the user, service account, team, or role permission you want to remove.
|
||||
1. On the Permissions tab, find the **User**, **Service Account**, **Team**, or **Role** permission you want to remove.
|
||||
1. Click the **X** next to the permission.
|
||||
|
||||
<div class="clearfix"></div>
|
||||
@@ -178,22 +166,3 @@ This action impacts all cache-enabled data sources. If you are using Memcached,
|
||||
### Sending a request without cache
|
||||
|
||||
If a data source query request contains an `X-Cache-Skip` header, then Grafana skips the caching middleware, and does not search the cache for a response. This can be particularly useful when debugging data source queries using cURL.
|
||||
|
||||
## Add data source plugins
|
||||
|
||||
Grafana ships with several [built-in data sources]({{< relref "../../datasources#built-in-core-data-sources" >}}).
|
||||
You can add additional data sources as plugins, which you can install or create yourself.
|
||||
|
||||
### Find data source plugins in the plugin catalog
|
||||
|
||||
To view available data source plugins, go to the [plugin catalog](/grafana/plugins/?type=datasource) and select the "Data sources" filter.
|
||||
For details about the plugin catalog, refer to [Plugin management]({{< relref "../../administration/plugin-management/" >}}).
|
||||
|
||||
You can further filter the plugin catalog's results for data sources provided by the Grafana community, Grafana Labs, and partners.
|
||||
If you use [Grafana Enterprise]({{< relref "../../introduction/grafana-enterprise/" >}}), you can also filter by Enterprise-supported plugins.
|
||||
|
||||
For more documentation on a specific data source plugin's features, including its query language and editor, refer to its plugin catalog page.
|
||||
|
||||
### Create a data source plugin
|
||||
|
||||
To build your own data source plugin, refer to the ["Build a data source plugin"](/developers/plugin-tools/tutorials/build-a-data-source-plugin) tutorial and our documentation about [building a plugin](/developers/plugin-tools).
|
||||
|
||||
@@ -22,7 +22,7 @@ The table below describes all RBAC configuration options. Like any other Grafana
|
||||
| Setting | Required | Description | Default |
|
||||
| ------------------------------- | -------- | ------------------------------------------------------------------------------------------------------------------------------------------------------------------------------------------------------------------------------------------------------------------------------------------------------------------------------- | ------- |
|
||||
| `permission_cache` | No | Enable to use in memory cache for loading and evaluating users' permissions. | `true` |
|
||||
| `permission_validation_enabled` | No | Grafana enforces validation for permissions when a user creates or updates a role. The system checks the internal list of scopes and actions for each permission to determine they are valid. By default, if a scope or action is not recognized, Grafana logs a warning message. When set to `true`, Grafana returns an error. | `false` |
|
||||
| `permission_validation_enabled` | No | Grafana enforces validation for permissions when a user creates or updates a role. The system checks the internal list of scopes and actions for each permission to determine they are valid. By default, if a scope or action is not recognized, Grafana logs a warning message. When set to `true`, Grafana returns an error. | `true` |
|
||||
| `reset_basic_roles` | No | Reset Grafana's basic roles' (Viewer, Editor, Admin, Grafana Admin) permissions to their default. Warning, if this configuration option is left to `true` this will be done on every reboot. | `true` |
|
||||
|
||||
## Example RBAC configuration
|
||||
|
||||
@@ -28,7 +28,7 @@ The following tables list permissions associated with basic and fixed roles.
|
||||
| Grafana Admin | `fixed:roles:reader`<br>`fixed:roles:writer`<br>`fixed:users:reader`<br>`fixed:users:writer`<br>`fixed:org.users:reader`<br>`fixed:org.users:writer`<br>`fixed:ldap:reader`<br>`fixed:ldap:writer`<br>`fixed:stats:reader`<br>`fixed:settings:reader`<br>`fixed:settings:writer`<br>`fixed:provisioning:writer`<br>`fixed:organization:reader`<br>`fixed:organization:maintainer`<br>`fixed:licensing:reader`<br>`fixed:licensing:writer`<br>`fixed:datasources.caching:reader`<br>`fixed:datasources.caching:writer`<br>`fixed:dashboards.insights:reader`<br>`fixed:datasources.insights:reader`<br>`fixed:plugins:maintainer`<br>`fixed:authentication.config:writer` | Default [Grafana server administrator]({{< relref "../../#grafana-server-administrators" >}}) assignments. |
|
||||
| Admin | `fixed:reports:reader`<br>`fixed:reports:writer`<br>`fixed:datasources:reader`<br>`fixed:datasources:writer`<br>`fixed:organization:writer`<br>`fixed:datasources.permissions:reader`<br>`fixed:datasources.permissions:writer`<br>`fixed:teams:writer`<br>`fixed:dashboards:reader`<br>`fixed:dashboards:writer`<br>`fixed:dashboards.permissions:reader`<br>`fixed:dashboards.permissions:writer`<br>`fixed:dashboards.public:writer`<br>`fixed:folders:reader`<br>`fixed:folders:writer`<br>`fixed:folders.permissions:reader`<br>`fixed:folders.permissions:writer`<br>`fixed:alerting:writer`<br>`fixed:apikeys:reader`<br>`fixed:apikeys:writer`<br>`fixed:alerting.provisioning.secrets:reader`<br>`fixed:alerting.provisioning:writer`<br>`fixed:datasources.caching:reader`<br>`fixed:datasources.caching:writer`<br>`fixed:dashboards.insights:reader`<br>`fixed:datasources.insights:reader`<br>`fixed:plugins:writer` | Default [Grafana organization administrator]({{< relref "../#basic-roles" >}}) assignments. |
|
||||
| Editor | `fixed:datasources:explorer`<br>`fixed:dashboards:creator`<br>`fixed:folders:creator`<br>`fixed:annotations:writer`<br>`fixed:teams:creator` if the `editors_can_admin` configuration flag is enabled<br>`fixed:alerting:writer`<br>`fixed:dashboards.insights:reader`<br>`fixed:datasources.insights:reader` | Default [Editor]({{< relref "../#basic-roles" >}}) assignments. |
|
||||
| Viewer | `fixed:datasources:id:reader`<br>`fixed:organization:reader`<br>`fixed:annotations:reader`<br>`fixed:annotations.dashboard:writer`<br>`fixed:alerting:reader`<br>`fixed:plugins.app:reader`<br>`fixed:dashboards.insights:reader`<br>`fixed:datasources.insights:reader` | Default [Viewer]({{< relref "../#basic-roles" >}}) assignments. |
|
||||
| Viewer | `fixed:datasources.id:reader`<br>`fixed:organization:reader`<br>`fixed:annotations:reader`<br>`fixed:annotations.dashboard:writer`<br>`fixed:alerting:reader`<br>`fixed:plugins.app:reader`<br>`fixed:dashboards.insights:reader`<br>`fixed:datasources.insights:reader` | Default [Viewer]({{< relref "../#basic-roles" >}}) assignments. |
|
||||
| No Basic Role | | Default [No Basic Role]({{< relref "../#basic-roles" >}}) |
|
||||
|
||||
## Fixed role definitions
|
||||
@@ -61,7 +61,7 @@ The following tables list permissions associated with basic and fixed roles.
|
||||
| `fixed:datasources.caching:reader` | `datasources.caching:read` | Read data source query caching settings. |
|
||||
| `fixed:datasources.caching:writer` | `datasources.caching:read`<br>`datasources.caching:write` | Enable, disable, or update query caching settings. |
|
||||
| `fixed:datasources:explorer` | `datasources:explore` | Enable the Explore feature. Data source permissions still apply, you can only query data sources for which you have query permissions. |
|
||||
| `fixed:datasources:id:reader` | `datasources.id:read` | Read the ID of a data source based on its name. |
|
||||
| `fixed:datasources.id:reader` | `datasources.id:read` | Read the ID of a data source based on its name. |
|
||||
| `fixed:datasources.insights:reader` | `datasources.insights:read` | Read data source insights data. |
|
||||
| `fixed:datasources.permissions:reader` | `datasources.permissions:read` | Read data source permissions. |
|
||||
| `fixed:datasources.permissions:writer` | All permissions from `fixed:datasources.permissions:reader` and <br>`datasources.permissions:write` | Create, read, or delete permissions of a data source. |
|
||||
|
||||
@@ -92,9 +92,9 @@ Here are some tips on how to create an effective alert management set up for you
|
||||
- [Introduction to Alerting][fundamentals]
|
||||
|
||||
{{% docs/reference %}}
|
||||
[alerting-rules]: "/docs/grafana/ -> /docs/grafana/<GRAFANA VERSION>/alerting/alerting-rules"
|
||||
[alerting-rules]: "/docs/grafana/ -> /docs/grafana/<GRAFANA_VERSION>/alerting/alerting-rules"
|
||||
[alerting-rules]: "/docs/grafana-cloud/ -> /docs/grafana-cloud/alerting-and-irm/alerting/alerting-rules"
|
||||
|
||||
[fundamentals]: "/docs/grafana/ -> /docs/grafana/<GRAFANA VERSION>/alerting/fundamentals"
|
||||
[fundamentals]: "/docs/grafana/ -> /docs/grafana/<GRAFANA_VERSION>/alerting/fundamentals"
|
||||
[fundamentals]: "/docs/grafana-cloud/ -> /docs/grafana-cloud/alerting-and-irm/alerting/fundamentals"
|
||||
{{% /docs/reference %}}
|
||||
|
||||
@@ -41,18 +41,18 @@ For information on how to configure contact points, see [Configure contact point
|
||||
For information on how to configure notification policies, see [Configure notification policies][create-notification-policy].
|
||||
|
||||
{{% docs/reference %}}
|
||||
[create-mimir-loki-managed-rule]: "/docs/grafana/ -> /docs/grafana/<GRAFANA VERSION>/alerting/alerting-rules/create-mimir-loki-managed-rule"
|
||||
[create-mimir-loki-managed-rule]: "/docs/grafana/ -> /docs/grafana/<GRAFANA_VERSION>/alerting/alerting-rules/create-mimir-loki-managed-rule"
|
||||
[create-mimir-loki-managed-rule]: "/docs/grafana-cloud/ -> /docs/grafana-cloud/alerting-and-irm/alerting/alerting-rules/create-mimir-loki-managed-rule"
|
||||
|
||||
[create-mimir-loki-managed-recording-rule]: "/docs/grafana/ -> /docs/grafana/<GRAFANA VERSION>/alerting/alerting-rules/create-mimir-loki-managed-recording-rule"
|
||||
[create-mimir-loki-managed-recording-rule]: "/docs/grafana/ -> /docs/grafana/<GRAFANA_VERSION>/alerting/alerting-rules/create-mimir-loki-managed-recording-rule"
|
||||
[create-mimir-loki-managed-recording-rule]: "/docs/grafana-cloud/ -> /docs/grafana-cloud/alerting-and-irm/alerting/alerting-rules/create-mimir-loki-managed-recording-rule"
|
||||
|
||||
[create-grafana-managed-rule]: "/docs/grafana/ -> /docs/grafana/<GRAFANA VERSION>/alerting/alerting-rules/create-grafana-managed-rule"
|
||||
[create-grafana-managed-rule]: "/docs/grafana/ -> /docs/grafana/<GRAFANA_VERSION>/alerting/alerting-rules/create-grafana-managed-rule"
|
||||
[create-grafana-managed-rule]: "/docs/grafana-cloud/ -> /docs/grafana-cloud/alerting-and-irm/alerting/alerting-rules/create-grafana-managed-rule"
|
||||
|
||||
[manage-contact-points]: "/docs/grafana/ -> /docs/grafana/<GRAFANA VERSION>/alerting/alerting-rules/manage-contact-points"
|
||||
[manage-contact-points]: "/docs/grafana/ -> /docs/grafana/<GRAFANA_VERSION>/alerting/alerting-rules/manage-contact-points"
|
||||
[manage-contact-points]: "/docs/grafana-cloud/ -> /docs/grafana-cloud/alerting-and-irm/alerting/alerting-rules/manage-contact-points"
|
||||
|
||||
[create-notification-policy]: "/docs/grafana/ -> /docs/grafana/<GRAFANA VERSION>/alerting/alerting-rules/create-notification-policy"
|
||||
[create-notification-policy]: "/docs/grafana/ -> /docs/grafana/<GRAFANA_VERSION>/alerting/alerting-rules/create-notification-policy"
|
||||
[create-notification-policy]: "/docs/grafana-cloud/ -> /docs/grafana-cloud/alerting-and-irm/alerting/alerting-rules/create-notification-policy"
|
||||
{{% /docs/reference %}}
|
||||
|
||||
@@ -71,6 +71,7 @@ Define a query to get the data you want to measure and a condition that needs to
|
||||
All alert rules are managed by Grafana by default. If you want to switch to a data source-managed alert rule, click **Switch to data source-managed alert rule**.
|
||||
|
||||
1. Add one or more [expressions][expression-queries].
|
||||
|
||||
a. For each expression, select either **Classic condition** to create a single alert rule, or choose from the **Math**, **Reduce**, and **Resample** options to generate separate alert for each series.
|
||||
|
||||
{{% admonition type="note" %}}
|
||||
@@ -79,6 +80,14 @@ Define a query to get the data you want to measure and a condition that needs to
|
||||
|
||||
b. Click **Preview** to verify that the expression is successful.
|
||||
|
||||
{{% admonition type="note" %}}
|
||||
The recovery threshold feature is currently only available in OSS.
|
||||
{{% /admonition %}}
|
||||
|
||||
1. To add a recovery threshold, turn the **Custom recovery threshold** toggle on and fill in a value for when your alert rule should stop firing.
|
||||
|
||||
You can only add one recovery threshold in a query and it must be the alert condition.
|
||||
|
||||
1. Click **Set as alert condition** on the query or expression you want to set as your alert condition.
|
||||
|
||||
## Set alert evaluation behavior
|
||||
@@ -102,11 +111,11 @@ To do this, you need to make sure that your alert rule is in the right evaluatio
|
||||
|
||||
1. Turn on pause alert notifications, if required.
|
||||
|
||||
**Note**:
|
||||
|
||||
Pause alert rule evaluation to prevent noisy alerting while tuning your alerts. Pausing stops alert rule evaluation and does not create any alert instances. This is different to mute timings, which stop notifications from being delivered, but still allow for alert rule evaluation and the creation of alert instances.
|
||||
|
||||
You can pause alert rule evaluation to prevent noisy alerting while tuning your alerts. Pausing stops alert rule evaluation and does not create any alert instances. This is different to mute timings, which stop notifications from being delivered, but still allow for alert rule evaluation and the creation of alert instances.
|
||||
{{< admonition type="note" >}}
|
||||
You can pause alert rule evaluation to prevent noisy alerting while tuning your alerts.
|
||||
Pausing stops alert rule evaluation and doesn't create any alert instances.
|
||||
This is different to mute timings, which stop notifications from being delivered, but still allows for alert rule evaluation and the creation of alert instances.
|
||||
{{< /admonition >}}
|
||||
|
||||
1. In **Configure no data and error handling**, configure alerting behavior in the absence of data.
|
||||
|
||||
@@ -215,21 +224,21 @@ Create alerts from any panel type. This means you can reuse the queries in the p
|
||||
This will open the alert rule form, allowing you to configure and create your alert based on the current panel's query.
|
||||
|
||||
{{% docs/reference %}}
|
||||
[add-a-query]: "/docs/grafana/ -> /docs/grafana/<GRAFANA VERSION>/panels-visualizations/query-transform-data#add-a-query"
|
||||
[add-a-query]: "/docs/grafana-cloud/ -> /docs/grafana/<GRAFANA VERSION>/panels-visualizations/query-transform-data#add-a-query"
|
||||
[add-a-query]: "/docs/grafana/ -> /docs/grafana/<GRAFANA_VERSION>/panels-visualizations/query-transform-data#add-a-query"
|
||||
[add-a-query]: "/docs/grafana-cloud/ -> /docs/grafana/<GRAFANA_VERSION>/panels-visualizations/query-transform-data#add-a-query"
|
||||
|
||||
[alerting-on-numeric-data]: "/docs/grafana/ -> /docs/grafana/<GRAFANA VERSION>/alerting/fundamentals/evaluate-grafana-alerts#alerting-on-numeric-data-1"
|
||||
[alerting-on-numeric-data]: "/docs/grafana/ -> /docs/grafana/<GRAFANA_VERSION>/alerting/fundamentals/evaluate-grafana-alerts#alerting-on-numeric-data-1"
|
||||
[alerting-on-numeric-data]: "/docs/grafana-cloud/ -> /docs/grafana-cloud/alerting-and-irm/alerting/fundamentals/evaluate-grafana-alerts#alerting-on-numeric-data-1"
|
||||
|
||||
[annotation-label]: "/docs/grafana/ -> /docs/grafana/<GRAFANA VERSION>/alerting/fundamentals/annotation-label"
|
||||
[annotation-label]: "/docs/grafana/ -> /docs/grafana/<GRAFANA_VERSION>/alerting/fundamentals/annotation-label"
|
||||
[annotation-label]: "/docs/grafana-cloud/ -> /docs/grafana-cloud/alerting-and-irm/alerting/fundamentals/annotation-label"
|
||||
|
||||
[expression-queries]: "/docs/grafana/ -> /docs/grafana/<GRAFANA VERSION>/panels-visualizations/query-transform-data/expression-queries"
|
||||
[expression-queries]: "/docs/grafana-cloud/ -> /docs/grafana/<GRAFANA VERSION>/panels-visualizations/query-transform-data/expression-queries"
|
||||
[expression-queries]: "/docs/grafana/ -> /docs/grafana/<GRAFANA_VERSION>/panels-visualizations/query-transform-data/expression-queries"
|
||||
[expression-queries]: "/docs/grafana-cloud/ -> /docs/grafana/<GRAFANA_VERSION>/panels-visualizations/query-transform-data/expression-queries"
|
||||
|
||||
[fundamentals]: "/docs/grafana/ -> /docs/grafana/<GRAFANA VERSION>/alerting/fundamentals"
|
||||
[fundamentals]: "/docs/grafana/ -> /docs/grafana/<GRAFANA_VERSION>/alerting/fundamentals"
|
||||
[fundamentals]: "/docs/grafana-cloud/ -> /docs/grafana-cloud/alerting-and-irm/alerting/fundamentals"
|
||||
|
||||
[time-units-and-relative-ranges]: "/docs/grafana/ -> /docs/grafana/<GRAFANA VERSION>/dashboards/use-dashboards#time-units-and-relative-ranges"
|
||||
[time-units-and-relative-ranges]: "/docs/grafana-cloud/ -> /docs/grafana/<GRAFANA VERSION>/dashboards/use-dashboards#time-units-and-relative-ranges"
|
||||
[time-units-and-relative-ranges]: "/docs/grafana/ -> /docs/grafana/<GRAFANA_VERSION>/dashboards/use-dashboards#time-units-and-relative-ranges"
|
||||
[time-units-and-relative-ranges]: "/docs/grafana-cloud/ -> /docs/grafana/<GRAFANA_VERSION>/dashboards/use-dashboards#time-units-and-relative-ranges"
|
||||
{{% /docs/reference %}}
|
||||
|
||||
@@ -65,9 +65,9 @@ To create recording rules, follow these steps.
|
||||
1. Click **Save rule** to save the rule or **Save rule and exit** to save the rule and go back to the Alerting page.
|
||||
|
||||
{{% docs/reference %}}
|
||||
[annotation-label]: "/docs/grafana/ -> /docs/grafana/<GRAFANA VERSION>/alerting/fundamentals/annotation-label"
|
||||
[annotation-label]: "/docs/grafana/ -> /docs/grafana/<GRAFANA_VERSION>/alerting/fundamentals/annotation-label"
|
||||
[annotation-label]: "/docs/grafana-cloud/ -> /docs/grafana-cloud/alerting-and-irm/alerting/fundamentals/annotation-label"
|
||||
|
||||
[configure-grafana]: "/docs/grafana/ -> /docs/grafana/<GRAFANA VERSION>/setup-grafana/configure-grafana"
|
||||
[configure-grafana]: "/docs/grafana-cloud/ -> /docs/grafana/<GRAFANA VERSION>/setup-grafana/configure-grafana"
|
||||
[configure-grafana]: "/docs/grafana/ -> /docs/grafana/<GRAFANA_VERSION>/setup-grafana/configure-grafana"
|
||||
[configure-grafana]: "/docs/grafana-cloud/ -> /docs/grafana/<GRAFANA_VERSION>/setup-grafana/configure-grafana"
|
||||
{{% /docs/reference %}}
|
||||
|
||||
@@ -126,9 +126,9 @@ All alert rules and instances, irrespective of their labels, match the default n
|
||||
1. Click **Save rule**.
|
||||
|
||||
{{% docs/reference %}}
|
||||
[alerting]: "/docs/grafana/ -> /docs/grafana/<GRAFANA VERSION>/alerting"
|
||||
[alerting]: "/docs/grafana/ -> /docs/grafana/<GRAFANA_VERSION>/alerting"
|
||||
[alerting]: "/docs/grafana-cloud/ -> /docs/grafana-cloud/alerting-and-irm/alerting"
|
||||
|
||||
[annotation-label]: "/docs/grafana/ -> /docs/grafana/<GRAFANA VERSION>/alerting/fundamentals/annotation-label"
|
||||
[annotation-label]: "/docs/grafana/ -> /docs/grafana/<GRAFANA_VERSION>/alerting/fundamentals/annotation-label"
|
||||
[annotation-label]: "/docs/grafana-cloud/ -> /docs/grafana-cloud/alerting-and-irm/alerting/fundamentals/annotation-label"
|
||||
{{% /docs/reference %}}
|
||||
|
||||
@@ -111,6 +111,6 @@ An example of an alert configuration.
|
||||
- Create specific routes for particular teams that handle their own on-call rotations.
|
||||
|
||||
{{% docs/reference %}}
|
||||
[notification-policies]: "/docs/grafana/ -> /docs/grafana/<GRAFANA VERSION>/alerting/fundamentals/notification-policies"
|
||||
[notification-policies]: "/docs/grafana/ -> /docs/grafana/<GRAFANA_VERSION>/alerting/fundamentals/notification-policies"
|
||||
[notification-policies]: "/docs/grafana-cloud/ -> /docs/grafana-cloud/alerting-and-irm/alerting/fundamentals/notification-policies"
|
||||
{{% /docs/reference %}}
|
||||
|
||||
@@ -63,12 +63,12 @@ To set up the Grafana OnCall integration using the Grafana Alerting application,
|
||||
This redirects you to the Grafana OnCall integration page in the Grafana OnCall application. From there, you can add [routes and escalation chains][escalation-chain].
|
||||
|
||||
{{% docs/reference %}}
|
||||
[create-notification-policy]: "/docs/grafana/ -> /docs/grafana/<GRAFANA VERSION>/alerting/alerting-rules/create-notification-policy"
|
||||
[create-notification-policy]: "/docs/grafana/ -> /docs/grafana/<GRAFANA_VERSION>/alerting/alerting-rules/create-notification-policy"
|
||||
[create-notification-policy]: "/docs/grafana-cloud/ -> /docs/grafana-cloud/alerting-and-irm/alerting/alerting-rules/create-notification-policy"
|
||||
|
||||
[oncall-integration]: "/docs/grafana/ -> /docs/oncall/latest/integrations/grafana-alerting"
|
||||
[oncall-integration]: "/docs/grafana-cloud/ -> /docs/grafana-cloud/alerting-and-irm/oncall/integrations/grafana-alerting"
|
||||
|
||||
[escalation-chain]: "/docs/grafana/ -> /docs/oncall/latest/escalation-chains-and-routes"
|
||||
[escalation-chain]: "/docs/grafana-cloud/ -> /docs/grafana-cloud/alerting-and-irm/oncall/escalation-chains-and-routes"
|
||||
[escalation-chain]: "/docs/grafana/ -> /docs/oncall/latest/configure/escalation-chains-and-routes"
|
||||
[escalation-chain]: "/docs/grafana-cloud/ -> /docs/grafana-cloud/alerting-and-irm/oncall/configure/escalation-chains-and-routes"
|
||||
{{% /docs/reference %}}
|
||||
|
||||
@@ -2,7 +2,7 @@
|
||||
_build:
|
||||
list: false
|
||||
aliases:
|
||||
- ./unified-alerting/difference-old-new/ # /docs/grafana/<GRAFANA VERSION>/alerting/unified-alerting/difference-old-new/
|
||||
- ./unified-alerting/difference-old-new/ # /docs/grafana/<GRAFANA_VERSION>/alerting/unified-alerting/difference-old-new/
|
||||
canonical: https://grafana.com/docs/grafana/latest/alerting/difference-old-new/
|
||||
description: Learn about how Grafana Alerting compares to legacy alerting
|
||||
keywords:
|
||||
|
||||
@@ -69,8 +69,8 @@ Silences and mute timings allow you to pause notifications for specific alerts o
|
||||
You can create your alerting resources (alert rules, notification policies, and so on) in the Grafana UI; configmaps, files and configuration management systems using file-based provisioning; and in Terraform using API-based provisioning.
|
||||
|
||||
{{% docs/reference %}}
|
||||
[external-alertmanagers]: "/docs/grafana/ -> /docs/grafana/<GRAFANA VERSION>/alerting/set-up/configure-alertmanager"
|
||||
[external-alertmanagers]: "/docs/grafana/ -> /docs/grafana/<GRAFANA_VERSION>/alerting/set-up/configure-alertmanager"
|
||||
[external-alertmanagers]: "/docs/grafana-cloud/ -> /docs/grafana-cloud/alerting-and-irm/alerting/set-up/configure-alertmanager"
|
||||
[notification-policies]: "/docs/grafana/ -> /docs/grafana/<GRAFANA VERSION>/alerting/fundamentals/notification-policies"
|
||||
[notification-policies]: "/docs/grafana/ -> /docs/grafana/<GRAFANA_VERSION>/alerting/fundamentals/notification-policies"
|
||||
[notification-policies]: "/docs/grafana-cloud/ -> /docs/grafana-cloud/alerting-and-irm/alerting/fundamentals/notification-policies"
|
||||
{{% /docs/reference %}}
|
||||
|
||||
@@ -20,7 +20,7 @@ An alert rule is a set of evaluation criteria for when an alert rule should fire
|
||||
|
||||
While queries and expressions select the data set to evaluate, a condition sets the threshold that an alert must meet or exceed to create an alert.
|
||||
|
||||
An interval specifies how frequently an alerting rule is evaluated. Duration, when configured, indicates how long a condition must be met. The alert rules can also define alerting behavior in the absence of data.
|
||||
An interval specifies how frequently an alert rule is evaluated. Duration, when configured, indicates how long a condition must be met. The alert rules can also define alerting behavior in the absence of data.
|
||||
|
||||
- [Alert rule types][alert-rule-types]
|
||||
- [Alert instances][alert-instances]
|
||||
@@ -28,15 +28,15 @@ An interval specifies how frequently an alerting rule is evaluated. Duration, wh
|
||||
- [Annotation and labels][annotation-label]
|
||||
|
||||
{{% docs/reference %}}
|
||||
[alert-instances]: "/docs/grafana/ -> /docs/grafana/<GRAFANA VERSION>/alerting/fundamentals/alert-rules/alert-instances"
|
||||
[alert-instances]: "/docs/grafana/ -> /docs/grafana/<GRAFANA_VERSION>/alerting/fundamentals/alert-rules/alert-instances"
|
||||
[alert-instances]: "/docs/grafana-cloud/ -> /docs/grafana-cloud/alerting-and-irm/alerting/fundamentals/alert-rules/alert-instances"
|
||||
|
||||
[alert-rule-types]: "/docs/grafana/ -> /docs/grafana/<GRAFANA VERSION>/alerting/fundamentals/alert-rules/alert-rule-types"
|
||||
[alert-rule-types]: "/docs/grafana/ -> /docs/grafana/<GRAFANA_VERSION>/alerting/fundamentals/alert-rules/alert-rule-types"
|
||||
[alert-rule-types]: "/docs/grafana-cloud/ -> /docs/grafana-cloud/alerting-and-irm/alerting/fundamentals/alert-rules/alert-rule-types"
|
||||
|
||||
[annotation-label]: "/docs/grafana/ -> /docs/grafana/<GRAFANA VERSION>/alerting/fundamentals/annotation-label"
|
||||
[annotation-label]: "/docs/grafana/ -> /docs/grafana/<GRAFANA_VERSION>/alerting/fundamentals/annotation-label"
|
||||
[annotation-label]: "/docs/grafana-cloud/ -> /docs/grafana-cloud/alerting-and-irm/alerting/fundamentals/annotation-label"
|
||||
|
||||
[organising-alerts]: "/docs/grafana/ -> /docs/grafana/<GRAFANA VERSION>/alerting/fundamentals/alert-rules/organising-alerts"
|
||||
[organising-alerts]: "/docs/grafana/ -> /docs/grafana/<GRAFANA_VERSION>/alerting/fundamentals/alert-rules/organising-alerts"
|
||||
[organising-alerts]: "/docs/grafana-cloud/ -> /docs/grafana-cloud/alerting-and-irm/alerting/fundamentals/alert-rules/organising-alerts"
|
||||
{{% /docs/reference %}}
|
||||
|
||||
@@ -128,10 +128,30 @@ When the queried data satisfies the defined condition, Grafana triggers the asso
|
||||
|
||||
By default, the last expression added is used as the alert condition.
|
||||
|
||||
## Recovery threshold
|
||||
|
||||
{{% admonition type="note" %}}
|
||||
The recovery threshold feature is currently only available in OSS.
|
||||
{{% /admonition %}}
|
||||
|
||||
To reduce the noise of flapping alerts, you can set a recovery threshold different to the alert threshold.
|
||||
|
||||
Flapping alerts occur when a metric hovers around the alert threshold condition and may lead to frequent state changes, resulting in too many notifications being generated.
|
||||
|
||||
Grafana-managed alert rules are evaluated for a specific interval of time. During each evaluation, the result of the query is checked against the threshold set in the alert rule. If the value of a metric is above the threshold, an alert rule fires and a notification is sent. When the value goes below the threshold and there is an active alert for this metric, the alert is resolved, and another notification is sent.
|
||||
|
||||
It can be tricky to create an alert rule for a noisy metric. That is, when the value of a metric continually goes above and below a threshold. This is called flapping and results in a series of firing - resolved - firing notifications and a noisy alert state history.
|
||||
|
||||
For example, if you have an alert for latency with a threshold of 1000ms and the number fluctuates around 1000 (say 980 ->1010 -> 990 -> 1020, and so on) then each of those will trigger a notification.
|
||||
|
||||
To solve this problem, you can set a (custom) recovery threshold, which basically means having two thresholds instead of one. An alert is triggered when the first threshold is crossed and is resolved only when the second threshold is crossed.
|
||||
|
||||
For example, you could set a threshold of 1000ms and a recovery threshold of 900ms. This way, an alert rule will only stop firing when it goes under 900ms and flapping is reduced.
|
||||
|
||||
{{% docs/reference %}}
|
||||
[data-source-alerting]: "/docs/grafana/ -> /docs/grafana/<GRAFANA VERSION>/alerting/fundamentals/data-source-alerting"
|
||||
[data-source-alerting]: "/docs/grafana/ -> /docs/grafana/<GRAFANA_VERSION>/alerting/fundamentals/data-source-alerting"
|
||||
[data-source-alerting]: "/docs/grafana-cloud/ -> /docs/grafana-cloud/alerting-and-irm/alerting/fundamentals/data-source-alerting"
|
||||
|
||||
[query-transform-data]: "/docs/grafana/ -> /docs/grafana/<GRAFANA VERSION>/panels-visualizations/query-transform-data"
|
||||
[query-transform-data]: "/docs/grafana-cloud/ -> /docs/grafana/<GRAFANA VERSION>/panels-visualizations/query-transform-data"
|
||||
[query-transform-data]: "/docs/grafana/ -> /docs/grafana/<GRAFANA_VERSION>/panels-visualizations/query-transform-data"
|
||||
[query-transform-data]: "/docs/grafana-cloud/ -> /docs/grafana/<GRAFANA_VERSION>/panels-visualizations/query-transform-data"
|
||||
{{% /docs/reference %}}
|
||||
|
||||
@@ -22,9 +22,11 @@ To do this, you need to make sure that your alert rule is in the right evaluatio
|
||||
|
||||
## Evaluation group
|
||||
|
||||
Every alert rule is part of an evaluation group. Each evaluation group contains an evaluation interval that determines how frequently the alert rule is checked. Alert rules within the same group are evaluated one after the other, while alert rules in different groups can be evaluated simultaneously.
|
||||
Every alert rule is part of an evaluation group. Each evaluation group contains an evaluation interval that determines how frequently the alert rule is checked.
|
||||
|
||||
This feature is especially useful for Prometheus/Mimir rules when you want to ensure that recording rules are evaluated before any alert rules.
|
||||
**Data-source managed** alert rules within the same group are evaluated one after the other, while alert rules in different groups can be evaluated simultaneously. This feature is especially useful when you want to ensure that recording rules are evaluated before any alert rules.
|
||||
|
||||
**Grafana-managed** alert rules are evaluated at the same time, regardless of alert rule group. The default evaluation interval is set at 10 seconds, which means that Grafana-managed alert rules are evaluated every 10 seconds to the closest 10-second window on the clock, for example, 10:00:00, 10:00:10, 10:00:20, and so on. You can also configure your own evaluation interval, if required.
|
||||
|
||||
**Note:**
|
||||
|
||||
|
||||
@@ -13,13 +13,13 @@ labels:
|
||||
- cloud
|
||||
- enterprise
|
||||
- oss
|
||||
title: State and health of alerting rules
|
||||
title: State and health of alert rules
|
||||
weight: 405
|
||||
---
|
||||
|
||||
# State and health of alerting rules
|
||||
# State and health of alert rules
|
||||
|
||||
The state and health of alerting rules help you understand several key status indicators about your alerts.
|
||||
The state and health of alert rules help you understand several key status indicators about your alerts.
|
||||
|
||||
There are three key components: [alert rule state](#alert-rule-state), [alert instance state](#alert-instance-state), and [alert rule health](#alert-rule-health). Although related, each component conveys subtly different information.
|
||||
|
||||
@@ -47,7 +47,7 @@ An alert instance can be in either of the following states:
|
||||
| **Pending** | The state of an alert that has been active for less than the configured threshold duration. |
|
||||
| **Alerting** | The state of an alert that has been active for longer than the configured threshold duration. |
|
||||
| **NoData** | No data has been received for the configured time window. |
|
||||
| **Error** | The error that occurred when attempting to evaluate an alerting rule. |
|
||||
| **Error** | The error that occurred when attempting to evaluate an alert rule. |
|
||||
|
||||
## Alert rule health
|
||||
|
||||
@@ -55,13 +55,13 @@ An alert rule can have one the following health statuses:
|
||||
|
||||
| State | Description |
|
||||
| ---------- | ---------------------------------------------------------------------------------- |
|
||||
| **Ok** | No error when evaluating an alerting rule. |
|
||||
| **Error** | An error occurred when evaluating an alerting rule. |
|
||||
| **Ok** | No error when evaluating an alert rule. |
|
||||
| **Error** | An error occurred when evaluating an alert rule. |
|
||||
| **NoData** | The absence of data in at least one time series returned during a rule evaluation. |
|
||||
|
||||
## Special alerts for `NoData` and `Error`
|
||||
|
||||
When evaluation of an alerting rule produces state `NoData` or `Error`, Grafana Alerting will generate alert instances that have the following additional labels:
|
||||
When evaluation of an alert rule produces state `NoData` or `Error`, Grafana Alerting will generate alert instances that have the following additional labels:
|
||||
|
||||
| Label | Description |
|
||||
| ------------------ | ---------------------------------------------------------------------- |
|
||||
|
||||
@@ -54,6 +54,6 @@ If you are provisioning your data source, set the flag `handleGrafanaManagedAler
|
||||
[Add an external Alertmanager][configure-alertmanager]
|
||||
|
||||
{{% docs/reference %}}
|
||||
[configure-alertmanager]: "/docs/grafana/ -> /docs/grafana/<GRAFANA VERSION>/alerting/set-up/configure-alertmanager"
|
||||
[configure-alertmanager]: "/docs/grafana/ -> /docs/grafana/<GRAFANA_VERSION>/alerting/set-up/configure-alertmanager"
|
||||
[configure-alertmanager]: "/docs/grafana-cloud/ -> /docs/grafana-cloud/alerting-and-irm/alerting/set-up/configure-alertmanager"
|
||||
{{% /docs/reference %}}
|
||||
|
||||
@@ -48,6 +48,6 @@ It is also important to make sure that the label set for an alert does not have
|
||||
Annotations are named pairs that add additional information to existing alerts. There are a number of suggested annotations in Grafana such as `description`, `summary`, `runbook_url`, `dashboardUId` and `panelId`. Like custom labels, annotations must have a name, and their value can contain a combination of text and template code that is evaluated when an alert is fired. If an annotation contains template code, the template is evaluated once when the alert is fired. It is not re-evaluated, even when the alert is resolved. Documentation on how to template annotations can be found [here][variables-label-annotation].
|
||||
|
||||
{{% docs/reference %}}
|
||||
[variables-label-annotation]: "/docs/grafana/ -> /docs/grafana/<GRAFANA VERSION>/alerting/fundamentals/annotation-label/variables-label-annotation"
|
||||
[variables-label-annotation]: "/docs/grafana/ -> /docs/grafana/<GRAFANA_VERSION>/alerting/fundamentals/annotation-label/variables-label-annotation"
|
||||
[variables-label-annotation]: "/docs/grafana-cloud/ -> /docs/grafana-cloud/alerting-and-irm/alerting/fundamentals/annotation-label/variables-label-annotation"
|
||||
{{% /docs/reference %}}
|
||||
|
||||
@@ -55,9 +55,9 @@ Grafana reserved labels can be used in the same way as manually configured label
|
||||
| grafana_folder | Title of the folder containing the alert. |
|
||||
|
||||
{{% docs/reference %}}
|
||||
[alerting-rules]: "/docs/grafana/ -> /docs/grafana/<GRAFANA VERSION>/alerting/alerting-rules"
|
||||
[alerting-rules]: "/docs/grafana/ -> /docs/grafana/<GRAFANA_VERSION>/alerting/alerting-rules"
|
||||
[alerting-rules]: "/docs/grafana-cloud/ -> /docs/grafana-cloud/alerting-and-irm/alerting/alerting-rules"
|
||||
|
||||
[unified-alerting-reserved-labels]: "/docs/grafana/ -> /docs/grafana/<GRAFANA VERSION>/setup-grafana/configure-grafana#unified_alertingreserved_labels"
|
||||
[unified-alerting-reserved-labels]: "/docs/grafana-cloud/ -> /docs/grafana/<GRAFANA VERSION>/setup-grafana/configure-grafana#unified_alertingreserved_labels"
|
||||
[unified-alerting-reserved-labels]: "/docs/grafana/ -> /docs/grafana/<GRAFANA_VERSION>/setup-grafana/configure-grafana#unified_alertingreserved_labels"
|
||||
[unified-alerting-reserved-labels]: "/docs/grafana-cloud/ -> /docs/grafana/<GRAFANA_VERSION>/setup-grafana/configure-grafana#unified_alertingreserved_labels"
|
||||
{{% /docs/reference %}}
|
||||
|
||||
@@ -445,6 +445,6 @@ example.com:8080
|
||||
```
|
||||
|
||||
{{% docs/reference %}}
|
||||
[explore]: "/docs/grafana/ -> /docs/grafana/<GRAFANA VERSION>/explore"
|
||||
[explore]: "/docs/grafana-cloud/ -> /docs/grafana/<GRAFANA VERSION>/explore"
|
||||
[explore]: "/docs/grafana/ -> /docs/grafana/<GRAFANA_VERSION>/explore"
|
||||
[explore]: "/docs/grafana-cloud/ -> /docs/grafana/<GRAFANA_VERSION>/explore"
|
||||
{{% /docs/reference %}}
|
||||
|
||||
@@ -42,54 +42,54 @@ These are the data sources that are compatible with and supported by Grafana Ale
|
||||
- [Grafana data sources][]
|
||||
|
||||
{{% docs/reference %}}
|
||||
[Grafana data sources]: "/docs/grafana/ -> /docs/grafana/<GRAFANA VERSION>/datasources"
|
||||
[Grafana data sources]: "/docs/grafana-cloud/ -> /docs/grafana/<GRAFANA VERSION>/datasources"
|
||||
[Grafana data sources]: "/docs/grafana/ -> /docs/grafana/<GRAFANA_VERSION>/datasources"
|
||||
[Grafana data sources]: "/docs/grafana-cloud/ -> /docs/grafana/<GRAFANA_VERSION>/datasources"
|
||||
|
||||
[AWS CloudWatch]: "/docs/grafana/ -> /docs/grafana/<GRAFANA VERSION>/datasources/aws-cloudwatch"
|
||||
[AWS CloudWatch]: "/docs/grafana-cloud/ -> /docs/grafana/<GRAFANA VERSION>/datasources/aws-cloudwatch"
|
||||
[AWS CloudWatch]: "/docs/grafana/ -> /docs/grafana/<GRAFANA_VERSION>/datasources/aws-cloudwatch"
|
||||
[AWS CloudWatch]: "/docs/grafana-cloud/ -> /docs/grafana/<GRAFANA_VERSION>/datasources/aws-cloudwatch"
|
||||
|
||||
[Azure Monitor]: "/docs/grafana/ -> /docs/grafana/<GRAFANA VERSION>/datasources/azure-monitor"
|
||||
[Azure Monitor]: "/docs/grafana-cloud/ -> /docs/grafana/<GRAFANA VERSION>/datasources/azure-monitor"
|
||||
[Azure Monitor]: "/docs/grafana/ -> /docs/grafana/<GRAFANA_VERSION>/datasources/azure-monitor"
|
||||
[Azure Monitor]: "/docs/grafana-cloud/ -> /docs/grafana/<GRAFANA_VERSION>/datasources/azure-monitor"
|
||||
|
||||
[Elasticsearch]: "/docs/grafana/ -> /docs/grafana/<GRAFANA VERSION>/datasources/elasticsearch"
|
||||
[Elasticsearch]: "/docs/grafana-cloud/ -> /docs/grafana/<GRAFANA VERSION>/datasources/elasticsearch"
|
||||
[Elasticsearch]: "/docs/grafana/ -> /docs/grafana/<GRAFANA_VERSION>/datasources/elasticsearch"
|
||||
[Elasticsearch]: "/docs/grafana-cloud/ -> /docs/grafana/<GRAFANA_VERSION>/datasources/elasticsearch"
|
||||
|
||||
[Google Cloud Monitoring]: "/docs/grafana/ -> /docs/grafana/<GRAFANA VERSION>/datasources/google-cloud-monitoring"
|
||||
[Google Cloud Monitoring]: "/docs/grafana-cloud/ -> /docs/grafana/<GRAFANA VERSION>/datasources/google-cloud-monitoring"
|
||||
[Google Cloud Monitoring]: "/docs/grafana/ -> /docs/grafana/<GRAFANA_VERSION>/datasources/google-cloud-monitoring"
|
||||
[Google Cloud Monitoring]: "/docs/grafana-cloud/ -> /docs/grafana/<GRAFANA_VERSION>/datasources/google-cloud-monitoring"
|
||||
|
||||
[Graphite]: "/docs/grafana/ -> /docs/grafana/<GRAFANA VERSION>/datasources/graphite"
|
||||
[Graphite]: "/docs/grafana-cloud/ -> /docs/grafana/<GRAFANA VERSION>/datasources/graphite"
|
||||
[Graphite]: "/docs/grafana/ -> /docs/grafana/<GRAFANA_VERSION>/datasources/graphite"
|
||||
[Graphite]: "/docs/grafana-cloud/ -> /docs/grafana/<GRAFANA_VERSION>/datasources/graphite"
|
||||
|
||||
[InfluxDB]: "/docs/grafana/ -> /docs/grafana/<GRAFANA VERSION>/datasources/influxdb"
|
||||
[InfluxDB]: "/docs/grafana-cloud/ -> /docs/grafana/<GRAFANA VERSION>/datasources/influxdb"
|
||||
[InfluxDB]: "/docs/grafana/ -> /docs/grafana/<GRAFANA_VERSION>/datasources/influxdb"
|
||||
[InfluxDB]: "/docs/grafana-cloud/ -> /docs/grafana/<GRAFANA_VERSION>/datasources/influxdb"
|
||||
|
||||
[Loki]: "/docs/grafana/ -> /docs/grafana/<GRAFANA VERSION>/datasources/loki"
|
||||
[Loki]: "/docs/grafana-cloud/ -> /docs/grafana/<GRAFANA VERSION>/datasources/loki"
|
||||
[Loki]: "/docs/grafana/ -> /docs/grafana/<GRAFANA_VERSION>/datasources/loki"
|
||||
[Loki]: "/docs/grafana-cloud/ -> /docs/grafana/<GRAFANA_VERSION>/datasources/loki"
|
||||
|
||||
[Microsoft SQL Server (MSSQL)]: "/docs/grafana/ -> /docs/grafana/<GRAFANA VERSION>/datasources/mssql"
|
||||
[Microsoft SQL Server (MSSQL)]: "/docs/grafana-cloud/ -> /docs/grafana/<GRAFANA VERSION>/datasources/mssql"
|
||||
[Microsoft SQL Server (MSSQL)]: "/docs/grafana/ -> /docs/grafana/<GRAFANA_VERSION>/datasources/mssql"
|
||||
[Microsoft SQL Server (MSSQL)]: "/docs/grafana-cloud/ -> /docs/grafana/<GRAFANA_VERSION>/datasources/mssql"
|
||||
|
||||
[MySQL]: "/docs/grafana/ -> /docs/grafana/<GRAFANA VERSION>/datasources/mysql"
|
||||
[MySQL]: "/docs/grafana-cloud/ -> /docs/grafana/<GRAFANA VERSION>/datasources/mysql"
|
||||
[MySQL]: "/docs/grafana/ -> /docs/grafana/<GRAFANA_VERSION>/datasources/mysql"
|
||||
[MySQL]: "/docs/grafana-cloud/ -> /docs/grafana/<GRAFANA_VERSION>/datasources/mysql"
|
||||
|
||||
[Open TSDB]: "/docs/grafana/ -> /docs/grafana/<GRAFANA VERSION>/datasources/opentsdb"
|
||||
[Open TSDB]: "/docs/grafana-cloud/ -> /docs/grafana/<GRAFANA VERSION>/datasources/opentsdb"
|
||||
[Open TSDB]: "/docs/grafana/ -> /docs/grafana/<GRAFANA_VERSION>/datasources/opentsdb"
|
||||
[Open TSDB]: "/docs/grafana-cloud/ -> /docs/grafana/<GRAFANA_VERSION>/datasources/opentsdb"
|
||||
|
||||
[PostgreSQL]: "/docs/grafana/ -> /docs/grafana/<GRAFANA VERSION>/datasources/postgres"
|
||||
[PostgreSQL]: "/docs/grafana-cloud/ -> /docs/grafana/<GRAFANA VERSION>/datasources/postgres"
|
||||
[PostgreSQL]: "/docs/grafana/ -> /docs/grafana/<GRAFANA_VERSION>/datasources/postgres"
|
||||
[PostgreSQL]: "/docs/grafana-cloud/ -> /docs/grafana/<GRAFANA_VERSION>/datasources/postgres"
|
||||
|
||||
[Prometheus]: "/docs/grafana/ -> /docs/grafana/<GRAFANA VERSION>/datasources/prometheus"
|
||||
[Prometheus]: "/docs/grafana-cloud/ -> /docs/grafana/<GRAFANA VERSION>/datasources/prometheus"
|
||||
[Prometheus]: "/docs/grafana/ -> /docs/grafana/<GRAFANA_VERSION>/datasources/prometheus"
|
||||
[Prometheus]: "/docs/grafana-cloud/ -> /docs/grafana/<GRAFANA_VERSION>/datasources/prometheus"
|
||||
|
||||
[Jaeger]: "/docs/grafana/ -> /docs/grafana/<GRAFANA VERSION>/datasources/jaeger"
|
||||
[Jaeger]: "/docs/grafana-cloud/ -> /docs/grafana/<GRAFANA VERSION>/datasources/jaeger"
|
||||
[Jaeger]: "/docs/grafana/ -> /docs/grafana/<GRAFANA_VERSION>/datasources/jaeger"
|
||||
[Jaeger]: "/docs/grafana-cloud/ -> /docs/grafana/<GRAFANA_VERSION>/datasources/jaeger"
|
||||
|
||||
[Zipkin]: "/docs/grafana/ -> /docs/grafana/<GRAFANA VERSION>/datasources/zipkin"
|
||||
[Zipkin]: "/docs/grafana-cloud/ -> /docs/grafana/<GRAFANA VERSION>/datasources/zipkin"
|
||||
[Zipkin]: "/docs/grafana/ -> /docs/grafana/<GRAFANA_VERSION>/datasources/zipkin"
|
||||
[Zipkin]: "/docs/grafana-cloud/ -> /docs/grafana/<GRAFANA_VERSION>/datasources/zipkin"
|
||||
|
||||
[Tempo]: "/docs/grafana/ -> /docs/grafana/<GRAFANA VERSION>/datasources/tempo"
|
||||
[Tempo]: "/docs/grafana-cloud/ -> /docs/grafana/<GRAFANA VERSION>/datasources/tempo"
|
||||
[Tempo]: "/docs/grafana/ -> /docs/grafana/<GRAFANA_VERSION>/datasources/tempo"
|
||||
[Tempo]: "/docs/grafana-cloud/ -> /docs/grafana/<GRAFANA_VERSION>/datasources/tempo"
|
||||
|
||||
[Testdata]: "/docs/grafana/ -> /docs/grafana/<GRAFANA VERSION>/datasources/testdata"
|
||||
[Testdata]: "/docs/grafana-cloud/ -> /docs/grafana/<GRAFANA VERSION>/datasources/testdata"
|
||||
[Testdata]: "/docs/grafana/ -> /docs/grafana/<GRAFANA_VERSION>/datasources/testdata"
|
||||
[Testdata]: "/docs/grafana-cloud/ -> /docs/grafana/<GRAFANA_VERSION>/datasources/testdata"
|
||||
{{% /docs/reference %}}
|
||||
|
||||
@@ -109,6 +109,6 @@ When this query is used as the **condition** in an alert rule, then the non-zero
|
||||
|
||||
{{% docs/reference %}}
|
||||
|
||||
[set-up-grafana-monitoring]: "/docs/grafana/ -> /docs/grafana/<GRAFANA VERSION>/setup-grafana/set-up-grafana-monitoring"
|
||||
[set-up-grafana-monitoring]: "/docs/grafana-cloud/ -> /docs/grafana/<GRAFANA VERSION>/setup-grafana/set-up-grafana-monitoring"
|
||||
[set-up-grafana-monitoring]: "/docs/grafana/ -> /docs/grafana/<GRAFANA_VERSION>/setup-grafana/set-up-grafana-monitoring"
|
||||
[set-up-grafana-monitoring]: "/docs/grafana-cloud/ -> /docs/grafana/<GRAFANA_VERSION>/setup-grafana/set-up-grafana-monitoring"
|
||||
{{% /docs/reference %}}
|
||||
|
||||
@@ -38,6 +38,6 @@ It is important to make sure that gossiping is configured and tested. You can fi
|
||||
[Configure alerting high availability][configure-high-availability]
|
||||
|
||||
{{% docs/reference %}}
|
||||
[configure-high-availability]: "/docs/grafana/ -> /docs/grafana/<GRAFANA VERSION>/alerting/set-up/configure-high-availability"
|
||||
[configure-high-availability]: "/docs/grafana/ -> /docs/grafana/<GRAFANA_VERSION>/alerting/set-up/configure-high-availability"
|
||||
[configure-high-availability]: "/docs/grafana-cloud/ -> /docs/grafana-cloud/alerting-and-irm/alerting/set-up/configure-high-availability"
|
||||
{{% /docs/reference %}}
|
||||
|
||||
@@ -132,6 +132,6 @@ Repeat interval decides how often notifications are repeated if the group has no
|
||||
**Default** 4 hours
|
||||
|
||||
{{% docs/reference %}}
|
||||
[labels-and-label-matchers]: "/docs/grafana/ -> /docs/grafana/<GRAFANA VERSION>/alerting/fundamentals/annotation-label/labels-and-label-matchers"
|
||||
[labels-and-label-matchers]: "/docs/grafana/ -> /docs/grafana/<GRAFANA_VERSION>/alerting/fundamentals/annotation-label/labels-and-label-matchers"
|
||||
[labels-and-label-matchers]: "/docs/grafana-cloud/ -> /docs/grafana-cloud/alerting-and-irm/alerting/fundamentals/annotation-label/labels-and-label-matchers"
|
||||
{{% /docs/reference %}}
|
||||
|
||||
@@ -30,18 +30,18 @@ Once you have set up your alert rules, contact points, and notification policies
|
||||
[View and filter alert rules][view-alert-rules]
|
||||
|
||||
{{% docs/reference %}}
|
||||
[create-silence]: "/docs/grafana/ -> /docs/grafana/<GRAFANA VERSION>/alerting/manage-notifications/create-silence"
|
||||
[create-silence]: "/docs/grafana/ -> /docs/grafana/<GRAFANA_VERSION>/alerting/manage-notifications/create-silence"
|
||||
[create-silence]: "/docs/grafana-cloud/ -> /docs/grafana-cloud/alerting-and-irm/alerting/manage-notifications/create-silence"
|
||||
|
||||
[declare-incident-from-firing-alert]: "/docs/grafana/ -> /docs/grafana/<GRAFANA VERSION>/alerting/manage-notifications/declare-incident-from-alert"
|
||||
[declare-incident-from-firing-alert]: "/docs/grafana/ -> /docs/grafana/<GRAFANA_VERSION>/alerting/manage-notifications/declare-incident-from-alert"
|
||||
[declare-incident-from-firing-alert]: "/docs/grafana-cloud/ -> /docs/grafana-cloud/alerting-and-irm/alerting/manage-notifications/declare-incident-from-alert"
|
||||
|
||||
[mute-timings]: "/docs/grafana/ -> /docs/grafana/<GRAFANA VERSION>/alerting/manage-notifications/mute-timings"
|
||||
[mute-timings]: "/docs/grafana/ -> /docs/grafana/<GRAFANA_VERSION>/alerting/manage-notifications/mute-timings"
|
||||
[mute-timings]: "/docs/grafana-cloud/ -> /docs/grafana-cloud/alerting-and-irm/alerting/manage-notifications/mute-timings"
|
||||
|
||||
[view-alert-rules]: "/docs/grafana/ -> /docs/grafana/<GRAFANA VERSION>/alerting/manage-notifications/view-alert-rules"
|
||||
[view-alert-rules]: "/docs/grafana/ -> /docs/grafana/<GRAFANA_VERSION>/alerting/manage-notifications/view-alert-rules"
|
||||
[view-alert-rules]: "/docs/grafana-cloud/ -> /docs/grafana-cloud/alerting-and-irm/alerting/manage-notifications/view-alert-rules"
|
||||
|
||||
[view-state-health]: "/docs/grafana/ -> /docs/grafana/<GRAFANA VERSION>/alerting/manage-notifications/view-state-health"
|
||||
[view-state-health]: "/docs/grafana/ -> /docs/grafana/<GRAFANA_VERSION>/alerting/manage-notifications/view-state-health"
|
||||
[view-state-health]: "/docs/grafana-cloud/ -> /docs/grafana-cloud/alerting-and-irm/alerting/manage-notifications/view-state-health"
|
||||
{{% /docs/reference %}}
|
||||
|
||||
@@ -26,7 +26,11 @@ weight: 410
|
||||
|
||||
Silences stop notifications from getting created and last for only a specified window of time.
|
||||
|
||||
**Note that inhibition rules are not supported in the Grafana Alertmanager.**
|
||||
{{< admonition type="note" >}}
|
||||
|
||||
- Inhibition rules are not supported in the Grafana Alertmanager.
|
||||
- The preview of silenced alerts only applies to alerts in firing state.
|
||||
{{< /admonition >}}
|
||||
|
||||
## Add silences
|
||||
|
||||
@@ -38,7 +42,7 @@ To add a silence, complete the following steps.
|
||||
1. Click **Create silence** to open the Create silence page.
|
||||
1. In **Silence start and end**, select the start and end date to indicate when the silence should go into effect and expire.
|
||||
1. Optionally, in **Duration**, specify how long the silence is enforced. This automatically updates the end time in the **Silence start and end** field.
|
||||
1. In the **Label** and **Value** fields, enter one or more _Matching Labels_. Matchers determine which rules the silence will apply to.
|
||||
1. In the **Label** and **Value** fields, enter one or more _Matching Labels_. Matchers determine which rules the silence will apply to. Any matching alerts (in firing state) will show in the **Affected alert instances** field
|
||||
1. In **Comment**, add details about the silence.
|
||||
1. Click **Submit**.
|
||||
|
||||
|
||||
@@ -139,9 +139,9 @@ For example, if a screenshot could not be taken within the expected time (10 sec
|
||||
- `grafana_screenshot_upload_successes_total`
|
||||
|
||||
{{% docs/reference %}}
|
||||
[image-rendering]: "/docs/grafana/ -> /docs/grafana/<GRAFANA VERSION>/setup-grafana/image-rendering"
|
||||
[image-rendering]: "/docs/grafana-cloud/ -> /docs/grafana/<GRAFANA VERSION>/setup-grafana/image-rendering"
|
||||
[image-rendering]: "/docs/grafana/ -> /docs/grafana/<GRAFANA_VERSION>/setup-grafana/image-rendering"
|
||||
[image-rendering]: "/docs/grafana-cloud/ -> /docs/grafana/<GRAFANA_VERSION>/setup-grafana/image-rendering"
|
||||
|
||||
[paths]: "/docs/grafana/ -> /docs/grafana/<GRAFANA VERSION>/setup-grafana/configure-grafana#paths"
|
||||
[paths]: "/docs/grafana-cloud/ -> /docs/grafana/<GRAFANA VERSION>/setup-grafana/configure-grafana#paths"
|
||||
[paths]: "/docs/grafana/ -> /docs/grafana/<GRAFANA_VERSION>/setup-grafana/configure-grafana#paths"
|
||||
[paths]: "/docs/grafana-cloud/ -> /docs/grafana/<GRAFANA_VERSION>/setup-grafana/configure-grafana#paths"
|
||||
{{% /docs/reference %}}
|
||||
|
||||
@@ -81,9 +81,9 @@ If you want to specify an exact duration, specify all the options. For example,
|
||||
- Days of the month: `1:7`
|
||||
|
||||
{{% docs/reference %}}
|
||||
[datasources/alertmanager]: "/docs/grafana/ -> /docs/grafana/<GRAFANA VERSION>/datasources/alertmanager"
|
||||
[datasources/alertmanager]: "/docs/grafana-cloud/ -> /docs/grafana/<GRAFANA VERSION>/datasources/alertmanager"
|
||||
[datasources/alertmanager]: "/docs/grafana/ -> /docs/grafana/<GRAFANA_VERSION>/datasources/alertmanager"
|
||||
[datasources/alertmanager]: "/docs/grafana-cloud/ -> /docs/grafana/<GRAFANA_VERSION>/datasources/alertmanager"
|
||||
|
||||
[fundamentals/alertmanager]: "/docs/grafana/ -> /docs/grafana/<GRAFANA VERSION>/alerting/fundamentals/alertmanager"
|
||||
[fundamentals/alertmanager]: "/docs/grafana/ -> /docs/grafana/<GRAFANA_VERSION>/alerting/fundamentals/alertmanager"
|
||||
[fundamentals/alertmanager]: "/docs/grafana-cloud/ -> /docs/grafana-cloud/alerting-and-irm/alerting/fundamentals/alertmanager"
|
||||
{{% /docs/reference %}}
|
||||
|
||||
@@ -52,12 +52,12 @@ Use notification templates to send notifications to your contact points.
|
||||
Data that is available when writing templates.
|
||||
|
||||
{{% docs/reference %}}
|
||||
[reference]: "/docs/grafana/ -> /docs/grafana/<GRAFANA VERSION>/alerting/manage-notifications/template-notifications/reference"
|
||||
[reference]: "/docs/grafana/ -> /docs/grafana/<GRAFANA_VERSION>/alerting/manage-notifications/template-notifications/reference"
|
||||
[reference]: "/docs/grafana-cloud/ -> /docs/grafana-cloud/alerting-and-irm/alerting/manage-notifications/template-notifications/reference"
|
||||
|
||||
[use-notification-templates]: "/docs/grafana/ -> /docs/grafana/<GRAFANA VERSION>/alerting/manage-notifications/template-notifications/use-notification-templates"
|
||||
[use-notification-templates]: "/docs/grafana/ -> /docs/grafana/<GRAFANA_VERSION>/alerting/manage-notifications/template-notifications/use-notification-templates"
|
||||
[use-notification-templates]: "/docs/grafana-cloud/ -> /docs/grafana-cloud/alerting-and-irm/alerting/manage-notifications/template-notifications/use-notification-templates"
|
||||
|
||||
[using-go-templating-language]: "/docs/grafana/ -> /docs/grafana/<GRAFANA VERSION>/alerting/manage-notifications/template-notifications/using-go-templating-language"
|
||||
[using-go-templating-language]: "/docs/grafana/ -> /docs/grafana/<GRAFANA_VERSION>/alerting/manage-notifications/template-notifications/using-go-templating-language"
|
||||
[using-go-templating-language]: "/docs/grafana-cloud/ -> /docs/grafana-cloud/alerting-and-irm/alerting/manage-notifications/template-notifications/using-go-templating-language"
|
||||
{{% /docs/reference %}}
|
||||
|
||||
@@ -26,18 +26,18 @@ In the Contact points tab, you can see a list of your contact points.
|
||||
|
||||
**Note:** You can edit an existing contact by clicking the Edit icon.
|
||||
|
||||
2. Execute a template from one or more fields such as Message and Subject:
|
||||
1. Execute a template from one or more fields such as Message and Subject:
|
||||
|
||||
{{< figure max-width="940px" src="/static/img/docs/alerting/unified/use-notification-template-9-4.png" caption="Use notification template" >}}
|
||||
|
||||
For more information on how to write and execute templates, refer to [Using Go's templating language][using-go-templating-language] and [Create notification templates][create-notification-templates].
|
||||
|
||||
3. Click Save template.
|
||||
1. Click **Save contact point**.
|
||||
|
||||
{{% docs/reference %}}
|
||||
[create-notification-templates]: "/docs/grafana/ -> /docs/grafana/<GRAFANA VERSION>/alerting/manage-notifications/template-notifications/create-notification-templates"
|
||||
[create-notification-templates]: "/docs/grafana/ -> /docs/grafana/<GRAFANA_VERSION>/alerting/manage-notifications/template-notifications/create-notification-templates"
|
||||
[create-notification-templates]: "/docs/grafana-cloud/ -> /docs/grafana-cloud/alerting-and-irm/alerting/manage-notifications/template-notifications/create-notification-templates"
|
||||
|
||||
[using-go-templating-language]: "/docs/grafana/ -> /docs/grafana/<GRAFANA VERSION>/alerting/manage-notifications/template-notifications/using-go-templating-language"
|
||||
[using-go-templating-language]: "/docs/grafana/ -> /docs/grafana/<GRAFANA_VERSION>/alerting/manage-notifications/template-notifications/using-go-templating-language"
|
||||
[using-go-templating-language]: "/docs/grafana-cloud/ -> /docs/grafana-cloud/alerting-and-irm/alerting/manage-notifications/template-notifications/using-go-templating-language"
|
||||
{{% /docs/reference %}}
|
||||
|
||||
@@ -280,12 +280,12 @@ grafana_folder = "Test alerts"
|
||||
```
|
||||
|
||||
{{% docs/reference %}}
|
||||
[create-notification-templates]: "/docs/grafana/ -> /docs/grafana/<GRAFANA VERSION>/alerting/manage-notifications/template-notifications/create-notification-templates"
|
||||
[create-notification-templates]: "/docs/grafana/ -> /docs/grafana/<GRAFANA_VERSION>/alerting/manage-notifications/template-notifications/create-notification-templates"
|
||||
[create-notification-templates]: "/docs/grafana-cloud/ -> /docs/grafana-cloud/alerting-and-irm/alerting/manage-notifications/template-notifications/create-notification-templates"
|
||||
|
||||
[extendeddata]: "/docs/grafana/ -> /docs/grafana/<GRAFANA VERSION>/alerting/manage-notifications/template-notifications/reference#extendeddata"
|
||||
[extendeddata]: "/docs/grafana/ -> /docs/grafana/<GRAFANA_VERSION>/alerting/manage-notifications/template-notifications/reference#extendeddata"
|
||||
[extendeddata]: "/docs/grafana-cloud/ -> /docs/grafana-cloud/alerting-and-irm/alerting/manage-notifications/template-notifications/reference#extendeddata"
|
||||
|
||||
[reference]: "/docs/grafana/ -> /docs/grafana/<GRAFANA VERSION>/alerting/manage-notifications/template-notifications/reference"
|
||||
[reference]: "/docs/grafana/ -> /docs/grafana/<GRAFANA_VERSION>/alerting/manage-notifications/template-notifications/reference"
|
||||
[reference]: "/docs/grafana-cloud/ -> /docs/grafana-cloud/alerting-and-irm/alerting/manage-notifications/template-notifications/reference"
|
||||
{{% /docs/reference %}}
|
||||
|
||||
@@ -54,27 +54,24 @@ Grafana Alerting supports many additional configuration options, from configurin
|
||||
|
||||
The following topics provide you with advanced configuration options for Grafana Alerting.
|
||||
|
||||
- [Provision alert rules using file provisioning][file-provisioning]
|
||||
- [Provision alert rules using file provisioning](/docs/grafana/<GRAFANA_VERSION>/alerting/set-up/provision-alerting-resources/file-provisioning)
|
||||
- [Provision alert rules using Terraform][terraform-provisioning]
|
||||
- [Add an external Alertmanager][configure-alertmanager]
|
||||
- [Configure high availability][configure-high-availability]
|
||||
|
||||
{{% docs/reference %}}
|
||||
[configure-alertmanager]: "/docs/grafana/ -> /docs/grafana/<GRAFANA VERSION>/alerting/set-up/configure-alertmanager"
|
||||
[configure-alertmanager]: "/docs/grafana/ -> /docs/grafana/<GRAFANA_VERSION>/alerting/set-up/configure-alertmanager"
|
||||
[configure-alertmanager]: "/docs/grafana-cloud/ -> /docs/grafana-cloud/alerting-and-irm/alerting/set-up/configure-alertmanager"
|
||||
|
||||
[configure-high-availability]: "/docs/grafana/ -> /docs/grafana/<GRAFANA VERSION>/alerting/set-up/configure-high-availability"
|
||||
[configure-high-availability]: "/docs/grafana/ -> /docs/grafana/<GRAFANA_VERSION>/alerting/set-up/configure-high-availability"
|
||||
[configure-high-availability]: "/docs/grafana-cloud/ -> /docs/grafana-cloud/alerting-and-irm/alerting/set-up/configure-high-availability"
|
||||
|
||||
[data-source-alerting]: "/docs/grafana/ -> /docs/grafana/<GRAFANA VERSION>/alerting/fundamentals/data-source-alerting"
|
||||
[data-source-alerting]: "/docs/grafana/ -> /docs/grafana/<GRAFANA_VERSION>/alerting/fundamentals/data-source-alerting"
|
||||
[data-source-alerting]: "/docs/grafana-cloud/ -> /docs/grafana-cloud/alerting-and-irm/alerting/fundamentals/data-source-alerting"
|
||||
|
||||
[data-source-management]: "/docs/grafana/ -> /docs/grafana/<GRAFANA VERSION>/administration/data-source-management"
|
||||
[data-source-management]: "/docs/grafana-cloud/ -> /docs/grafana/<GRAFANA VERSION>/administration/data-source-management"
|
||||
[data-source-management]: "/docs/grafana/ -> /docs/grafana/<GRAFANA_VERSION>/administration/data-source-management"
|
||||
[data-source-management]: "/docs/grafana-cloud/ -> /docs/grafana/<GRAFANA_VERSION>/administration/data-source-management"
|
||||
|
||||
[file-provisioning]: "/docs/grafana/ -> /docs/grafana/<GRAFANA VERSION>/alerting/set-up/provision-alerting-resources/file-provisioning"
|
||||
[file-provisioning]: "/docs/grafana-cloud/ -> /docs/grafana-cloud/alerting-and-irm/alerting/set-up/provision-alerting-resources/file-provisioning"
|
||||
|
||||
[terraform-provisioning]: "/docs/grafana/ -> /docs/grafana/<GRAFANA VERSION>/alerting/set-up/provision-alerting-resources/terraform-provisioning"
|
||||
[terraform-provisioning]: "/docs/grafana/ -> /docs/grafana/<GRAFANA_VERSION>/alerting/set-up/provision-alerting-resources/terraform-provisioning"
|
||||
[terraform-provisioning]: "/docs/grafana-cloud/ -> /docs/grafana-cloud/alerting-and-irm/alerting/set-up/provision-alerting-resources/terraform-provisioning"
|
||||
{{% /docs/reference %}}
|
||||
|
||||
@@ -1,6 +1,6 @@
|
||||
---
|
||||
aliases:
|
||||
- ../migrating-alerts/ # /docs/grafana/<GRAFANA VERSION>/alerting/migrating-alerts/
|
||||
- ../migrating-alerts/ # /docs/grafana/<GRAFANA_VERSION>/alerting/migrating-alerts/
|
||||
canonical: https://grafana.com/docs/grafana/latest/alerting/set-up/migrating-alerts/
|
||||
description: Upgrade to Grafana Alerting
|
||||
labels:
|
||||
@@ -13,44 +13,141 @@ weight: 150
|
||||
|
||||
# Upgrade Alerting
|
||||
|
||||
Grafana Alerting is enabled by default for new installations or existing installations whether or not legacy alerting is configured.
|
||||
|
||||
{{% admonition type="note" %}}
|
||||
When upgrading, your dashboard alerts are migrated to a new format. This migration can be rolled back easily by opting out. If you have any questions regarding this migration, please contact us.
|
||||
Legacy alerting will be removed in Grafana v11.0.0. We recommend that you upgrade to Grafana Alerting as soon as possible.
|
||||
For more information, refer to [Legacy alerting deprecation]({{< relref "./legacy-alerting-deprecation" >}}).
|
||||
{{% /admonition %}}
|
||||
|
||||
Existing installations that do not use legacy alerting will have Grafana Alerting enabled by default unless alerting is disabled in the configuration.
|
||||
Grafana provides two methods for a seamless automatic upgrade of legacy alert rules and notification channels to Grafana Alerting:
|
||||
|
||||
Likewise, existing installations that use legacy alerting will be automatically upgraded to Grafana Alerting unless you have opted out of Grafana Alerting before migration takes place. During the upgrade, legacy alerts are migrated to the new alerts type and no alerts or alerting data are lost.
|
||||
|
||||
Once the upgrade has taken place, you still have the option to roll back to legacy alerting. However, we do not recommend choosing this option. If you do choose to roll back, Grafana will restore your alerts to the alerts you had at the point in time when the upgrade took place.
|
||||
1. **Upgrade with Preview** (Recommended): Offers a safe and controlled preview environment where you can review and adjust your upgraded alerts before fully enabling Grafana Alerting.
|
||||
2. **Simple Upgrade**: One-step upgrade method for specific needs where a preview environment is not essential.
|
||||
|
||||
{{% admonition type="note" %}}
|
||||
Cloud customers, who do not want to upgrade to Grafana Alerting, should contact customer support.
|
||||
When upgrading with either method, your legacy dashboard alerts and notification channels are copied to a new format. This is non-destructive and can be [rolled back easily]({{< relref "#rolling-back-to-legacy-alerting" >}}).
|
||||
{{% /admonition %}}
|
||||
|
||||
If you have opted out or rolled back, you can always choose to opt in to Grafana Alerting at a later point in time.
|
||||
## Key Considerations
|
||||
|
||||
The following table provides details on the upgrade for Cloud, Enterprise, and OSS installations and the new Grafana Alerting UI.
|
||||
| Feature | Upgrade with Preview | Simple Upgrade |
|
||||
| --------------------------- | ----------------------------------------------------------------------------------- | ---------------------------------------------------- |
|
||||
| **Safety and Control** | ☑️ Preview environment for review and adjustment | ❌ No preview, potential for unexpected issues |
|
||||
| **User Experience** | ☑️ Seamless transition by handling issues early | ❌ Possible disruption during upgrade |
|
||||
| **Granular Control** | ☑️ Re-upgrade specific resources after resolving errors | ❌ All or nothing upgrade, manual error correction |
|
||||
| **Stakeholder Involvement** | ☑️ Collaboration and review of adjusted alerts | ❌ Review only available after upgrade |
|
||||
| **Provisioning Support** | ☑️ Configure new as-code before upgrading, simultaneous provisioning | ❌ No built-in provisioning support |
|
||||
| **Simplicity** | ❌ May take longer to complete | ☑️ Fast, one-step process |
|
||||
| **Technical Requirements** | Feature flag enabled, Grafana v10.3.0+ | Grafana v9.0.0+ |
|
||||
| **Suited for:** | ☑️ Complex setups, risk-averse environments, collaborative teams, heavy as-code use | ☑️ Simple setups, testing environments, large fleets |
|
||||
|
||||
| Grafana instance upgraded to 9.0 | |
|
||||
| -------------------------------- | ------------------------------------------------------------------------------------------------------------------------------------------------------------------------------------------------------------------------------------------------------------------------------------------------------------------------------------------------------------------------------------------------------------------------------------------------------------------------------------------------------------------------------------------------------------------------------------------------------------------------------------------------------------------------------------------------------------------------------------------------------------------------------------ |
|
||||
| Cloud | Existing Cloud installations with legacy dashboard alerting will have two alerting icons in the left navigation panel - the old alerting plugin icon and the new Grafana Alerting icon. During upgrade, existing alerts from the Cloud alerting plugin are migrated to Grafana Alerting. Once migration is complete, you can access and manage the older alerts from the new alerting Grafana Alerting icon in the navigation panel. The (older) Cloud alerting plugin is uninstalled from your cloud instance. Contact customer support if you **do not wish** to migrate to Grafana Alerting for your Cloud stack. If you choose to use legacy alerting, use the You will see the new Grafana Alerting icon as well as the old Cloud alerting plugin in the left navigation panel. |
|
||||
| Enterprise | Existing Enterprise instances using legacy alerting will have both the old (marked as legacy) and the new alerting icons in the navigation panel. During upgrade, existing legacy alerts are migrated to Grafana Alerting. If you wish, you can opt out of Grafana Alerting and roll back to legacy alerting. In that case, you can manage your legacy alerts from the alerting icon marked as legacy. |
|
||||
| OSS | Existing OSS installations with legacy dashboard alerting will have two alerting icons in the left navigation panel - the old alerting icon (marked as legacy) and the new Grafana Alerting icon. During upgrade, existing legacy alerts are migrated to Grafana Alerting. If you wish, you can opt out of Grafana Alerting and roll back to legacy alerting. In that case, you can manage your legacy alerts from the alerting icon marked as legacy. |
|
||||
## Upgrade with Preview (Recommended)
|
||||
|
||||
> **Note:** Starting with v9.0, legacy alerting is deprecated and will be removed in a future release.
|
||||
### Prerequisites
|
||||
|
||||
## Opt out
|
||||
- Grafana `v10.3.0 or later`.
|
||||
- Grafana administrator access.
|
||||
- Enable `alertingPreviewUpgrade` [feature toggle]({{< relref "../../../setup-grafana/configure-grafana/feature-toggles" >}}).
|
||||
|
||||
You can opt out of Grafana Alerting at any time and switch to using legacy alerting. Alternatively, you can opt out of using alerting in its entirety.
|
||||
### Suited for
|
||||
|
||||
## Stay on legacy alerting
|
||||
- **Complex setups**: Large deployments with intricate alert rules and notification channels.
|
||||
- **Risk-averse environments**: Situations where minimizing disruption and ensuring a smooth transition are critical.
|
||||
- **Collaborative teams**: Projects where feedback and review from stakeholders are valuable.
|
||||
- **Heavy as-code use**: Deployments with large or complex as-code configurations.
|
||||
|
||||
When upgrading to Grafana > 9.0, existing installations that use legacy alerting are automatically upgraded to Grafana Alerting unless you have opted-out of Grafana Alerting before migration takes place. During the upgrade, legacy alerts are migrated to the new alerts type and no alerts or alerting data are lost. To keep using legacy alerting and deactivate Grafana Alerting:
|
||||
### Overview
|
||||
|
||||
1. Go to your custom configuration file ($WORKING_DIR/conf/custom.ini).
|
||||
2. Enter the following in your configuration:
|
||||
In **Alerts & IRM**, the **Alerting** section provides a preview of Grafana Alerting where you can review and modify your upgraded alerts before finalizing the upgrade.
|
||||
|
||||
In the **Alerting (legacy) -> Alerting upgrade** section, you can initiate the process to automatically upgrade your existing alert rules and notification channels, and view a summary of the upgrade to Grafana Alerting.
|
||||
|
||||
Finalize your upgrade by restarting Grafana with the `[unified_alerting]` section enabled in your configuration.
|
||||
|
||||
{{% admonition type="note" %}}
|
||||
Alerts generated by the new alerting system are visible in the **Alerting** section of the navigation panel but are not active until the upgrade is finalized.
|
||||
{{% /admonition %}}
|
||||
|
||||
### To upgrade with preview, complete the following steps.
|
||||
|
||||
1. **Preview the Upgrade**:
|
||||
- **Initiate the process**: Access the upgrade functionality within Grafana by visiting the **Alerting upgrade** page in the **Alerting (legacy)** section of the navigation panel. From this page you can upgrade your existing alert rules and notification channels to the new Grafana Alerting system.
|
||||
- **Review the summary table:** Review the detailed table outlining how your existing alert rules and notification channels were upgraded to resources in the new Grafana Alerting system.
|
||||
1. **Investigate and Resolve Errors**:
|
||||
- **Identify errors**: Carefully examine the previewed upgrade:
|
||||
- Any alert rules or notification channels that couldn't be automatically upgraded will be highlighted with error indicators.
|
||||
- New or removed alert rules and notification channels will be highlighted with warning indicators.
|
||||
- **Address errors**: You have two options to resolve these issues:
|
||||
- **Fix legacy issues**: If possible, address the problems within your legacy alerting setup and attempt to upgrade the specific resource again.
|
||||
- **Create new resources**: If fixing legacy issues isn't viable, create new alert rules, notification policies, or contact points manually within the new Grafana Alerting system to replace the problematic ones.
|
||||
1. **Update As-Code Setup** (Optional):
|
||||
- **Export upgraded resources**: If you use provisioning methods to manage alert rules and notification channels, you can export the upgraded versions to generate provisioning files compatible with Grafana Alerting.
|
||||
- **Test new provisioning definitions**: Ensure your as-code setup aligns with the new system before completing the upgrade process. Both legacy and Grafana Alerting alerts can be provisioned simultaneously to facilitate a smooth transition.
|
||||
1. **Finalize the Upgrade**:
|
||||
- **Contact your Grafana server administrator**: Once you're confident in the state of your previewed upgrade, request to [enable Grafana Alerting]({{< relref "#enable-grafana-alerting" >}}).
|
||||
- **Continued use for upgraded organizations**: Organizations that have already completed the preview upgrade will seamlessly continue using their configured setup.
|
||||
- **Automatic upgrade for others**: Organizations that haven't initiated the upgrade with preview process will undergo the traditional automatic upgrade during this restart.
|
||||
- **Address issues before restart**: Exercise caution, as Grafana will not start if any traditional automatic upgrades encounter errors. Ensure all potential issues are resolved before initiating this step.
|
||||
|
||||
## Simple Upgrade
|
||||
|
||||
### Prerequisites
|
||||
|
||||
- Grafana `v9.0.0 or later` (more recent versions are recommended).
|
||||
|
||||
### Suited for
|
||||
|
||||
- **Simple setups**: Limited number of alerts and channels with minimal complexity.
|
||||
- **Testing environments**: Where a quick upgrade without a preview is sufficient.
|
||||
- **Large fleets**: Where manually reviewing each instance is not feasible.
|
||||
|
||||
### Overview
|
||||
|
||||
While we recommend the **Upgrade with Preview** method for its enhanced safety and control, the **Simple Upgrade Method** exists for specific situations where a preview environment is not essential. For example, if you have a large fleet of Grafana instances and want to upgrade them all without the need to review and adjust each one individually.
|
||||
|
||||
Configure your Grafana instance to enable Grafana Alerting and disable legacy alerting. Then restart Grafana to automatically upgrade your existing alert rules and notification channels to the new Grafana Alerting system.
|
||||
|
||||
Once Grafana Alerting is enabled, you can review and adjust your upgraded alerts in the **Alerting** section of the navigation panel as well as export them for as-code setup.
|
||||
|
||||
### To perform the simple upgrade, complete the following steps.
|
||||
|
||||
{{% admonition type="note" %}}
|
||||
Any errors encountered during the upgrade process will fail the upgrade and prevent Grafana from starting. If this occurs, you can [roll back to legacy alerting]({{< relref "#rolling-back-to-legacy-alerting" >}}).
|
||||
{{% /admonition %}}
|
||||
|
||||
1. **Upgrade to Grafana Alerting**:
|
||||
- **Enable Grafana Alerting**: [Modify custom configuration file]({{< relref "#enable-grafana-alerting" >}}).
|
||||
- **Restart Grafana**: Restart Grafana for the configuration changes to take effect. Grafana will automatically upgrade your existing alert rules and notification channels to the new Grafana Alerting system.
|
||||
1. **Review and Adjust Upgraded Alerts**:
|
||||
- **Review the upgraded alerts**: Go to the `Alerting` section of the navigation panel to review the upgraded alerts.
|
||||
- **Export upgraded resources**: If you use provisioning methods to manage alert rules and notification channels, you can export the upgraded versions to generate provisioning files compatible with Grafana Alerting.
|
||||
|
||||
## Additional Information
|
||||
|
||||
### Enable Grafana Alerting
|
||||
|
||||
Go to your custom configuration file ($WORKING_DIR/conf/custom.ini) and enter the following in your configuration:
|
||||
|
||||
```toml
|
||||
[alerting]
|
||||
enabled = false
|
||||
|
||||
[unified_alerting]
|
||||
enabled = true
|
||||
```
|
||||
|
||||
{{% admonition type="note" %}}
|
||||
If you have existing legacy alerts we advise using the [Upgrade with Preview]({{< relref "#upgrade-with-preview-recommended" >}}) method first to ensure a smooth transition. Any organizations that have not completed the preview upgrade will automatically undergo the simple upgrade during the next restart.
|
||||
{{% /admonition %}}
|
||||
|
||||
### Rolling back to legacy alerting
|
||||
|
||||
{{% admonition type="note" %}}
|
||||
For Grafana Cloud, contact customer support to enable or disable Grafana Alerting for your stack.
|
||||
{{% /admonition %}}
|
||||
|
||||
If you have upgraded to Grafana Alerting and want to roll back to legacy alerting, you can do so by disabling Grafana Alerting and re-enabling legacy alerting.
|
||||
|
||||
Go to your custom configuration file ($WORKING_DIR/conf/custom.ini) and enter the following in your configuration:
|
||||
|
||||
```toml
|
||||
[alerting]
|
||||
@@ -60,48 +157,7 @@ enabled = true
|
||||
enabled = false
|
||||
```
|
||||
|
||||
Installations that have been migrated to Grafana Alerting can roll back to legacy alerting at any time.
|
||||
|
||||
{{% admonition type="note" %}}
|
||||
This topic is only relevant for OSS and Enterprise customers. Contact customer support to enable or disable Grafana Alerting for your Grafana Cloud stack.
|
||||
{{% /admonition %}}
|
||||
|
||||
The `ngalert` toggle previously used to enable or disable Grafana Alerting is no longer available.
|
||||
|
||||
## Deactivate alerting
|
||||
|
||||
You can deactivate both Grafana Alerting and legacy alerting in Grafana.
|
||||
|
||||
1. Go to your custom configuration file ($WORKING_DIR/conf/custom.ini).
|
||||
1. Enter the following in your configuration:
|
||||
|
||||
```toml
|
||||
[alerting]
|
||||
enabled = false
|
||||
|
||||
[unified_alerting]
|
||||
enabled = false
|
||||
```
|
||||
|
||||
3. Restart Grafana for the configuration changes to take effect.
|
||||
|
||||
If you want to turn alerting back on, you can remove both flags to enable Grafana Alerting.
|
||||
|
||||
## Roll back
|
||||
|
||||
Once the upgrade has taken place, you still have the option to roll back to legacy alerting. If you choose to roll back, Grafana will restore your alerts to the alerts you had at the point in time when the upgrade took place.
|
||||
|
||||
To roll back to legacy alerting, enter the following in your configuration:
|
||||
|
||||
```toml
|
||||
[alerting]
|
||||
enabled = true
|
||||
|
||||
[unified_alerting]
|
||||
enabled = false
|
||||
```
|
||||
|
||||
> **Note**: The next time you upgrade to Grafana Alerting, Grafana will restore your Grafana Alerting alerts and configuration to those you had before rolling back.
|
||||
This action is non-destructive. You can seamlessly switch between legacy alerting and Grafana Alerting at any time without losing any data. However, the upgrade process will only be performed once. If you have opted out of Grafana Alerting and then opt in again, Grafana will not perform the upgrade again.
|
||||
|
||||
If, after rolling back, you wish to delete any existing Grafana Alerting configuration and upgrade your legacy alerting configuration again from scratch, you can enable the `clean_upgrade` option:
|
||||
|
||||
@@ -110,52 +166,39 @@ If, after rolling back, you wish to delete any existing Grafana Alerting configu
|
||||
clean_upgrade = true
|
||||
```
|
||||
|
||||
## Opt in
|
||||
### Differences and limitations
|
||||
|
||||
If you have previously disabled alerting in Grafana, or opted out of Grafana Alerting and have decided that you would now like to use Grafana Alerting, you can choose to opt in at any time.
|
||||
|
||||
If you have been using legacy alerting up until now your existing alerts will be migrated to the new alerts type and no alerts or alerting data are lost. Even if you choose to opt in to Grafana Alerting, you can roll back to legacy alerting at any time.
|
||||
|
||||
To opt in to Grafana Alerting, enter the following in your configuration:
|
||||
|
||||
```toml
|
||||
[alerting]
|
||||
enabled = false
|
||||
|
||||
[unified_alerting]
|
||||
enabled = true
|
||||
```
|
||||
|
||||
## Differences and limitations
|
||||
|
||||
There are some differences between Grafana Alerting and legacy dashboard alerts, and a number of features that are no
|
||||
longer supported.
|
||||
There are some differences between Grafana Alerting and legacy dashboard alerts, and a number of features that are no longer supported.
|
||||
|
||||
**Differences**
|
||||
|
||||
1. When Grafana Alerting is enabled or upgraded to Grafana 9.0 or later, existing legacy dashboard alerts migrate in a format compatible with the Grafana Alerting. In the Alerting page of your Grafana instance, you can view the migrated alerts alongside any new alerts.
|
||||
This topic explains how legacy dashboard alerts are migrated and some limitations of the migration.
|
||||
1. Read and write access to legacy dashboard alerts are governed by the dashboard permissions (including the inherited permissions from the folder) while Grafana alerts are governed by the permissions of the folder only. During the upgrade, an alert rule might be moved to a different folder to match the permissions of the dashboard. The following rules apply:
|
||||
|
||||
1. Read and write access to legacy dashboard alerts and Grafana alerts are governed by the permissions of the folders storing them. During migration, legacy dashboard alert permissions are matched to the new rules permissions as follows:
|
||||
- If the inherited dashboard permissions are different from the permissions of the folder, then the rule is moved to a new folder named after the original: `<Original folder name> - <Permission Hash>`.
|
||||
- If the inherited dashboard permissions are the same as the permissions of the folder, then the rule is moved to the original folder.
|
||||
- If the dashboard is in the `General` or `Dashboards` folder (i.e. no folder), then the rule is moved to a new `General Alerting - <Permission Hash>` folder.
|
||||
|
||||
- If there are dashboard permissions, a folder named `Migrated {"dashboardUid": "UID", "panelId": 1, "alertId": 1}` is created to match the permissions of the dashboard (including the inherited permissions from the folder).
|
||||
- If there are no dashboard permissions and the dashboard is in a folder, then the rule is linked to this folder and inherits its permissions.
|
||||
- If there are no dashboard permissions and the dashboard is in the General folder, then the rule is linked to the `General Alerting` folder and the rule inherits the default permissions.
|
||||
1. `NoData` and `Error` settings are upgraded as is to the corresponding settings in Grafana Alerting, except in two situations:
|
||||
|
||||
1. `NoData` and `Error` settings are migrated as is to the corresponding settings in Grafana Alerting, except in two situations:
|
||||
- As there is no `Keep Last State` option in Grafana Alerting, this option becomes either [`NoData` or `Error`][alerting_config_error_handling]. If using the `Simple Upgrade Method` Grafana automatically creates a 1 year silence for each alert rule with this configuration. If the alert evaluation returns no data or fails (error or timeout), then it creates a [special alert][special_alert], which will be silenced by the silence created during the upgrade.
|
||||
- Due to lack of validation, legacy alert rules imported via JSON or provisioned along with dashboards can contain arbitrary values for [`NoData` or `Error`][alerting_config_error_handling]. In this situation, Grafana will use the default setting: `NoData` for No data, and `Error` for Error.
|
||||
|
||||
3.1. As there is no `Keep Last State` option in Grafana Alerting, this option becomes either [`NoData` or `Error`](/docs/sources/alerting/alerting-rules/create-grafana-managed-rule/#configure-no-data-and-error-handling). To match the behavior of the `Keep Last State` as closely as possible during the migration Grafana automatically creates a silence for each alert rule with a duration of 1 year. If the alert evaluation returns no data or fails (error or timeout), then it creates a [special alert](/docs/sources/alerting/fundamentals/alert-rules/state-and-health/#special-alerts-for-nodata-and-error), which will be silenced by the silence created during the migration.
|
||||
|
||||
3.2. Due to lack of validation, legacy alert rules imported via JSON or provisioned along with dashboards can contain arbitrary values for [`NoData` or `Error`](/docs/sources/alerting/alerting-rules/create-grafana-managed-rule/#configure-no-data-and-error-handling). In this situation, Grafana will use the default setting: `NoData` for No data, and `Error` for Error.
|
||||
|
||||
1. Notification channels are migrated to an Alertmanager configuration with the appropriate routes and receivers. Default notification channels are added as contact points to the default route. Notification channels not associated with any Dashboard alert go to the `autogen-unlinked-channel-recv` route.
|
||||
1. Notification channels are upgraded to an Alertmanager configuration with the appropriate routes and receivers.
|
||||
|
||||
1. Unlike legacy dashboard alerts where images in notifications are enabled per contact point, images in notifications for Grafana Alerting must be enabled in the Grafana configuration, either in the configuration file or environment variables, and are enabled for either all or no contact points.
|
||||
|
||||
1. The JSON format for webhook notifications has changed in Grafana Alerting and uses the format from [Prometheus Alertmanager](https://prometheus.io/docs/alerting/latest/configuration/#webhook_config).
|
||||
|
||||
1. Alerting on Prometheus `Both` type queries is not supported in Grafana Alerting. Existing legacy alerts with `Both` type queries are migrated to Grafana Alerting as alerts with `Range` type queries.
|
||||
1. Alerting on Prometheus `Both` type queries is not supported in Grafana Alerting. Existing legacy alerts with `Both` type queries are upgraded to Grafana Alerting as alerts with `Range` type queries.
|
||||
|
||||
**Limitations**
|
||||
|
||||
1. Since `Hipchat` and `Sensu` notification channels are no longer supported, legacy alerts associated with these channels are not automatically migrated to Grafana Alerting. Assign the legacy alerts to a supported notification channel so that you continue to receive notifications for those alerts.
|
||||
1. Since `Hipchat` and `Sensu` notification channels are no longer supported, legacy alerts associated with these channels are not automatically upgraded to Grafana Alerting. Assign the legacy alerts to a supported notification channel so that you continue to receive notifications for those alerts.
|
||||
|
||||
{{% docs/reference %}}
|
||||
[alerting_config_error_handling]: "/docs/grafana/ -> /docs/grafana/<GRAFANA_VERSION>/alerting/alerting-rules/create-grafana-managed-rule#configure-no-data-and-error-handling"
|
||||
[alerting_config_error_handling]: "/docs/grafana-cloud/ -> /docs/grafana-cloud/alerting-and-irm/alerting/alerting-rules/create-grafana-managed-rule#configure-no-data-and-error-handling"
|
||||
|
||||
[special_alert]: "/docs/grafana/ -> /docs/grafana/<GRAFANA_VERSION>/alerting/fundamentals/alert-rules/state-and-health#special-alerts-for-nodata-and-error"
|
||||
[special_alert]: "/docs/grafana-cloud/ -> /docs/grafana-cloud/alerting-and-irm/alerting/fundamentals/alert-rules/state-and-health#special-alerts-for-nodata-and-error"
|
||||
{{% /docs/reference %}}
|
||||
|
||||
@@ -52,9 +52,9 @@ Refer to our [upgrade instructions][migrating-alerts].
|
||||
- [Angular support deprecation][angular_deprecation]
|
||||
|
||||
{{% docs/reference %}}
|
||||
[angular_deprecation]: "/docs/grafana/ -> /docs/grafana/<GRAFANA VERSION>/developers/angular_deprecation"
|
||||
[angular_deprecation]: "/docs/grafana-cloud/ -> /docs/grafana/<GRAFANA VERSION>/developers/angular_deprecation"
|
||||
[angular_deprecation]: "/docs/grafana/ -> /docs/grafana/<GRAFANA_VERSION>/developers/angular_deprecation"
|
||||
[angular_deprecation]: "/docs/grafana-cloud/ -> /docs/grafana/<GRAFANA_VERSION>/developers/angular_deprecation"
|
||||
|
||||
[migrating-alerts]: "/docs/grafana/ -> /docs/grafana/<GRAFANA VERSION>/alerting/set-up/migrating-alerts"
|
||||
[migrating-alerts]: "/docs/grafana/ -> /docs/grafana/<GRAFANA_VERSION>/alerting/set-up/migrating-alerts"
|
||||
[migrating-alerts]: "/docs/grafana-cloud/ -> /docs/grafana-cloud/alerting-and-irm/alerting/set-up/migrating-alerts"
|
||||
{{% /docs/reference %}}
|
||||
|
||||
@@ -14,44 +14,68 @@ labels:
|
||||
- cloud
|
||||
- enterprise
|
||||
- oss
|
||||
title: Provision Grafana Alerting resources
|
||||
title: Provision Alerting resources
|
||||
weight: 300
|
||||
---
|
||||
|
||||
# Provision Grafana Alerting resources
|
||||
# Provision Alerting resources
|
||||
|
||||
Alerting infrastructure is often complex, with many pieces of the pipeline that often live in different places. Scaling this across multiple teams and organizations is an especially challenging task. Grafana Alerting provisioning makes this process easier by enabling you to create, manage, and maintain your alerting data in a way that best suits your organization.
|
||||
Alerting infrastructure is often complex, with many pieces of the pipeline that often live in different places. Scaling this across multiple teams and organizations is an especially challenging task. Importing and exporting (or provisioning) your alerting resources in Grafana Alerting makes this process easier by enabling you to create, manage, and maintain your alerting data in a way that best suits your organization.
|
||||
|
||||
Provisioning for Grafana Alerting supports alert rules, contact points, notification policies, mute timings, and templates.
|
||||
You can import alert rules, contact points, notification policies, mute timings, and templates.
|
||||
|
||||
You cannot edit provisioned alerting resources in the Grafana UI in the same way as unprovisioned alerting resources. You can only edit provisioned contact points, notification policies, templates, and mute timings in the source where they were created. For example, if you provision your alerting resources using files from disk, you cannot edit the data in Terraform or from within Grafana.
|
||||
You cannot edit imported alerting resources in the Grafana UI in the same way as alerting resources that were not imported. You can only edit imported contact points, notification policies, templates, and mute timings in the source where they were created. For example, if you manage your alerting resources using files from disk, you cannot edit the data in Terraform or from within Grafana.
|
||||
|
||||
To modify provisioned alert rules, you can use the **Modify export** feature to edit and then export.
|
||||
## Import alerting resources
|
||||
|
||||
Choose from the options below to provision your Grafana Alerting resources.
|
||||
Choose from the options below to import (or provision) your Grafana Alerting resources.
|
||||
|
||||
1. Use file provisioning to provision your Grafana Alerting resources, such as alert rules and contact points, through files on disk.
|
||||
1. [Use configuration files to provision your alerting resources](/docs/grafana/<GRAFANA_VERSION>/alerting/set-up/provision-alerting-resources/file-provisioning), such as alert rules and contact points, through files on disk.
|
||||
|
||||
{{% admonition type="note" %}}
|
||||
{{< admonition type="note" >}}
|
||||
File provisioning is not available in Grafana Cloud instances.
|
||||
{{% /admonition %}}
|
||||
{{< /admonition >}}
|
||||
|
||||
2. Use the Alerting Provisioning HTTP API.
|
||||
1. Use [Terraform to provision alerting resources][alerting_tf_provisioning].
|
||||
|
||||
For more information on the Alerting Provisioning HTTP API, refer to [Alerting provisioning HTTP API][alerting_provisioning].
|
||||
1. Use the [Alerting provisioning HTTP API][alerting_http_provisioning] to manage alerting resources.
|
||||
|
||||
3. Use [Terraform](https://www.terraform.io/).
|
||||
{{< admonition type="note" >}}
|
||||
The JSON output from the majority of Alerting HTTP endpoints isn't compatible for provisioning via configuration files.
|
||||
Instead, use the [Export Alerting endpoints](/docs/grafana/<GRAFANA_VERSION>/alerting/set-up/provision-alerting-resources/export-alerting-resources#export-api-endpoints) to return or download the alerting resources in provisioning format.
|
||||
{{< /admonition >}}
|
||||
|
||||
## Export alerting resources
|
||||
|
||||
You can export both manually created and provisioned alerting resources. For more information, refer to [Export alerting resources][alerting_export].
|
||||
|
||||
To modify imported alert rules, you can use the **Modify export** feature to edit and then export.
|
||||
|
||||
## View provisioned alerting resources
|
||||
|
||||
To view your provisioned resources in Grafana, complete the following steps.
|
||||
|
||||
1. Open your Grafana instance.
|
||||
1. Navigate to Alerting.
|
||||
1. Click an alerting resource folder, for example, Alert rules.
|
||||
|
||||
Provisioned resources are labeled **Provisioned**, so that it is clear that they were not created manually.
|
||||
|
||||
**Useful Links:**
|
||||
|
||||
[Grafana provisioning][provisioning]
|
||||
|
||||
[Grafana Alerting provisioning API][alerting_provisioning]
|
||||
|
||||
{{% docs/reference %}}
|
||||
[alerting_provisioning]: "/docs/grafana/ -> /docs/grafana/<GRAFANA VERSION>/developers/http_api/alerting_provisioning"
|
||||
[alerting_provisioning]: "/docs/grafana-cloud/ -> /docs/grafana/<GRAFANA VERSION>/developers/http_api/alerting_provisioning"
|
||||
[alerting_tf_provisioning]: "/docs/grafana/ -> /docs/grafana/<GRAFANA_VERSION>/alerting/set-up/provision-alerting-resources/terraform-provisioning"
|
||||
[alerting_tf_provisioning]: "/docs/grafana-cloud/ -> /docs/grafana/<GRAFANA_VERSION>/alerting/set-up/provision-alerting-resources/terraform-provisioning"
|
||||
[alerting_http_provisioning]: "/docs/grafana/ -> /docs/grafana/<GRAFANA_VERSION>/alerting/set-up/provision-alerting-resources/http-api-provisioning"
|
||||
[alerting_http_provisioning]: "/docs/grafana-cloud/ -> /docs/grafana/<GRAFANA_VERSION>/alerting/set-up/provision-alerting-resources/http-api-provisioning"
|
||||
[alerting_export]: "/docs/grafana/ -> /docs/grafana/<GRAFANA_VERSION>/alerting/set-up/provision-alerting-resources/export-alerting-resources"
|
||||
[alerting_export]: "/docs/grafana-cloud/ -> /docs/grafana/<GRAFANA_VERSION>/alerting/set-up/provision-alerting-resources/export-alerting-resources"
|
||||
|
||||
[provisioning]: "/docs/grafana/ -> /docs/grafana/<GRAFANA VERSION>/administration/provisioning"
|
||||
[provisioning]: "/docs/grafana-cloud/ -> /docs/grafana/<GRAFANA VERSION>/administration/provisioning"
|
||||
[alerting_export_http]: "/docs/grafana/ -> /docs/grafana/<GRAFANA_VERSION>/alerting/set-up/provision-alerting-resources/export-alerting-resources#export-api-endpoints"
|
||||
[alerting_export_http]: "/docs/grafana-cloud/ -> /docs/grafana/<GRAFANA_VERSION>/alerting/set-up/provision-alerting-resources/export-alerting-resources#export-api-endpoints"
|
||||
|
||||
[provisioning]: "/docs/grafana/ -> /docs/grafana/<GRAFANA_VERSION>/administration/provisioning"
|
||||
[provisioning]: "/docs/grafana-cloud/ -> /docs/grafana/<GRAFANA_VERSION>/administration/provisioning"
|
||||
{{% /docs/reference %}}
|
||||
|
||||
@@ -0,0 +1,110 @@
|
||||
---
|
||||
aliases:
|
||||
- ../../provision-alerting-resources/view-provisioned-resources/
|
||||
- ./view-provisioned-resources/
|
||||
canonical: https://grafana.com/docs/grafana/latest/alerting/set-up/provision-alerting-resources/export-alerting-resources/
|
||||
description: Export alerting resources in Grafana
|
||||
keywords:
|
||||
- grafana
|
||||
- alerting
|
||||
- alerting resources
|
||||
- provisioning
|
||||
labels:
|
||||
products:
|
||||
- cloud
|
||||
- enterprise
|
||||
- oss
|
||||
title: Export alerting resources
|
||||
weight: 300
|
||||
---
|
||||
|
||||
# Export alerting resources
|
||||
|
||||
Export your alerting resources, such as alert rules, contact points, and notification policies for provisioning, automatically importing single folders and single groups.
|
||||
|
||||
The export options listed below enable you to download resources in YAML, JSON, or Terraform format, facilitating their provisioning through [configuration files](/docs/grafana/<GRAFANA_VERSION>/alerting/set-up/provision-alerting-resources/file-provisioning) or [Terraform][alerting_tf_provisioning].
|
||||
|
||||
## Export alert rules
|
||||
|
||||
To export alert rules from the Grafana UI, complete the following steps.
|
||||
|
||||
1. Click **Alerts & IRM** -> **Alert rules**.
|
||||
1. To export all Grafana-managed rules, click **Export rules**.
|
||||
1. To export a folder, change the **View as** to **List**.
|
||||
1. Select the folder you want to export and click the **Export rules folder** icon.
|
||||
1. To export a group, change the **View as** to **Grouped**.
|
||||
1. Find the group you want to export and click the **Export rule group** icon.
|
||||
1. Choose the format to export in.
|
||||
|
||||
The exported rule data appears in different formats - YAML, JSON, Terraform.
|
||||
|
||||
1. Click **Copy Code** or **Download**.
|
||||
|
||||
a. Choose **Copy Code** to go to an existing file and paste in the code.
|
||||
|
||||
b. Choose **Download** to download a file with the exported data.
|
||||
|
||||
## Modify and export alert rules without saving changes
|
||||
|
||||
Use the **Modify export** mode to edit and export an alert rule without updating it.
|
||||
|
||||
{{% admonition type="note" %}} This feature is for Grafana-managed alert rules only. It is available to Admin, Viewer, and Editor roles. {{% /admonition %}}
|
||||
|
||||
To export a modified alert rule without saving the modifications, complete the following steps from the Grafana UI.
|
||||
|
||||
1. Click **Alerts & IRM** -> **Alert rules**.
|
||||
1. Locate the alert rule you want to edit and click **More** -> **Modify Export** to open the Alert Rule form.
|
||||
1. From the Alert Rule form, edit the fields you want to change. Changes made are not applied to the alert rule.
|
||||
1. Click **Export**.
|
||||
1. Choose the format to export in.
|
||||
|
||||
The exported rule data appears in different formats - YAML, JSON, Terraform.
|
||||
|
||||
1. Click **Copy Code** or **Download**.
|
||||
|
||||
a. Choose **Copy Code** to go to an existing file and paste in the code.
|
||||
|
||||
b. Choose **Download** to download a file with the exported data.
|
||||
|
||||
## Export API endpoints
|
||||
|
||||
You can also use the **Alerting provisioning HTTP API** to export alerting resources in YAML or JSON formats for provisioning.
|
||||
|
||||
Note that most Alerting endpoints return a JSON format that is not compatible for provisioning via configuration files, except the ones listed below.
|
||||
|
||||
| Method | URI | Summary |
|
||||
| ------ | ---------------------------------------------------------------- | ---------------------------------------------------------------------------------------- |
|
||||
| GET | /api/v1/provisioning/alert-rules/:uid/export | [Export an alert rule in provisioning file format.][export_rule] |
|
||||
| GET | /api/v1/provisioning/folder/:folderUid/rule-groups/:group/export | [Export an alert rule group in provisioning file format.][export_rule_group] |
|
||||
| GET | /api/v1/provisioning/alert-rules/export | [Export all alert rules in provisioning file format.][export_rules] |
|
||||
| GET | /api/v1/provisioning/contact-points/export | [Export all contact points in provisioning file format.][export_contacts] |
|
||||
| GET | /api/v1/provisioning/policies/export | [Export the notification policy tree in provisioning file format.][export_notifications] |
|
||||
|
||||
These endpoints accept a `download` parameter to download a file containing the exported resources.
|
||||
|
||||
<!-- prettier-ignore-start -->
|
||||
|
||||
{{% docs/reference %}}
|
||||
[alerting_tf_provisioning]: "/docs/grafana/ -> /docs/grafana/<GRAFANA_VERSION>/alerting/set-up/provision-alerting-resources/terraform-provisioning"
|
||||
[alerting_tf_provisioning]: "/docs/grafana-cloud/ -> /docs/grafana/<GRAFANA_VERSION>/alerting/set-up/provision-alerting-resources/terraform-provisioning"
|
||||
|
||||
[alerting_http_provisioning]: "/docs/grafana/ -> /docs/grafana/<GRAFANA_VERSION>/alerting/set-up/provision-alerting-resources/http-api-provisioning"
|
||||
[alerting_http_provisioning]: "/docs/grafana-cloud/ -> /docs/grafana/<GRAFANA_VERSION>/alerting/set-up/provision-alerting-resources/http-api-provisioning"
|
||||
|
||||
[export_rule]: "/docs/grafana/ -> /docs/grafana/<GRAFANA_VERSION>/alerting/set-up/provision-alerting-resources/http-api-provisioning/#span-idroute-get-alert-rule-exportspan-export-an-alert-rule-in-provisioning-file-format-_routegetalertruleexport_"
|
||||
[export_rule]: "/docs/grafana-cloud/ -> /docs/grafana/<GRAFANA_VERSION>/alerting/set-up/provision-alerting-resources/http-api-provisioning/#span-idroute-get-alert-rule-exportspan-export-an-alert-rule-in-provisioning-file-format-_routegetalertruleexport_"
|
||||
|
||||
[export_rule_group]: "/docs/grafana/ -> /docs/grafana/<GRAFANA_VERSION>/alerting/set-up/provision-alerting-resources/http-api-provisioning/#span-idroute-get-alert-rule-group-exportspan-export-an-alert-rule-group-in-provisioning-file-format-_routegetalertrulegroupexport_"
|
||||
[export_rule_group]: "/docs/grafana-cloud/ -> /docs/grafana/<GRAFANA_VERSION>/alerting/set-up/provision-alerting-resources/http-api-provisioning/#span-idroute-get-alert-rule-group-exportspan-export-an-alert-rule-group-in-provisioning-file-format-_routegetalertrulegroupexport_"
|
||||
|
||||
[export_rules]: "/docs/grafana/ -> /docs/grafana/<GRAFANA_VERSION>/alerting/set-up/provision-alerting-resources/http-api-provisioning/#span-idroute-get-alert-rules-exportspan-export-all-alert-rules-in-provisioning-file-format-_routegetalertrulesexport_"
|
||||
[export_rules]: "/docs/grafana-cloud/ -> /docs/grafana/<GRAFANA_VERSION>/alerting/set-up/provision-alerting-resources/http-api-provisioning/#span-idroute-get-alert-rules-exportspan-export-all-alert-rules-in-provisioning-file-format-_routegetalertrulesexport_"
|
||||
|
||||
[export_contacts]: "/docs/grafana/ -> /docs/grafana/<GRAFANA_VERSION>/alerting/set-up/provision-alerting-resources/http-api-provisioning/#span-idroute-get-contactpoints-exportspan-export-all-contact-points-in-provisioning-file-format-_routegetcontactpointsexport_"
|
||||
[export_contacts]: "/docs/grafana-cloud/ -> /docs/grafana/<GRAFANA_VERSION>/alerting/set-up/provision-alerting-resources/http-api-provisioning/#span-idroute-get-contactpoints-exportspan-export-all-contact-points-in-provisioning-file-format-_routegetcontactpointsexport_"
|
||||
|
||||
[export_notifications]: "/docs/grafana/ -> /docs/grafana/<GRAFANA_VERSION>/alerting/set-up/provision-alerting-resources/http-api-provisioning/#span-idroute-get-policy-tree-exportspan-export-the-notification-policy-tree-in-provisioning-file-format-_routegetpolicytreeexport_"
|
||||
[export_notifications]: "/docs/grafana-cloud/ -> /docs/grafana/<GRAFANA_VERSION>/alerting/set-up/provision-alerting-resources/http-api-provisioning/#span-idroute-get-policy-tree-exportspan-export-the-notification-policy-tree-in-provisioning-file-format-_routegetpolicytreeexport_"
|
||||
{{% /docs/reference %}}
|
||||
|
||||
<!-- prettier-ignore-end -->
|
||||
@@ -11,41 +11,43 @@ keywords:
|
||||
- provisioning
|
||||
labels:
|
||||
products:
|
||||
- cloud
|
||||
- enterprise
|
||||
- oss
|
||||
title: Create and manage alerting resources using file provisioning
|
||||
menuTitle: Use configuration files to provision
|
||||
title: Use configuration files to provision alerting resources
|
||||
weight: 100
|
||||
---
|
||||
|
||||
## Create and manage alerting resources using file provisioning
|
||||
# Use configuration files to provision alerting resources
|
||||
|
||||
Provision your alerting resources using files from disk. When you start Grafana, the data from these files is created in your Grafana system. Grafana adds any new resources you created, updates any that you changed, and deletes old ones.
|
||||
Manage your alerting resources using files from disk. When you start Grafana, the data from these files is created in your Grafana system. Grafana adds any new resources you created, updates any that you changed, and deletes old ones.
|
||||
|
||||
Arrange your files in a directory in a way that best suits your use case. For example, you can choose a team-based layout where every team has its own file, you can have one big file for all your teams; or you can have one file per resource type.
|
||||
|
||||
Details on how to set up the files and which fields are required for each object are listed below depending on which resource you are provisioning.
|
||||
|
||||
**Note:**
|
||||
For a complete guide about how Grafana provisions resources, refer to the [Provision Grafana][provisioning] documentation.
|
||||
|
||||
Provisioning takes place during the initial set up of your Grafana system, but you can re-run it at any time using the [Grafana Admin API][reload-provisioning-configurations].
|
||||
{{< admonition type="note" >}}
|
||||
|
||||
### Provision alert rules
|
||||
- You cannot edit provisioned resources from files in Grafana. You can only change the resource properties by changing the provisioning file and restarting Grafana or carrying out a hot reload. This prevents changes being made to the resource that would be overwritten if a file is provisioned again or a hot reload is carried out.
|
||||
|
||||
- Importing takes place during the initial set up of your Grafana system, but you can re-run it at any time using the [Grafana Admin API](/docs/grafana/<GRAFANA_VERSION>/developers/http_api/admin#reload-provisioning-configurations).
|
||||
|
||||
- Importing an existing alerting resource results in a conflict. First, when present, remove the resources you plan to import.
|
||||
{{< /admonition >}}
|
||||
|
||||
## Import alert rules
|
||||
|
||||
Create or delete alert rules in your Grafana instance(s).
|
||||
|
||||
1. Create alert rules in Grafana.
|
||||
1. Use the [Alerting provisioning API][alerting_provisioning] export endpoints to download a provisioning file for your alert rules.
|
||||
1. Copy the contents into a YAML or JSON configuration file in the default provisioning directory or in your configured directory.
|
||||
1. [Export][alerting_export] and download a provisioning file for your alert rules.
|
||||
1. Copy the contents into a YAML or JSON configuration file in the `provisioning/alerting` directory.
|
||||
|
||||
Example configuration files can be found below.
|
||||
|
||||
1. Ensure that your files are in the right directory on the node running the Grafana server, so that they deploy alongside your Grafana instance(s).
|
||||
1. Delete the alert rules in Grafana that will be provisioned.
|
||||
|
||||
**Note:**
|
||||
|
||||
If you do not delete the alert rule, it will clash with the provisioned alert rule once uploaded.
|
||||
1. Add the file(s) to your GitOps workflow, so that they deploy alongside your Grafana instance(s).
|
||||
|
||||
Here is an example of a configuration file for creating alert rules.
|
||||
|
||||
@@ -133,17 +135,17 @@ deleteRules:
|
||||
uid: my_id_1
|
||||
```
|
||||
|
||||
### Provision contact points
|
||||
## Import contact points
|
||||
|
||||
Create or delete contact points in your Grafana instance(s).
|
||||
|
||||
1. Create a contact point in Grafana.
|
||||
1. Use the [Alerting provisioning API][alerting_provisioning] export endpoints to download a provisioning file for your contact point.
|
||||
1. Copy the contents into a YAML or JSON configuration file in the default provisioning directory or in your configured directory.
|
||||
1. [Export][alerting_export] and download a provisioning file for your contact point.
|
||||
1. Copy the contents into a YAML or JSON configuration file in the `provisioning/alerting` directory.
|
||||
|
||||
Example configuration files can be found below.
|
||||
|
||||
1. Ensure that your files are in the right directory on the node running the Grafana server, so that they deploy alongside your Grafana instance(s).
|
||||
1. Add the file(s) to your GitOps workflow, so that they deploy alongside your Grafana instance(s).
|
||||
|
||||
Here is an example of a configuration file for creating contact points.
|
||||
|
||||
@@ -183,12 +185,14 @@ deleteContactPoints:
|
||||
uid: first_uid
|
||||
```
|
||||
|
||||
#### Settings
|
||||
### Settings
|
||||
|
||||
Here are some examples of settings you can use for the different
|
||||
contact point integrations.
|
||||
|
||||
##### Alertmanager
|
||||
{{< collapse title="Alertmanager" >}}
|
||||
|
||||
#### Alertmanager
|
||||
|
||||
```yaml
|
||||
type: prometheus-alertmanager
|
||||
@@ -201,7 +205,11 @@ settings:
|
||||
basicAuthPassword: abc123
|
||||
```
|
||||
|
||||
##### DingDing
|
||||
{{< /collapse >}}
|
||||
|
||||
{{< collapse title="DingDing" >}}
|
||||
|
||||
#### DingDing
|
||||
|
||||
```yaml
|
||||
type: dingding
|
||||
@@ -215,7 +223,11 @@ settings:
|
||||
{{ template "default.message" . }}
|
||||
```
|
||||
|
||||
##### Discord
|
||||
{{< /collapse >}}
|
||||
|
||||
{{< collapse title="Discord" >}}
|
||||
|
||||
#### Discord
|
||||
|
||||
```yaml
|
||||
type: discord
|
||||
@@ -231,7 +243,11 @@ settings:
|
||||
{{ template "default.message" . }}
|
||||
```
|
||||
|
||||
##### E-Mail
|
||||
{{< /collapse >}}
|
||||
|
||||
{{< collapse title="E-Mail" >}}
|
||||
|
||||
#### E-Mail
|
||||
|
||||
```yaml
|
||||
type: email
|
||||
@@ -247,7 +263,11 @@ settings:
|
||||
{{ template "default.title" . }}
|
||||
```
|
||||
|
||||
##### Google Chat
|
||||
{{< /collapse >}}
|
||||
|
||||
{{< collapse title="Google Chat" >}}
|
||||
|
||||
#### Google Chat
|
||||
|
||||
```yaml
|
||||
type: googlechat
|
||||
@@ -259,7 +279,11 @@ settings:
|
||||
{{ template "default.message" . }}
|
||||
```
|
||||
|
||||
##### Kafka
|
||||
{{< /collapse >}}
|
||||
|
||||
{{< collapse title="Kafka" >}}
|
||||
|
||||
#### Kafka
|
||||
|
||||
```yaml
|
||||
type: kafka
|
||||
@@ -270,7 +294,11 @@ settings:
|
||||
kafkaTopic: topic1
|
||||
```
|
||||
|
||||
##### LINE
|
||||
{{< /collapse >}}
|
||||
|
||||
{{< collapse title="LINE" >}}
|
||||
|
||||
#### LINE
|
||||
|
||||
```yaml
|
||||
type: line
|
||||
@@ -279,7 +307,11 @@ settings:
|
||||
token: xxx
|
||||
```
|
||||
|
||||
##### Microsoft Teams
|
||||
{{< /collapse >}}
|
||||
|
||||
{{< collapse title="Microsoft Teams" >}}
|
||||
|
||||
#### Microsoft Teams
|
||||
|
||||
```yaml
|
||||
type: teams
|
||||
@@ -296,7 +328,11 @@ settings:
|
||||
{{ template "default.message" . }}
|
||||
```
|
||||
|
||||
##### OpsGenie
|
||||
{{< /collapse >}}
|
||||
|
||||
{{< collapse title="OpsGenie" >}}
|
||||
|
||||
#### OpsGenie
|
||||
|
||||
```yaml
|
||||
type: opsgenie
|
||||
@@ -318,7 +354,11 @@ settings:
|
||||
sendTagsAs: both
|
||||
```
|
||||
|
||||
##### PagerDuty
|
||||
{{< /collapse >}}
|
||||
|
||||
{{< collapse title="PagerDuty" >}}
|
||||
|
||||
#### PagerDuty
|
||||
|
||||
```yaml
|
||||
type: pagerduty
|
||||
@@ -338,7 +378,11 @@ settings:
|
||||
{{ template "default.message" . }}
|
||||
```
|
||||
|
||||
##### Pushover
|
||||
{{< /collapse >}}
|
||||
|
||||
{{< collapse title="Pushover" >}}
|
||||
|
||||
#### Pushover
|
||||
|
||||
```yaml
|
||||
type: pushover
|
||||
@@ -364,7 +408,11 @@ settings:
|
||||
{{ template "default.message" . }}
|
||||
```
|
||||
|
||||
##### Slack
|
||||
{{< /collapse >}}
|
||||
|
||||
{{< collapse title="Slack" >}}
|
||||
|
||||
#### Slack
|
||||
|
||||
```yaml
|
||||
type: slack
|
||||
@@ -396,7 +444,11 @@ settings:
|
||||
{{ template "slack.default.text" . }}
|
||||
```
|
||||
|
||||
##### Sensu Go
|
||||
{{< /collapse >}}
|
||||
|
||||
{{< collapse title="Sensu Go" >}}
|
||||
|
||||
#### Sensu Go
|
||||
|
||||
```yaml
|
||||
type: sensugo
|
||||
@@ -418,7 +470,11 @@ settings:
|
||||
{{ template "default.message" . }}
|
||||
```
|
||||
|
||||
##### Telegram
|
||||
{{< /collapse >}}
|
||||
|
||||
{{< collapse title="Telegram" >}}
|
||||
|
||||
#### Telegram
|
||||
|
||||
```yaml
|
||||
type: telegram
|
||||
@@ -432,7 +488,11 @@ settings:
|
||||
{{ template "default.message" . }}
|
||||
```
|
||||
|
||||
##### Threema Gateway
|
||||
{{< /collapse >}}
|
||||
|
||||
{{< collapse title="Threema Gateway" >}}
|
||||
|
||||
#### Threema Gateway
|
||||
|
||||
```yaml
|
||||
type: threema
|
||||
@@ -445,7 +505,11 @@ settings:
|
||||
recipient_id: A9R4KL4S
|
||||
```
|
||||
|
||||
##### VictorOps
|
||||
{{< /collapse >}}
|
||||
|
||||
{{< collapse title="VictorOps" >}}
|
||||
|
||||
#### VictorOps
|
||||
|
||||
```yaml
|
||||
type: victorops
|
||||
@@ -456,7 +520,11 @@ settings:
|
||||
messageType: CRITICAL
|
||||
```
|
||||
|
||||
##### Webhook
|
||||
{{< /collapse >}}
|
||||
|
||||
{{< collapse title="Webhook" >}}
|
||||
|
||||
#### Webhook
|
||||
|
||||
```yaml
|
||||
type: webhook
|
||||
@@ -477,7 +545,11 @@ settings:
|
||||
maxAlerts: '10'
|
||||
```
|
||||
|
||||
##### WeCom
|
||||
{{< /collapse >}}
|
||||
|
||||
{{< collapse title="WeCom" >}}
|
||||
|
||||
#### WeCom
|
||||
|
||||
```yaml
|
||||
type: wecom
|
||||
@@ -492,17 +564,27 @@ settings:
|
||||
{{ template "default.title" . }}
|
||||
```
|
||||
|
||||
### Provision notification policies
|
||||
{{< /collapse >}}
|
||||
|
||||
## Import notification policies
|
||||
|
||||
Create or reset the notification policy tree in your Grafana instance(s).
|
||||
|
||||
In Grafana, the entire notification policy tree is considered a single, large resource. Add new specific policies as sub-policies under the root policy. Since specific policies may depend on each other, you cannot provision subsets of the policy tree; the entire tree must be defined in a single place.
|
||||
|
||||
{{% admonition type="warning" %}}
|
||||
|
||||
Since the policy tree is a single resource, provisioning it will overwrite a policy tree created through any other means.
|
||||
|
||||
{{< /admonition >}}
|
||||
|
||||
1. Create a notification policy in Grafana.
|
||||
1. Use the [Alerting provisioning API][alerting_provisioning] export endpoints to download a provisioning file for your notification policy.
|
||||
1. Copy the contents into a YAML or JSON configuration file in the default provisioning directory or in your configured directory.
|
||||
1. [Export][alerting_export] and download a provisioning file for your notification policy.
|
||||
1. Copy the contents into a YAML or JSON configuration file in the `provisioning/alerting` directory.
|
||||
|
||||
Example configuration files can be found below.
|
||||
|
||||
1. Ensure that your files are in the right directory on the node running the Grafana server, so that they deploy alongside your Grafana instance(s).
|
||||
1. Add the file(s) to your GitOps workflow, so that they deploy alongside your Grafana instance(s).
|
||||
|
||||
Here is an example of a configuration file for creating notification policies.
|
||||
|
||||
@@ -578,13 +660,7 @@ resetPolicies:
|
||||
- 1
|
||||
```
|
||||
|
||||
**Note:**
|
||||
|
||||
In Grafana, the entire notification policy tree is considered a single, large resource. Add new specific policies as sub-policies under the root policy. Since specific policies may depend on each other, you cannot provision subsets of the policy tree; the entire tree must be defined in a single place.
|
||||
|
||||
Since the policy tree is a single resource, applying it will overwrite a policy tree created through any other means.
|
||||
|
||||
### Provision templates
|
||||
## Import templates
|
||||
|
||||
Create or delete templates in your Grafana instance(s).
|
||||
|
||||
@@ -592,7 +668,7 @@ Create or delete templates in your Grafana instance(s).
|
||||
|
||||
Example configuration files can be found below.
|
||||
|
||||
2. Add the file(s) to your GitOps workflow, so that they deploy alongside your Grafana instance(s).
|
||||
1. Add the file(s) to your GitOps workflow, so that they deploy alongside your Grafana instance(s).
|
||||
|
||||
Here is an example of a configuration file for creating templates.
|
||||
|
||||
@@ -603,10 +679,10 @@ apiVersion: 1
|
||||
# List of templates to import or update
|
||||
templates:
|
||||
# <int> organization ID, default = 1
|
||||
- orgID: 1
|
||||
- orgId: 1
|
||||
# <string, required> name of the template, must be unique
|
||||
name: my_first_template
|
||||
# <string, required> content of the the template
|
||||
# <string, required> content of the template
|
||||
template: Alerting with a custom text template
|
||||
```
|
||||
|
||||
@@ -624,7 +700,7 @@ deleteTemplates:
|
||||
name: my_first_template
|
||||
```
|
||||
|
||||
### Provision mute timings
|
||||
## Import mute timings
|
||||
|
||||
Create or delete mute timings in your Grafana instance(s).
|
||||
|
||||
@@ -673,65 +749,68 @@ deleteMuteTimes:
|
||||
name: mti_1
|
||||
```
|
||||
|
||||
### File provisioning using Kubernetes
|
||||
## File provisioning using Kubernetes
|
||||
|
||||
If you are a Kubernetes user, you can leverage file provisioning using Kubernetes configuration maps.
|
||||
|
||||
1. Create one or more configuration maps as follows.
|
||||
|
||||
```yaml
|
||||
apiVersion: v1
|
||||
kind: ConfigMap
|
||||
metadata:
|
||||
name: grafana-alerting
|
||||
data:
|
||||
provisioning.yaml: |
|
||||
templates:
|
||||
- name: my_first_template
|
||||
template: the content for my template
|
||||
```
|
||||
```yaml
|
||||
apiVersion: v1
|
||||
kind: ConfigMap
|
||||
metadata:
|
||||
name: grafana-alerting
|
||||
data:
|
||||
provisioning.yaml: |
|
||||
templates:
|
||||
- name: my_first_template
|
||||
template: the content for my template
|
||||
```
|
||||
|
||||
2. Add the file(s) to your GitOps workflow, so that they deploy alongside your Grafana instance(s).
|
||||
1. Add the file(s) to your GitOps workflow, so that they deploy alongside your Grafana instance(s).
|
||||
|
||||
```yaml
|
||||
apiVersion: apps/v1
|
||||
kind: Deployment
|
||||
metadata:
|
||||
name: grafana
|
||||
spec:
|
||||
replicas: 1
|
||||
selector:
|
||||
matchLabels:
|
||||
app: grafana
|
||||
template:
|
||||
metadata:
|
||||
name: grafana
|
||||
labels:
|
||||
app: grafana
|
||||
spec:
|
||||
containers:
|
||||
- name: grafana
|
||||
image: grafana/grafana:latest
|
||||
ports:
|
||||
- name: grafana
|
||||
containerPort: 3000
|
||||
volumeMounts:
|
||||
- mountPath: /etc/grafana/provisioning/alerting
|
||||
name: grafana-alerting
|
||||
readOnly: false
|
||||
volumes:
|
||||
- name: grafana-alerting
|
||||
configMap:
|
||||
defaultMode: 420
|
||||
name: grafana-alerting
|
||||
```
|
||||
|
||||
This eliminates the need for a persistent database to use Grafana Alerting in Kubernetes; all your provisioned resources appear after each restart or re-deployment. Grafana still requires a database for normal operation, you do not need to persist the contents of the database between restarts if all objects are provisioned using files.
|
||||
|
||||
{{% docs/reference %}}
|
||||
[alerting_provisioning]: "/docs/grafana/ -> /docs/grafana/<GRAFANA VERSION>/developers/http_api/alerting_provisioning"
|
||||
[alerting_provisioning]: "/docs/grafana-cloud/ -> /docs/grafana/<GRAFANA VERSION>/developers/http_api/alerting_provisioning"
|
||||
**Useful Links:**
|
||||
|
||||
[reload-provisioning-configurations]: "/docs/grafana/ -> /docs/grafana/<GRAFANA VERSION>/developers/http_api/admin#reload-provisioning-configurations"
|
||||
[reload-provisioning-configurations]: "/docs/grafana-cloud/ -> /docs/grafana/<GRAFANA VERSION>/developers/http_api/admin#reload-provisioning-configurations"
|
||||
[Grafana provisioning][provisioning]
|
||||
|
||||
{{% docs/reference %}}
|
||||
[alerting_export]: "/docs/grafana/ -> /docs/grafana/<GRAFANA_VERSION>/alerting/set-up/provision-alerting-resources/export-alerting-resources"
|
||||
[alerting_export]: "/docs/grafana-cloud/ -> /docs/grafana/<GRAFANA_VERSION>/alerting/set-up/provision-alerting-resources/export-alerting-resources"
|
||||
[provisioning]: "/docs/grafana/ -> /docs/grafana/<GRAFANA_VERSION>/administration/provisioning"
|
||||
[provisioning]: "/docs/grafana-cloud/ -> /docs/grafana/<GRAFANA_VERSION>/administration/provisioning"
|
||||
{{% /docs/reference %}}
|
||||
|
||||
@@ -0,0 +1,20 @@
|
||||
---
|
||||
canonical: https://grafana.com/docs/grafana/latest/developers/http_api/alerting_provisioning/
|
||||
description: Create and manage alerting resources using the HTTP API
|
||||
keywords:
|
||||
- grafana
|
||||
- alerting
|
||||
- alerting resources
|
||||
- provisioning
|
||||
labels:
|
||||
products:
|
||||
- cloud
|
||||
- enterprise
|
||||
- oss
|
||||
title: Use the HTTP API to manage alerting resources
|
||||
weight: 400
|
||||
---
|
||||
|
||||
# Use the HTTP API to manage alerting resources
|
||||
|
||||
{{< docs/shared lookup="alerts/alerting_provisioning.md" source="grafana" version="latest" >}}
|
||||
@@ -11,41 +11,46 @@ keywords:
|
||||
- Terraform
|
||||
labels:
|
||||
products:
|
||||
- cloud
|
||||
- enterprise
|
||||
- oss
|
||||
title: Create and manage alerting resources using Terraform
|
||||
menuTitle: Use Terraform to provision
|
||||
title: Use Terraform to provision alerting resources
|
||||
weight: 200
|
||||
---
|
||||
|
||||
# Create and manage alerting resources using Terraform
|
||||
# Use Terraform to provision alerting resources
|
||||
|
||||
Use Terraform’s Grafana Provider to manage your alerting resources and provision them into your Grafana system. Terraform provider support for Grafana Alerting makes it easy to create, manage, and maintain your entire Grafana Alerting stack as code.
|
||||
|
||||
For more information on managing your alerting resources using Terraform, refer to the [Grafana Provider](https://registry.terraform.io/providers/grafana/grafana/latest/docs) documentation.
|
||||
Refer to [Grafana Provider](https://registry.terraform.io/providers/grafana/grafana/latest/docs) documentation for more examples and information on Terraform Alerting schemas.
|
||||
|
||||
Complete the following tasks to create and manage your alerting resources using Terraform.
|
||||
|
||||
1. Create an API key for provisioning.
|
||||
1. Configure the Terraform provider.
|
||||
1. Define your alerting resources in Terraform.
|
||||
1. Define your alerting resources in Terraform. [Export alerting resources][alerting_export] in Terraform format, or implement the [Terraform Alerting schemas](https://registry.terraform.io/providers/grafana/grafana/latest/docs).
|
||||
|
||||
1. Run `terraform apply` to provision your alerting resources.
|
||||
|
||||
## Before you begin
|
||||
{{< admonition type="note" >}}
|
||||
|
||||
- Ensure you have the grafana/grafana [Terraform provider](https://registry.terraform.io/providers/grafana/grafana/1.28.0) 1.27.0 or higher.
|
||||
- By default, you cannot edit resources provisioned from Terraform from the UI. This ensures that your alerting stack always stays in sync with your code. To change the default behaviour, refer to [Edit provisioned resources in the Grafana UI](#edit-provisioned-resources-in-the-grafana-ui).
|
||||
|
||||
- Ensure you are using Grafana 9.1 or higher.
|
||||
- Before you begin, ensure you have the [Grafana Terraform Provider](https://registry.terraform.io/providers/grafana/grafana/) 1.27.0 or higher, and are using Grafana 9.1 or higher.
|
||||
|
||||
{{< /admonition >}}
|
||||
|
||||
## Create an API key for provisioning
|
||||
|
||||
You can [create a normal Grafana API key][api-keys] to authenticate Terraform with Grafana. Most existing tooling using API keys should automatically work with the new Grafana Alerting support.
|
||||
You can create a [service account token][service-accounts] to authenticate Terraform with Grafana. Most existing tooling using API keys should automatically work with the new Grafana Alerting support.
|
||||
|
||||
There are also dedicated RBAC roles for alerting provisioning. This lets you easily authenticate as a [service account][service-accounts] with the minimum permissions needed to provision your Alerting infrastructure.
|
||||
There are also dedicated RBAC roles for alerting provisioning. This lets you easily authenticate as a service account with the minimum permissions needed to provision your Alerting infrastructure.
|
||||
|
||||
To create an API key for provisioning, complete the following steps.
|
||||
|
||||
1. Create a new service account for your CI pipeline.
|
||||
1. Assign the role “Access the alert rules Provisioning API.”
|
||||
1. Create a new service account.
|
||||
1. Assign the role or permission to access the [Alerting provisioning API][alerting_http_provisioning].
|
||||
1. Create a new service account token.
|
||||
1. Name and save the token for use in Terraform.
|
||||
|
||||
@@ -73,70 +78,68 @@ provider "grafana" {
|
||||
}
|
||||
```
|
||||
|
||||
## Provision contact points and templates
|
||||
## Import contact points and templates
|
||||
|
||||
Contact points connect an alerting stack to the outside world. They tell Grafana how to connect to your external systems and where to deliver notifications. There are over fifteen different [integrations](https://registry.terraform.io/providers/grafana/grafana/latest/docs/resources/contact_point#optional) to choose from.
|
||||
Contact points connect an alerting stack to the outside world. They tell Grafana how to connect to your external systems and where to deliver notifications.
|
||||
|
||||
To provision contact points and templates, complete the following steps.
|
||||
To provision contact points and templates, refer to the [grafana_contact_point schema](https://registry.terraform.io/providers/grafana/grafana/latest/docs/resources/contact_point) and [grafana_message_template schema](https://registry.terraform.io/providers/grafana/grafana/latest/docs/resources/message_template), and complete the following steps.
|
||||
|
||||
1. Copy this code block into a .tf file on your local machine.
|
||||
1. Copy this code block into a `.tf` file on your local machine.
|
||||
|
||||
This example creates a contact point that sends alert notifications to Slack.
|
||||
This example creates a contact point that sends alert notifications to Slack.
|
||||
|
||||
```HCL
|
||||
resource "grafana_contact_point" "my_slack_contact_point" {
|
||||
name = "Send to My Slack Channel"
|
||||
```HCL
|
||||
resource "grafana_contact_point" "my_slack_contact_point" {
|
||||
name = "Send to My Slack Channel"
|
||||
|
||||
slack {
|
||||
url = <YOUR_SLACK_WEBHOOK_URL>
|
||||
text = <<EOT
|
||||
{{ len .Alerts.Firing }} alerts are firing!
|
||||
slack {
|
||||
url = <YOUR_SLACK_WEBHOOK_URL>
|
||||
text = <<EOT
|
||||
{{ len .Alerts.Firing }} alerts are firing!
|
||||
|
||||
Alert summaries:
|
||||
{{ range .Alerts.Firing }}
|
||||
{{ template "Alert Instance Template" . }}
|
||||
{{ end }}
|
||||
EOT
|
||||
}
|
||||
}
|
||||
```
|
||||
Alert summaries:
|
||||
{{ range .Alerts.Firing }}
|
||||
{{ template "Alert Instance Template" . }}
|
||||
{{ end }}
|
||||
EOT
|
||||
}
|
||||
}
|
||||
```
|
||||
|
||||
You can create multiple external integrations in a single contact point. Notifications routed to this contact point will be sent to all integrations. This example shows multiple integrations in the same Terraform resource.
|
||||
You can create multiple external integrations in a single contact point. Notifications routed to this contact point will be sent to all integrations. This example shows multiple integrations in the same Terraform resource.
|
||||
|
||||
```
|
||||
resource "grafana_contact_point" "my_multi_contact_point" {
|
||||
name = "Send to Many Places"
|
||||
```
|
||||
resource "grafana_contact_point" "my_multi_contact_point" {
|
||||
name = "Send to Many Places"
|
||||
|
||||
slack {
|
||||
url = "webhook1"
|
||||
...
|
||||
}
|
||||
slack {
|
||||
url = "webhook2"
|
||||
...
|
||||
}
|
||||
teams {
|
||||
...
|
||||
}
|
||||
email {
|
||||
...
|
||||
}
|
||||
}
|
||||
```
|
||||
slack {
|
||||
url = "webhook1"
|
||||
...
|
||||
}
|
||||
slack {
|
||||
url = "webhook2"
|
||||
...
|
||||
}
|
||||
teams {
|
||||
...
|
||||
}
|
||||
email {
|
||||
...
|
||||
}
|
||||
}
|
||||
```
|
||||
|
||||
2. Enter text for your notification in the text field.
|
||||
1. Enter text for your notification in the text field.
|
||||
|
||||
The `text` field supports [Go-style templating](https://pkg.go.dev/text/template). This enables you to manage your Grafana Alerting notification templates directly in Terraform.
|
||||
The `text` field supports [Go-style templating](https://pkg.go.dev/text/template). This enables you to manage your Grafana Alerting notification templates directly in Terraform.
|
||||
|
||||
3. Run the command ‘terraform apply’.
|
||||
1. Run the command `terraform apply`.
|
||||
|
||||
4. Go to the Grafana UI and check the details of your contact point.
|
||||
1. Go to the Grafana UI and check the details of your contact point.
|
||||
|
||||
By default, you cannot edit resources provisioned via Terraform from the UI. This ensures that your alerting stack always stays in sync with your code.
|
||||
1. Click **Test** to verify that the contact point works correctly.
|
||||
|
||||
5. Click **Test** to verify that the contact point works correctly.
|
||||
|
||||
**Note:**
|
||||
### Reuse templates
|
||||
|
||||
You can reuse the same templates across many contact points. In the example above, a shared template ie embedded using the statement `{{ template “Alert Instance Template” . }}`
|
||||
|
||||
@@ -155,196 +158,193 @@ EOT
|
||||
}
|
||||
```
|
||||
|
||||
## Provision notification policies and routing
|
||||
## Import notification policies and routing
|
||||
|
||||
Notification policies tell Grafana how to route alert instances to your contact points. They connect firing alerts to your previously defined contact points using a system of labels and matchers.
|
||||
|
||||
To provision notification policies and routing, complete the following steps.
|
||||
To provision notification policies and routing, refer to the [grafana_notification_policy schema](https://registry.terraform.io/providers/grafana/grafana/latest/docs/resources/notification_policy), and complete the following steps.
|
||||
|
||||
1. Copy this code block into a .tf file on your local machine.
|
||||
{{% admonition type="warning" %}}
|
||||
|
||||
In this example, the alerts are grouped by `alertname`, which means that any notifications coming from alerts which share the same name, are grouped into the same Slack message. You can provide any set of label keys here, or you can use the special label `"..."` to route by all label keys, sending each alert in a separate notification.
|
||||
Since the policy tree is a single resource, provisioning the `grafana_notification_policy` resource will overwrite a policy tree created through any other means.
|
||||
|
||||
If you want to route specific notifications differently, you can add sub-policies. Sub-policies allow you to apply routing to different alerts based on label matching. In this example, we apply a mute timing to all alerts with the label a=b.
|
||||
{{< /admonition >}}
|
||||
|
||||
```HCL
|
||||
resource "grafana_notification_policy" "my_policy" {
|
||||
group_by = ["alertname"]
|
||||
contact_point = grafana_contact_point.my_slack_contact_point.name
|
||||
1. Copy this code block into a `.tf` file on your local machine.
|
||||
|
||||
group_wait = "45s"
|
||||
group_interval = "6m"
|
||||
repeat_interval = "3h"
|
||||
In this example, the alerts are grouped by `alertname`, which means that any notifications coming from alerts which share the same name, are grouped into the same Slack message. You can provide any set of label keys here, or you can use the special label `"..."` to route by all label keys, sending each alert in a separate notification.
|
||||
|
||||
policy {
|
||||
matcher {
|
||||
label = "a"
|
||||
match = "="
|
||||
value = "b"
|
||||
}
|
||||
group_by = ["..."]
|
||||
contact_point = grafana_contact_point.a_different_contact_point.name
|
||||
mute_timings = [grafana_mute_timing.my_mute_timing.name]
|
||||
If you want to route specific notifications differently, you can add sub-policies. Sub-policies allow you to apply routing to different alerts based on label matching. In this example, we apply a mute timing to all alerts with the label a=b.
|
||||
|
||||
policy {
|
||||
matcher {
|
||||
label = "sublabel"
|
||||
match = "="
|
||||
value = "subvalue"
|
||||
}
|
||||
contact_point = grafana_contact_point.a_third_contact_point.name
|
||||
group_by = ["..."]
|
||||
}
|
||||
}
|
||||
}
|
||||
```
|
||||
```HCL
|
||||
resource "grafana_notification_policy" "my_policy" {
|
||||
group_by = ["alertname"]
|
||||
contact_point = grafana_contact_point.my_slack_contact_point.name
|
||||
|
||||
2. In the mute_timings field, link a mute timing to your notification policy.
|
||||
group_wait = "45s"
|
||||
group_interval = "6m"
|
||||
repeat_interval = "3h"
|
||||
|
||||
3. Run the command ‘terraform apply’.
|
||||
policy {
|
||||
matcher {
|
||||
label = "a"
|
||||
match = "="
|
||||
value = "b"
|
||||
}
|
||||
group_by = ["..."]
|
||||
contact_point = grafana_contact_point.a_different_contact_point.name
|
||||
mute_timings = [grafana_mute_timing.my_mute_timing.name]
|
||||
|
||||
4. Go to the Grafana UI and check the details of your notification policy.
|
||||
policy {
|
||||
matcher {
|
||||
label = "sublabel"
|
||||
match = "="
|
||||
value = "subvalue"
|
||||
}
|
||||
contact_point = grafana_contact_point.a_third_contact_point.name
|
||||
group_by = ["..."]
|
||||
}
|
||||
}
|
||||
}
|
||||
```
|
||||
|
||||
**Note:**
|
||||
1. In the mute_timings field, link a mute timing to your notification policy.
|
||||
|
||||
Since the policy tree is a single resource, applying it will overwrite a policy tree created through any other means.
|
||||
1. Run the command `terraform apply`.
|
||||
|
||||
By default, you cannot edit resources provisioned from Terraform from the UI. This ensures that your alerting stack always stays in sync with your code.
|
||||
1. Go to the Grafana UI and check the details of your notification policy.
|
||||
|
||||
5. Click **Test** to verify that the notification point is working correctly.
|
||||
1. Click **Test** to verify that the notification point is working correctly.
|
||||
|
||||
## Provision mute timings
|
||||
## Import mute timings
|
||||
|
||||
Mute timings provide the ability to mute alert notifications for defined time periods.
|
||||
|
||||
To provision mute timings, complete the following steps.
|
||||
To provision mute timings, refer to the [grafana_mute_timing schema](https://registry.terraform.io/providers/grafana/grafana/latest/docs/resources/mute_timing), and complete the following steps.
|
||||
|
||||
1. Copy this code block into a .tf file on your local machine.
|
||||
1. Copy this code block into a `.tf` file on your local machine.
|
||||
|
||||
In this example, alert notifications are muted on weekends.
|
||||
In this example, alert notifications are muted on weekends.
|
||||
|
||||
```HCL
|
||||
resource "grafana_mute_timing" "my_mute_timing" {
|
||||
name = "My Mute Timing"
|
||||
```HCL
|
||||
resource "grafana_mute_timing" "my_mute_timing" {
|
||||
name = "My Mute Timing"
|
||||
|
||||
intervals {
|
||||
times {
|
||||
start = "04:56"
|
||||
end = "14:17"
|
||||
}
|
||||
weekdays = ["saturday", "sunday", "tuesday:thursday"]
|
||||
months = ["january:march", "12"]
|
||||
years = ["2025:2027"]
|
||||
}
|
||||
}
|
||||
```
|
||||
intervals {
|
||||
times {
|
||||
start = "04:56"
|
||||
end = "14:17"
|
||||
}
|
||||
weekdays = ["saturday", "sunday", "tuesday:thursday"]
|
||||
months = ["january:march", "12"]
|
||||
years = ["2025:2027"]
|
||||
}
|
||||
}
|
||||
```
|
||||
|
||||
2. Run the command ‘terraform apply’.
|
||||
3. Go to the Grafana UI and check the details of your mute timing.
|
||||
4. Reference your newly created mute timing in a notification policy using the `mute_timings` field.
|
||||
1. Run the command `terraform apply`.
|
||||
1. Go to the Grafana UI and check the details of your mute timing.
|
||||
1. Reference your newly created mute timing in a notification policy using the `mute_timings` field.
|
||||
This will apply your mute timing to some or all of your notifications.
|
||||
|
||||
**Note:**
|
||||
1. Click **Test** to verify that the mute timing is working correctly.
|
||||
|
||||
By default, you cannot edit resources provisioned from Terraform from the UI. This ensures that your alerting stack always stays in sync with your code.
|
||||
|
||||
5. Click **Test** to verify that the mute timing is working correctly.
|
||||
|
||||
## Provision alert rules
|
||||
## Import alert rules
|
||||
|
||||
[Alert rules][alerting-rules] enable you to alert against any Grafana data source. This can be a data source that you already have configured, or you can [define your data sources in Terraform](https://registry.terraform.io/providers/grafana/grafana/latest/docs/resources/data_source) alongside your alert rules.
|
||||
|
||||
To provision alert rules, complete the following steps.
|
||||
To provision alert rules, refer to the [grafana_rule_group schema](https://registry.terraform.io/providers/grafana/grafana/latest/docs/resources/rule_group), and complete the following steps.
|
||||
|
||||
1. Create a data source to query and a folder to store your rules in.
|
||||
|
||||
In this example, the [TestData][testdata] data source is used.
|
||||
In this example, the [TestData][testdata] data source is used.
|
||||
|
||||
Alerts can be defined against any backend datasource in Grafana.
|
||||
Alerts can be defined against any backend datasource in Grafana.
|
||||
|
||||
```HCL
|
||||
resource "grafana_data_source" "testdata_datasource" {
|
||||
name = "TestData"
|
||||
type = "testdata"
|
||||
}
|
||||
```HCL
|
||||
resource "grafana_data_source" "testdata_datasource" {
|
||||
name = "TestData"
|
||||
type = "testdata"
|
||||
}
|
||||
|
||||
resource "grafana_folder" "rule_folder" {
|
||||
title = "My Rule Folder"
|
||||
}
|
||||
```
|
||||
resource "grafana_folder" "rule_folder" {
|
||||
title = "My Rule Folder"
|
||||
}
|
||||
```
|
||||
|
||||
2. Define an alert rule.
|
||||
1. Define an alert rule.
|
||||
|
||||
For more information on alert rules, refer to [how to create Grafana-managed alerts](/blog/2022/08/01/grafana-alerting-video-how-to-create-alerts-in-grafana-9/).
|
||||
For more information on alert rules, refer to [how to create Grafana-managed alerts](/blog/2022/08/01/grafana-alerting-video-how-to-create-alerts-in-grafana-9/).
|
||||
|
||||
3. Create a rule group containing one or more rules.
|
||||
1. Create a rule group containing one or more rules.
|
||||
|
||||
In this example, the `grafana_rule_group` resource group is used.
|
||||
In this example, the `grafana_rule_group` resource group is used.
|
||||
|
||||
```HCL
|
||||
resource "grafana_rule_group" "my_rule_group" {
|
||||
name = "My Alert Rules"
|
||||
folder_uid = grafana_folder.rule_folder.uid
|
||||
interval_seconds = 60
|
||||
org_id = 1
|
||||
```HCL
|
||||
resource "grafana_rule_group" "my_rule_group" {
|
||||
name = "My Alert Rules"
|
||||
folder_uid = grafana_folder.rule_folder.uid
|
||||
interval_seconds = 60
|
||||
org_id = 1
|
||||
|
||||
rule {
|
||||
name = "My Random Walk Alert"
|
||||
condition = "C"
|
||||
for = "0s"
|
||||
rule {
|
||||
name = "My Random Walk Alert"
|
||||
condition = "C"
|
||||
for = "0s"
|
||||
|
||||
// Query the datasource.
|
||||
data {
|
||||
ref_id = "A"
|
||||
relative_time_range {
|
||||
from = 600
|
||||
to = 0
|
||||
}
|
||||
datasource_uid = grafana_data_source.testdata_datasource.uid
|
||||
// `model` is a JSON blob that sends datasource-specific data.
|
||||
// It's different for every datasource. The alert's query is defined here.
|
||||
model = jsonencode({
|
||||
intervalMs = 1000
|
||||
maxDataPoints = 43200
|
||||
refId = "A"
|
||||
})
|
||||
}
|
||||
|
||||
// The query was configured to obtain data from the last 60 seconds. Let's alert on the average value of that series using a Reduce stage.
|
||||
data {
|
||||
datasource_uid = "__expr__"
|
||||
// You can also create a rule in the UI, then GET that rule to obtain the JSON.
|
||||
// This can be helpful when using more complex reduce expressions.
|
||||
model = <<EOT
|
||||
{"conditions":[{"evaluator":{"params":[0,0],"type":"gt"},"operator":{"type":"and"},"query":{"params":["A"]},"reducer":{"params":[],"type":"last"},"type":"avg"}],"datasource":{"name":"Expression","type":"__expr__","uid":"__expr__"},"expression":"A","hide":false,"intervalMs":1000,"maxDataPoints":43200,"reducer":"last","refId":"B","type":"reduce"}
|
||||
EOT
|
||||
ref_id = "B"
|
||||
relative_time_range {
|
||||
from = 0
|
||||
to = 0
|
||||
}
|
||||
}
|
||||
|
||||
// Now, let's use a math expression as our threshold.
|
||||
// We want to alert when the value of stage "B" above exceeds 70.
|
||||
data {
|
||||
datasource_uid = "__expr__"
|
||||
ref_id = "C"
|
||||
relative_time_range {
|
||||
from = 0
|
||||
to = 0
|
||||
}
|
||||
model = jsonencode({
|
||||
expression = "$B > 70"
|
||||
type = "math"
|
||||
refId = "C"
|
||||
})
|
||||
}
|
||||
}
|
||||
}
|
||||
```
|
||||
|
||||
4. Go to the Grafana UI and check your alert rule.
|
||||
1. Run the command `terraform apply`.
|
||||
1. Go to the Grafana UI and check your alert rule.
|
||||
|
||||
You can see whether or not the alert rule is firing. You can also see a visualization of each of the alert rule’s query stages
|
||||
|
||||
@@ -352,16 +352,40 @@ When the alert fires, Grafana routes a notification through the policy you defin
|
||||
|
||||
For example, if you chose Slack as a contact point, Grafana’s embedded [Alertmanager](https://github.com/prometheus/alertmanager) automatically posts a message to Slack.
|
||||
|
||||
## Edit provisioned resources in the Grafana UI
|
||||
|
||||
By default, you cannot edit resources provisioned via Terraform in Grafana. To enable editing these resources in the Grafana UI, use the `disable_provenance` attribute on alerting resources:
|
||||
|
||||
```HCL
|
||||
provider "grafana" {
|
||||
url = "http://grafana.example.com/"
|
||||
auth = var.grafana_auth
|
||||
}
|
||||
|
||||
resource "grafana_mute_timing" "mute_all" {
|
||||
name = "mute all"
|
||||
disable_provenance = true
|
||||
intervals {}
|
||||
}
|
||||
```
|
||||
|
||||
**Useful Links:**
|
||||
|
||||
[Grafana Terraform Provider documentation](https://registry.terraform.io/providers/grafana/grafana/latest/docs)
|
||||
|
||||
{{% docs/reference %}}
|
||||
[alerting-rules]: "/docs/grafana/ -> /docs/grafana/<GRAFANA VERSION>/alerting/alerting-rules"
|
||||
[alerting-rules]: "/docs/grafana/ -> /docs/grafana/<GRAFANA_VERSION>/alerting/alerting-rules"
|
||||
[alerting-rules]: "/docs/grafana-cloud/ -> /docs/grafana-cloud/alerting-and-irm/alerting/alerting-rules"
|
||||
|
||||
[api-keys]: "/docs/grafana/ -> /docs/grafana/<GRAFANA VERSION>/administration/api-keys"
|
||||
[api-keys]: "/docs/grafana-cloud/ -> /docs/grafana/<GRAFANA VERSION>/administration/api-keys"
|
||||
[alerting_export]: "/docs/grafana/ -> /docs/grafana/<GRAFANA_VERSION>/alerting/set-up/provision-alerting-resources/export-alerting-resources"
|
||||
[alerting_export]: "/docs/grafana-cloud/ -> /docs/grafana/<GRAFANA_VERSION>/alerting/set-up/provision-alerting-resources/export-alerting-resources"
|
||||
|
||||
[service-accounts]: "/docs/grafana/ -> /docs/grafana/<GRAFANA VERSION>/administration/service-accounts"
|
||||
[service-accounts]: "/docs/grafana-cloud/ -> /docs/grafana/<GRAFANA VERSION>/administration/service-accounts"
|
||||
[alerting_http_provisioning]: "/docs/grafana/ -> /docs/grafana/<GRAFANA_VERSION>/alerting/set-up/provision-alerting-resources/http-api-provisioning"
|
||||
[alerting_http_provisioning]: "/docs/grafana-cloud/ -> /docs/grafana/<GRAFANA_VERSION>/alerting/set-up/provision-alerting-resources/http-api-provisioning"
|
||||
|
||||
[testdata]: "/docs/grafana/ -> /docs/grafana/<GRAFANA VERSION>/datasources/testdata"
|
||||
[testdata]: "/docs/grafana-cloud/ -> /docs/grafana/<GRAFANA VERSION>/datasources/testdata"
|
||||
[service-accounts]: "/docs/grafana/ -> /docs/grafana/<GRAFANA_VERSION>/administration/service-accounts"
|
||||
[service-accounts]: "/docs/grafana-cloud/ -> /docs/grafana/<GRAFANA_VERSION>/administration/service-accounts"
|
||||
|
||||
[testdata]: "/docs/grafana/ -> /docs/grafana/<GRAFANA_VERSION>/datasources/testdata"
|
||||
[testdata]: "/docs/grafana-cloud/ -> /docs/grafana/<GRAFANA_VERSION>/datasources/testdata"
|
||||
{{% /docs/reference %}}
|
||||
|
||||
@@ -1,105 +0,0 @@
|
||||
---
|
||||
aliases:
|
||||
- ../../provision-alerting-resources/view-provisioned-resources/
|
||||
canonical: https://grafana.com/docs/grafana/latest/alerting/set-up/provision-alerting-resources/view-provisioned-resources/
|
||||
description: Manage provisioned alerting resources in Grafana
|
||||
keywords:
|
||||
- grafana
|
||||
- alerting
|
||||
- alerting resources
|
||||
- provisioning
|
||||
labels:
|
||||
products:
|
||||
- cloud
|
||||
- enterprise
|
||||
- oss
|
||||
menuTitle: Manage provisioned resources in Grafana
|
||||
title: Manage provisioned alerting resources in Grafana
|
||||
weight: 300
|
||||
---
|
||||
|
||||
# Manage provisioned alerting resources in Grafana
|
||||
|
||||
Verify that your alerting resources were created in Grafana, as well as edit or export your provisioned alerting resources.
|
||||
|
||||
## View provisioned alerting resoureces
|
||||
|
||||
To view your provisioned resources in Grafana, complete the following steps.
|
||||
|
||||
1. Open your Grafana instance.
|
||||
1. Navigate to Alerting.
|
||||
1. Click an alerting resource folder, for example, Alert rules.
|
||||
|
||||
Provisioned resources are labeled **Provisioned**, so that it is clear that they were not created manually.
|
||||
|
||||
## Export provisioned alerting resources
|
||||
|
||||
Export your alerting resources, such as alert rules, contact points, and notification policies in JSON, YAML, or Terraform format. You can export all Grafana-managed alert rules, single folders, and single groups.
|
||||
|
||||
To export provisioned alerting resources from the Grafana UI, complete the following steps.
|
||||
|
||||
1. Click **Alerts & IRM** -> **Alert rules**.
|
||||
1. To export all Grafana-managed rules, click **More v** -> **Export all Grafana-managed rules**.
|
||||
1. To export a folder, change the **View as** to **List**.
|
||||
1. Select the folder you want to export and click the **Export rules folder** icon.
|
||||
1. To export a group, change the **View as** to **Grouped**.
|
||||
1. Find the group you want to export and click the **Export rule group** icon.
|
||||
1. Choose the format to export in.
|
||||
|
||||
Note that formats JSON and YAML are suitable only for file provisioning. To get rule definition in provisioning API format, use the provisioning GET API.
|
||||
|
||||
1. Click **Copy Code** or **Download**.
|
||||
1. Choose **Copy Code** to go to an existing file and paste in the code.
|
||||
1. Choose **Download** to download a file with the exported data.
|
||||
|
||||
## Edit provisioned alert rules
|
||||
|
||||
Use the **Modify export** mode for alert rules to edit provisioned alert rules and export a modified version.
|
||||
|
||||
{{% admonition type="note" %}} This feature is for Grafana-managed alert rules only. It is available to Admin, Viewer, and Editor roles. {{% /admonition %}}
|
||||
|
||||
To edit provisioned alerting alert rules from the Grafana UI, complete the following steps.
|
||||
|
||||
1. Click **Alerts & IRM** -> **Alert rules**.
|
||||
1. Locate the alert rule you want to edit and click **More** -> **Modify Export** to open the Alert Rule form.
|
||||
1. From the Alert Rule form, edit the fields you want to change.
|
||||
1. Click **Export** to export all alert rules within the group.
|
||||
|
||||
You can only export groups of rules; not single rules.
|
||||
The exported rule data appears in different formats - HTML, JSON, Terraform.
|
||||
|
||||
1. Choose the format to export in.
|
||||
1. Click **Copy Code** or **Download**.
|
||||
|
||||
a. Choose **Copy Code** to go to an existing file and paste in the code.
|
||||
|
||||
b. Choose **Download** to download a file with the exported data.
|
||||
|
||||
## Edit API-provisioned alerting resources
|
||||
|
||||
To enable editing of API-provisioned resources in the Grafana UI, add the `X-Disable-Provenance` header to the following requests in the API:
|
||||
|
||||
- `POST /api/v1/provisioning/alert-rules`
|
||||
- `PUT /api/v1/provisioning/folder/{FolderUID}/rule-groups/{Group}` (calling this endpoint will change provenance for all alert rules within the alert group)
|
||||
- `POST /api/v1/provisioning/contact-points`
|
||||
- `POST /api/v1/provisioning/mute-timings`
|
||||
- `PUT /api/v1/provisioning/policies`
|
||||
- `PUT /api/v1/provisioning/templates/{name}`
|
||||
|
||||
To reset the notification policy tree to the default and unlock it for editing in the Grafana UI, use the `DELETE /api/v1/provisioning/policies` endpoint.
|
||||
|
||||
To pass the `X-Disable-Provenance` header from Terraform, add it to the `http_headers` field on the provider object:
|
||||
|
||||
```
|
||||
provider "grafana" {
|
||||
url = "http://grafana.example.com/"
|
||||
auth = var.grafana_auth
|
||||
http_headers = {
|
||||
"X-Disable-Provenance" = "true"
|
||||
}
|
||||
}
|
||||
```
|
||||
|
||||
**Note:**
|
||||
|
||||
You cannot edit provisioned resources from files in Grafana. You can only change the resource properties by changing the provisioning file and restarting Grafana or carrying out a hot reload. This prevents changes being made to the resource that would be overwritten if a file is provisioned again or a hot reload is carried out.
|
||||
77
docs/sources/breaking-changes/breaking-changes-v10-3.md
Normal file
77
docs/sources/breaking-changes/breaking-changes-v10-3.md
Normal file
@@ -0,0 +1,77 @@
|
||||
---
|
||||
description: Breaking changes for Grafana v10.3
|
||||
keywords:
|
||||
- grafana
|
||||
- breaking changes
|
||||
- documentation
|
||||
- '10.3'
|
||||
- '10.2.3'
|
||||
- release notes
|
||||
labels:
|
||||
products:
|
||||
- cloud
|
||||
- enterprise
|
||||
- oss
|
||||
title: Breaking changes in Grafana v10.3
|
||||
weight: -2
|
||||
---
|
||||
|
||||
# Breaking changes in Grafana v10.3
|
||||
|
||||
Following are breaking changes that you should be aware of when upgrading to Grafana v10.3. Breaking changes that were introduced in release 10.2.3 are also included here and are marked with an asterisk.
|
||||
|
||||
For our purposes, a breaking change is any change that requires users or operators to do something. This includes:
|
||||
|
||||
- Changes in one part of the system that could cause other components to fail
|
||||
- Deprecations or removal of a feature
|
||||
- Changes to an API that could break automation
|
||||
- Changes that affect some plugins or functions of Grafana
|
||||
- Migrations that can’t be rolled back
|
||||
|
||||
For each change, the provided information:
|
||||
|
||||
- Helps you determine if you’re affected
|
||||
- Describes the change or relevant background information
|
||||
- Guides you in how to mitigate for the change or migrate
|
||||
- Provides more learning resources
|
||||
|
||||
For release highlights and deprecations, refer to our [v10.3 What’s new](https://grafana.com/docs/grafana/<GRAFANA_VERSION>/whatsnew/whats-new-in-v10-3/). For the specific steps we recommend when you upgrade to v10.3, check out our [Upgrade guide](https://grafana.com/docs/grafana/<GRAFANA_VERSION>/upgrade-guide/upgrade-v10.3/).
|
||||
|
||||
<!--
|
||||
## Feature
|
||||
|
||||
You must use relative references when linking to docs within the Grafana repo. Please do not use absolute URLs. For more information about relrefs, refer to [Links and references](/docs/writers-toolkit/writing-guide/references/).-->
|
||||
|
||||
## General breaking changes
|
||||
|
||||
### Transformations\*
|
||||
|
||||
In panels using the extract fields transformation, where one of the extracted names collides with one of the already existing fields, the extracted field will be renamed. Issue [#77569](https://github.com/grafana/grafana/issues/77569).
|
||||
|
||||
If you use the Table visualization, you might see some inconsistencies in your panels. We have updated the table column naming. This will potentially affect field transformations and/or field overrides. To resolve this, either:
|
||||
|
||||
- Update the transformation you are using
|
||||
- Update field override. Issue [#76899](https://github.com/grafana/grafana/issues/76899).
|
||||
|
||||
Users who have transformations with the Time field might see their transformations are not working. Those panels that have broken transformations will fail to render. This is because we changed the field key. See related PR: [#69865](https://github.com/grafana/grafana/pull/69865). To resolve this, either:
|
||||
|
||||
- Remove the affected panel and re-create it
|
||||
- Select the Time field again
|
||||
- Edit the time field as Time for transformation in panel.json or dashboard.json. Issue [#76641](https://github.com/grafana/grafana/issues/76641).
|
||||
|
||||
### Data source permissions\*
|
||||
|
||||
The following data source permission endpoints have been removed:
|
||||
|
||||
- `GET /datasources/:datasourceId/permissions`
|
||||
- `POST /api/datasources/:datasourceId/permissions`
|
||||
- `DELETE /datasources/:datasourceId/permissions`
|
||||
- `POST /datasources/:datasourceId/enable-permissions`
|
||||
- `POST /datasources/:datasourceId/disable-permissions`
|
||||
|
||||
Please use the following endpoints instead:
|
||||
|
||||
- `GET /api/access-control/datasources/:uid` for listing data source permissions
|
||||
- `POST /api/access-control/datasources/:uid/users/:id`, `POST /api/access-control/datasources/:uid/teams/:id`, and `POST /api/access-control/datasources/:uid/buildInRoles/:id` for adding or removing data source permissions
|
||||
|
||||
If you are using the Grafana provider for Terraform to manage data source permissions, you will need to upgrade your provider to [version 2.6.0](https://registry.terraform.io/providers/grafana/grafana/2.6.0/docs) or newer to ensure that data source permission provisioning keeps working. Issue [#5880](https://github.com/grafana/grafana-enterprise/pull/5880).
|
||||
@@ -28,46 +28,50 @@ Before you begin, ensure that you have configured a data source. See also:
|
||||
- [Playlist][]
|
||||
- [Reporting][]
|
||||
- [Version history][]
|
||||
- [Export and import][]
|
||||
- [Import][]
|
||||
- [Export and share][]
|
||||
- [JSON model][]
|
||||
|
||||
{{% docs/reference %}}
|
||||
[data source]: "/docs/grafana/ -> /docs/grafana/<GRAFANA VERSION>/datasources"
|
||||
[data source]: "/docs/grafana-cloud/ -> /docs/grafana/<GRAFANA VERSION>/datasources"
|
||||
[data source]: "/docs/grafana-cloud/ -> /docs/grafana-cloud/connect-externally-hosted/data-sources"
|
||||
|
||||
[Reporting]: "/docs/grafana/ -> /docs/grafana/<GRAFANA VERSION>/dashboards/create-reports"
|
||||
[Reporting]: "/docs/grafana-cloud/ -> /docs/grafana/<GRAFANA VERSION>/dashboards/create-reports"
|
||||
[Reporting]: "/docs/grafana-cloud/ -> /docs/grafana-cloud/visualizations/dashboards/create-reports"
|
||||
|
||||
[Public dashboards]: "/docs/grafana/ -> /docs/grafana/<GRAFANA VERSION>/dashboards/dashboard-public"
|
||||
[Public dashboards]: "/docs/grafana-cloud/ -> /docs/grafana/<GRAFANA VERSION>/dashboards/dashboard-public"
|
||||
[Public dashboards]: "/docs/grafana-cloud/ -> /docs/grafana-cloud/visualizations/dashboards/dashboard-public"
|
||||
|
||||
[Version history]: "/docs/grafana/ -> /docs/grafana/<GRAFANA VERSION>/dashboards/build-dashboards/manage-version-history"
|
||||
[Version history]: "/docs/grafana-cloud/ -> /docs/grafana/<GRAFANA VERSION>/dashboards/build-dashboards/manage-version-history"
|
||||
[Version history]: "/docs/grafana-cloud/ -> /docs/grafana-cloud/visualizations/dashboards/build-dashboards/manage-version-history"
|
||||
|
||||
[panels]: "/docs/grafana/ -> /docs/grafana/<GRAFANA VERSION>/panels-visualizations"
|
||||
[panels]: "/docs/grafana-cloud/ -> /docs/grafana/<GRAFANA VERSION>/panels-visualizations"
|
||||
[panels]: "/docs/grafana-cloud/ -> /docs/grafana-cloud/visualizations/panels-visualizations"
|
||||
|
||||
[Annotations]: "/docs/grafana/ -> /docs/grafana/<GRAFANA VERSION>/dashboards/build-dashboards/annotate-visualizations"
|
||||
[Annotations]: "/docs/grafana-cloud/ -> /docs/grafana/<GRAFANA VERSION>/dashboards/build-dashboards/annotate-visualizations"
|
||||
[Annotations]: "/docs/grafana-cloud/ -> /docs/grafana-cloud/visualizations/dashboards/build-dashboards/annotate-visualizations"
|
||||
|
||||
[Create dashboard folders]: "/docs/grafana/ -> /docs/grafana/<GRAFANA VERSION>/dashboards/manage-dashboards#create-a-dashboard-folder"
|
||||
[Create dashboard folders]: "/docs/grafana-cloud/ -> /docs/grafana/<GRAFANA VERSION>/dashboards/manage-dashboards#create-a-dashboard-folder"
|
||||
[Create dashboard folders]: "/docs/grafana-cloud/ -> /docs/grafana-cloud/visualizations/dashboards/manage-dashboards#create-a-dashboard-folder"
|
||||
|
||||
[JSON model]: "/docs/grafana/ -> /docs/grafana/<GRAFANA VERSION>/dashboards/build-dashboards/view-dashboard-json-model"
|
||||
[JSON model]: "/docs/grafana-cloud/ -> /docs/grafana/<GRAFANA VERSION>/dashboards/build-dashboards/view-dashboard-json-model"
|
||||
[JSON model]: "/docs/grafana-cloud/ -> /docs/grafana-cloud/visualizations/dashboards/build-dashboards/view-dashboard-json-model"
|
||||
|
||||
[Export and import]: "/docs/grafana/ -> /docs/grafana/<GRAFANA VERSION>/dashboards/manage-dashboards#export-and-import-dashboards"
|
||||
[Export and import]: "/docs/grafana-cloud/ -> /docs/grafana/<GRAFANA VERSION>/dashboards/manage-dashboards#export-and-import-dashboards"
|
||||
[Import]: "/docs/grafana/ -> /docs/grafana/<GRAFANA VERSION>/dashboards/build-dashboards/import-dashboards"
|
||||
[Import]: "/docs/grafana-cloud/ -> /docs/grafana-cloud/visualizations/dashboards/build-dashboards/import-dashboards"
|
||||
|
||||
[Export and share]: "/docs/grafana/ -> /docs/grafana/<GRAFANA VERSION>/dashboards/share-dashboards-panels"
|
||||
[Export and share]: "/docs/grafana-cloud/ -> /docs/grafana-cloud/visualizations/dashboards/share-dashboards-panels"
|
||||
|
||||
[Manage dashboards]: "/docs/grafana/ -> /docs/grafana/<GRAFANA VERSION>/dashboards/manage-dashboards"
|
||||
[Manage dashboards]: "/docs/grafana-cloud/ -> /docs/grafana/<GRAFANA VERSION>/dashboards/manage-dashboards"
|
||||
[Manage dashboards]: "/docs/grafana-cloud/ -> /docs/grafana-cloud/visualizations/dashboards/manage-dashboards"
|
||||
|
||||
[Build dashboards]: "/docs/grafana/ -> /docs/grafana/<GRAFANA VERSION>/dashboards/build-dashboards"
|
||||
[Build dashboards]: "/docs/grafana-cloud/ -> /docs/grafana/<GRAFANA VERSION>/dashboards/build-dashboards"
|
||||
[Build dashboards]: "/docs/grafana-cloud/ -> /docs/grafana-cloud/visualizations/dashboards/build-dashboards"
|
||||
|
||||
[Use dashboards]: "/docs/grafana/ -> /docs/grafana/<GRAFANA VERSION>/dashboards/use-dashboards"
|
||||
[Use dashboards]: "/docs/grafana-cloud/ -> /docs/grafana/<GRAFANA VERSION>/dashboards/use-dashboards"
|
||||
[Use dashboards]: "/docs/grafana-cloud/ -> /docs/grafana-cloud/visualizations/dashboards/use-dashboards"
|
||||
|
||||
[Playlist]: "/docs/grafana/ -> /docs/grafana/<GRAFANA VERSION>/dashboards/create-manage-playlists"
|
||||
[Playlist]: "/docs/grafana-cloud/ -> /docs/grafana/<GRAFANA VERSION>/dashboards/create-manage-playlists"
|
||||
[Playlist]: "/docs/grafana-cloud/ -> /docs/grafana-cloud/visualizations/dashboards/create-manage-playlists"
|
||||
{{% /docs/reference %}}
|
||||
|
||||
@@ -44,7 +44,10 @@ Annotations are supported for the following visualization types:
|
||||
|
||||
Grafana comes with the ability to add annotation events directly from a panel using the [built-in annotation query](#built-in-query) that exists on all dashboards. Annotations that you create this way are stored in Grafana.
|
||||
|
||||
To add annotations directly in the panel, the built-in query must be enabled. Learn more in [Built-in query](#built-in-query)
|
||||
To add annotations directly in the panel:
|
||||
|
||||
- The dashboard must already be saved.
|
||||
- The built-in query must be enabled. Learn more in [Built-in query](#built-in-query).
|
||||
|
||||
### Add an annotation
|
||||
|
||||
@@ -83,6 +86,10 @@ Alternatively, to add an annotation, press Ctrl/Cmd and click the panel, and the
|
||||
|
||||
In the dashboard settings, under **Annotations**, you can add new queries to fetch annotations using any data source, including the built-in data annotation data source. Annotation queries return events that can be visualized as event markers in graphs across the dashboard.
|
||||
|
||||
Check out the video below for a quick tutorial.
|
||||
|
||||
{{< youtube id="2istdJpPj2Y" >}}
|
||||
|
||||
### Add new annotation queries
|
||||
|
||||
To add a new annotation query to a dashboard, take the following steps:
|
||||
|
||||
@@ -14,7 +14,7 @@ labels:
|
||||
- oss
|
||||
menuTitle: Best practices
|
||||
title: Grafana dashboard best practices
|
||||
weight: 100
|
||||
weight: 800
|
||||
---
|
||||
|
||||
# Grafana dashboard best practices
|
||||
|
||||
@@ -95,6 +95,20 @@ Dashboards and panels allow you to show your data in visual form. Each panel nee
|
||||
|
||||
When you add additional panels to the dashboard, you're taken straight to the **Edit panel** view.
|
||||
|
||||
## Copy an existing dashboard
|
||||
|
||||
To copy an existing dashboard, follow these steps:
|
||||
|
||||
1. Click **Dashboards** in the primary menu.
|
||||
1. Open the dashboard to be copied.
|
||||
1. Click **Settings** (gear icon) in the top right of the dashboard.
|
||||
1. Click **Save as** in the top-right corner of the dashboard.
|
||||
1. (Optional) Specify the name, folder, description, and whether or not to copy the original dashboard tags for the copied dashboard.
|
||||
|
||||
By default, the copied dashboard has the same name as the original dashboard with the word "Copy" appended and is located in the same folder.
|
||||
|
||||
1. Click **Save**.
|
||||
|
||||
## Configure repeating rows
|
||||
|
||||
You can configure Grafana to dynamically add panels or rows to a dashboard based on the value of a variable. Variables dynamically change your queries across all rows in a dashboard. For more information about repeating panels, refer to [Configure repeating panels][].
|
||||
|
||||
@@ -0,0 +1,60 @@
|
||||
---
|
||||
aliases:
|
||||
- ../../reference/export_import/ # /docs/grafana/<GRAFANA_VERSION>/reference/export_import/
|
||||
- ../export-import/ # /docs/grafana/<GRAFANA_VERSION>/dashboards/export-import/
|
||||
canonical: https://grafana.com/docs/grafana/latest/dashboards/build-dashboards/import-dashboards/
|
||||
keywords:
|
||||
- grafana
|
||||
- dashboard
|
||||
- import
|
||||
labels:
|
||||
products:
|
||||
- cloud
|
||||
- enterprise
|
||||
- oss
|
||||
menuTitle: Import dashboards
|
||||
title: Import dashboards
|
||||
description: Learn how to import dashboards and about Grafana's preconfigured dashboards
|
||||
weight: 5
|
||||
---
|
||||
|
||||
# Import dashboards
|
||||
|
||||
You can import preconfigured dashboards into your Grafana instance or Cloud stack using the UI or the [HTTP API][].
|
||||
|
||||
## Import a dashboard
|
||||
|
||||
To import a dashboard, follow these steps:
|
||||
|
||||
1. Click **Dashboards** in the primary menu.
|
||||
1. Click **New** and select **Import** in the drop-down menu.
|
||||
1. Perform one of the following steps:
|
||||
|
||||
- Upload a dashboard JSON file.
|
||||
- Paste a [Grafana.com dashboard](#discover-dashboards-on-grafanacom) URL or ID into the field provided.
|
||||
- Paste dashboard JSON text directly into the text area.
|
||||
|
||||
1. (Optional) Change the dashboard name, folder, or UID, and specify metric prefixes, if the dashboard uses any.
|
||||
1. Select a data source, if required.
|
||||
1. Click **Import**.
|
||||
1. Save the dashboard.
|
||||
|
||||
## Discover dashboards on grafana.com
|
||||
|
||||
The [Dashboards page](https://grafana.com/grafana/dashboards/) on grafana.com provides you with dashboards for common server applications. Browse our library of official and community-built dashboards and import them to quickly get up and running.
|
||||
|
||||
{{< figure src="/media/docs/grafana/dashboards/screenshot-gcom-dashboards.png" alt="Preconfigured dashboards on grafana.com">}}
|
||||
|
||||
You can also add to this library by exporting one of your own dashboards. For more information, refer to [Share dashboards and panels][].
|
||||
|
||||
## More examples
|
||||
|
||||
Your Grafana Cloud stack comes with several default dashboards in the **Grafana Cloud** folder in **Dashboards**. If you're running your own installation of Grafana, you can find more example dashboards in the `public/dashboards/` directory.
|
||||
|
||||
{{% docs/reference %}}
|
||||
[HTTP API]: "/docs/grafana/ -> /docs/grafana/<GRAFANA VERSION>/developers/http_api"
|
||||
[HTTP API]: "/docs/grafana-cloud/ -> /docs/grafana-cloud/developer-resources/api-reference/http-api"
|
||||
|
||||
[Share dashboards and panels]: "/docs/grafana/ -> /docs/grafana/<GRAFANA VERSION>/dashboards/share-dashboards-panels"
|
||||
[Share dashboards and panels]: "/docs/grafana-cloud/ -> /docs/grafana-cloud/visualizations/dashboards/share-dashboards-panels"
|
||||
{{% /docs/reference %}}
|
||||
@@ -107,10 +107,16 @@ You can include dynamic dashboards with panels or rows, set to repeat by a varia
|
||||
|
||||
By default, reports use the saved time range of the dashboard. You can change the time range of the report by:
|
||||
|
||||
- Saving a modified time range to the dashboard.
|
||||
- Saving a modified time range to the dashboard. Changing the dashboard time range without saving it doesn't change the time zone of the report.
|
||||
- Setting a time range via the **Time range** field in the report form. If specified, the custom time range overrides the time range from the report's dashboard.
|
||||
|
||||
The page header of the report displays the time range for the dashboard's data queries. Dashboards set to use the browser's time zone use the time zone on the Grafana server.
|
||||
The page header of the report displays the time range for the dashboard's data queries.
|
||||
|
||||
#### Report time zones
|
||||
|
||||
Reports use the time zone of the dashboard from which they’re generated. You can control the time zone for your reports by setting the dashboard to a specific time zone. Note that this affects the display of the dashboard for all users.
|
||||
|
||||
If a dashboard has the **Browser Time** setting, the reports generated from that dashboard use the time zone of the Grafana server. As a result, this time zone might not match the time zone of users creating or receiving the report.
|
||||
|
||||
If the time zone is set differently between your Grafana server and its remote image renderer, then the time ranges in the report might be different between the page header and the time axes in the panels. To avoid this, set the time zone to UTC for dashboards when using a remote renderer. Each dashboard's time zone setting is visible in the [time range controls][].
|
||||
|
||||
@@ -278,8 +284,8 @@ filters = report:debug
|
||||
```
|
||||
|
||||
{{% docs/reference %}}
|
||||
[time range controls]: "/docs/grafana/ -> /docs/grafana/<GRAFANA VERSION>/dashboards/manage-dashboards"
|
||||
[time range controls]: "/docs/grafana-cloud/ -> /docs/grafana/<GRAFANA VERSION>/dashboards/manage-dashboards"
|
||||
[time range controls]: "/docs/grafana/ -> /docs/grafana/<GRAFANA VERSION>/dashboards/use-dashboards#set-dashboard-time-range"
|
||||
[time range controls]: "/docs/grafana-cloud/ -> /docs/grafana-cloud/visualizations/dashboards/use-dashboards#set-dashboard-time-range"
|
||||
|
||||
[image rendering]: "/docs/grafana/ -> /docs/grafana/<GRAFANA VERSION>/setup-grafana/image-rendering"
|
||||
[image rendering]: "/docs/grafana-cloud/ -> /docs/grafana/<GRAFANA VERSION>/setup-grafana/image-rendering"
|
||||
@@ -300,10 +306,10 @@ filters = report:debug
|
||||
[SMTP]: "/docs/grafana-cloud/ -> /docs/grafana/<GRAFANA VERSION>/setup-grafana/configure-grafana#smtp"
|
||||
|
||||
[Repeat panels or rows]: "/docs/grafana/ -> /docs/grafana/<GRAFANA VERSION>/panels-visualizations/configure-panel-options#configure-repeating-rows-or-panels"
|
||||
[Repeat panels or rows]: "/docs/grafana-cloud/ -> /docs/grafana/<GRAFANA VERSION>/panels-visualizations/configure-panel-options#configure-repeating-rows-or-panels"
|
||||
[Repeat panels or rows]: "/docs/grafana-cloud/ -> /docs/grafana-cloud/visualizations/panels-visualizations/configure-panel-options#configure-repeating-rows-or-panels"
|
||||
|
||||
[Templates and variables]: "/docs/grafana/ -> /docs/grafana/<GRAFANA VERSION>/dashboards/variables"
|
||||
[Templates and variables]: "/docs/grafana-cloud/ -> /docs/grafana/<GRAFANA VERSION>/dashboards/variables"
|
||||
[Templates and variables]: "/docs/grafana-cloud/ -> /docs/grafana-cloud/visualizations/dashboards/variables"
|
||||
|
||||
[temp-data-lifetime]: "/docs/grafana/ -> /docs/grafana/<GRAFANA VERSION>/setup-grafana/configure-grafana#temp-data-lifetime"
|
||||
[temp-data-lifetime]: "/docs/grafana-cloud/ -> /docs/grafana/<GRAFANA VERSION>/setup-grafana/configure-grafana#temp-data-lifetime"
|
||||
|
||||
@@ -3,23 +3,15 @@ aliases:
|
||||
- ../features/dashboard/dashboards/
|
||||
- ../panels/working-with-panels/organize-dashboard/
|
||||
- ../reference/dashboard_folders/
|
||||
- ../reference/export_import/
|
||||
- ../reference/timerange/
|
||||
- ../troubleshooting/troubleshoot-dashboards/
|
||||
- dashboard-folders/
|
||||
- dashboard-manage/
|
||||
- export-import/
|
||||
canonical: https://grafana.com/docs/grafana/latest/dashboards/manage-dashboards/
|
||||
keywords:
|
||||
- grafana
|
||||
- dashboard
|
||||
- dashboard folders
|
||||
- folder
|
||||
- folders
|
||||
- import
|
||||
- export
|
||||
- troubleshoot
|
||||
- time range
|
||||
- scripting
|
||||
labels:
|
||||
products:
|
||||
- cloud
|
||||
@@ -27,34 +19,31 @@ labels:
|
||||
- oss
|
||||
menuTitle: Manage dashboards
|
||||
title: Manage dashboards
|
||||
description: Learn about dashboard folders, generative AI features for dashboards, and troubleshooting
|
||||
description: Learn about dashboard management and generative AI features for dashboards
|
||||
weight: 8
|
||||
---
|
||||
|
||||
# Manage dashboards
|
||||
|
||||
This topic includes techniques you can use to manage your Grafana dashboards, including:
|
||||
On the **Dashboards** page, you can perform dashboard management tasks such as:
|
||||
|
||||
- [Creating and managing dashboard folders](#create-and-manage-dashboard-folders)
|
||||
- [Exporting and importing dashboards](#export-and-import-dashboards)
|
||||
- [Organizing dashboards](#organize-a-dashboard)
|
||||
- [Troubleshooting dashboards](#troubleshoot-dashboards)
|
||||
- [Browsing](#browse-dashboards) and [creating](#create-a-dashboard-folder) dashboard folders
|
||||
- [Managing folder permissions](#folder-permissions)
|
||||
- [Adding generative AI features to dashboards](#set-up-generative-ai-features-for-dashboards)
|
||||
|
||||
For more information about creating dashboards, refer to [Add and organize panels](../add-organize-panels).
|
||||
For more information about creating dashboards, refer to [Build dashboards][].
|
||||
|
||||
## Browse dashboards
|
||||
|
||||
On the **Dashboards** page, you can browse and manage folders and dashboards. This includes the options to:
|
||||
|
||||
- Create folders and dashboards
|
||||
- Create folders and dashboards.
|
||||
- Move dashboards between folders.
|
||||
- Delete multiple dashboards and folders.
|
||||
- Navigate to a folder.
|
||||
- Manage folder permissions. For more information, refer to [Dashboard permissions][].
|
||||
|
||||
{{% admonition type="note" %}}
|
||||
As of Grafana 10.2, there is no longer a special **General** folder. Dashboards without a folder are now shown at the top level alongside folders.
|
||||
{{% /admonition %}}
|
||||
The page lists all the dashboards to which you have access, grouped into folders. Dashboards without a folder are displayed at the top level alongside folders.
|
||||
|
||||
## Create a dashboard folder
|
||||
|
||||
@@ -76,9 +65,9 @@ Alerts can't be placed in folders with slashes (\ /) in the name. If you wish to
|
||||
|
||||
**To edit the name of a folder:**
|
||||
|
||||
1. Click **Dashboards** in the main menu.
|
||||
1. Click **Dashboards** in the primary menu.
|
||||
1. Navigate to the folder by selecting it in the list, or searching for it.
|
||||
1. Click the pencil icon labelled **Edit title** in the header and update the name of the folder.
|
||||
1. Click the **Edit title** icon (pencil) in the header and update the name of the folder.
|
||||
|
||||
The new folder name is automatically saved.
|
||||
|
||||
@@ -88,7 +77,7 @@ You can assign permissions to a folder. Dashboards in the folder inherit any per
|
||||
|
||||
**To modify permissions for a folder:**
|
||||
|
||||
1. Click **Dashboards** in the main menu.
|
||||
1. Click **Dashboards** in the primary menu.
|
||||
1. Navigate to the folder by selecting it in the list, or searching for it.
|
||||
1. On the folder's page, click **Folder actions** and select **Manage permissions** in the drop-down.
|
||||
1. Update the permissions as desired.
|
||||
@@ -97,49 +86,6 @@ Changes are saved automatically.
|
||||
|
||||
For more information about dashboard permissions, refer to [Dashboard permissions][].
|
||||
|
||||
## Export and import dashboards
|
||||
|
||||
You can use the Grafana UI or the [HTTP API][] to export and import dashboards.
|
||||
|
||||
### Export a dashboard
|
||||
|
||||
The dashboard export action creates a Grafana JSON file that contains everything you need, including layout, variables, styles, data sources, queries, and so on, so that you can later import the dashboard.
|
||||
|
||||
1. Click **Dashboards** in the main menu.
|
||||
1. Open the dashboard you want to export.
|
||||
1. Click the **Share** icon in the top navigation bar.
|
||||
1. Click **Export**.
|
||||
|
||||
If you're exporting the dashboard to use in another instance, with different data source UIDs, enable the **Export for sharing externally** switch.
|
||||
|
||||
1. Click **Save to file**.
|
||||
|
||||
Grafana downloads a JSON file to your local machine.
|
||||
|
||||
#### Make a dashboard portable
|
||||
|
||||
If you want to export a dashboard for others to use, you can add template variables for things like a metric prefix (use a constant variable) and server name.
|
||||
|
||||
A template variable of the type `Constant` is automatically hidden in the dashboard, and is also added as a required input when the dashboard is imported.
|
||||
|
||||
### Import a dashboard
|
||||
|
||||
1. Click **Dashboards** in the left-side menu.
|
||||
1. Click **New** and select **Import** in the dropdown menu.
|
||||
1. Perform one of the following steps:
|
||||
|
||||
- Upload a dashboard JSON file
|
||||
- Paste a [Grafana.com](https://grafana.com) dashboard URL
|
||||
- Paste dashboard JSON text directly into the text area
|
||||
|
||||
The import process enables you to change the name of the dashboard, pick the data source you want the dashboard to use, and specify any metric prefixes (if the dashboard uses any).
|
||||
|
||||
### Discover dashboards on grafana.com
|
||||
|
||||
Find dashboards for common server applications at [Grafana.com/dashboards](https://grafana.com/dashboards).
|
||||
|
||||
{{< figure src="/media/docs/grafana/dashboards/screenshot-gcom-dashboards.png" alt="Preconfigured dashboards on grafana.com">}}
|
||||
|
||||
## Set up generative AI features for dashboards
|
||||
|
||||
{{< docs/public-preview product="Generative AI in dashboards" featureFlag="`dashgpt`" >}}
|
||||
@@ -153,56 +99,13 @@ To access these features, enable the `dashgpt` feature toggle. Then install and
|
||||
|
||||
When enabled, the **✨ Auto generate** option displays next to the **Title** and **Description** fields in your panels and dashboards, or when you press the **Save** button.
|
||||
|
||||
## Troubleshoot dashboards
|
||||
|
||||
This section provides information to help you solve common dashboard problems.
|
||||
|
||||
### Dashboard is slow
|
||||
|
||||
- Are you trying to render dozens (or hundreds or thousands) of time-series on a graph? This can cause the browser to lag. Try using functions like `highestMax` (in Graphite) to reduce the returned series.
|
||||
- Sometimes the series names can be very large. This causes larger response sizes. Try using `alias` to reduce the size of the returned series names.
|
||||
- Are you querying many time-series or for a long range of time? Both of these conditions can cause Grafana or your data source to pull in a lot of data, which may slow it down.
|
||||
- It could be high load on your network infrastructure. If the slowness isn't consistent, this may be the problem.
|
||||
|
||||
### Dashboard refresh rate issues
|
||||
|
||||
By default, Grafana queries your data source every 30 seconds. Setting a low refresh rate on your dashboards puts unnecessary stress on the backend. In many cases, querying this frequently isn't necessary because the data isn't being sent to the system such that changes would be seen.
|
||||
|
||||
We recommend the following:
|
||||
|
||||
- Only enable auto-refreshing on dashboards, panels, or variables unless if necessary. Users can refresh their browser manually, or you can set the refresh rate for a time period that makes sense (every ten minutes, every hour, and so on).
|
||||
- If it's required, then set the refresh rate to once a minute. Users can always refresh the dashboard manually.
|
||||
- If your dashboard has a longer time period (such as a week), then you really don't need automated refreshing.
|
||||
|
||||
#### Handling or rendering null data is wrong or confusing
|
||||
|
||||
Some applications publish data intermittently; for example, they only post a metric when an event occurs. By default, Grafana graphs connect lines between the data points. This can be very deceiving.
|
||||
|
||||
In the picture below we've enabled:
|
||||
|
||||
- Points and 3-point radius to highlight where data points are actually present.
|
||||
- **Connect null values\* is set to **Always\*\*.
|
||||
|
||||
{{< figure src="/static/img/docs/troubleshooting/grafana_null_connected.png" max-width="1200px" alt="Graph with null values connected" >}}
|
||||
|
||||
In this graph, we set graph to show bars instead of lines and set the **No value** under **Standard options** to **0**. There is a very big difference in the visuals.
|
||||
|
||||
{{< figure src="/static/img/docs/troubleshooting/grafana_null_zero.png" max-width="1200px" alt="Graph with null values not connected" >}}
|
||||
|
||||
### More examples
|
||||
|
||||
You can find more examples in `public/dashboards/` directory of your Grafana installation.
|
||||
|
||||
{{% docs/reference %}}
|
||||
[Dashboard permissions]: "/docs/grafana/ -> /docs/grafana/<GRAFANA VERSION>/administration/roles-and-permissions#dashboard-permissions"
|
||||
[Dashboard permissions]: "/docs/grafana-cloud/ -> /docs/grafana/<GRAFANA VERSION>/administration/roles-and-permissions#dashboard-permissions"
|
||||
|
||||
[panels]: "/docs/grafana/ -> /docs/grafana/<GRAFANA VERSION>/panels-visualizations"
|
||||
[panels]: "/docs/grafana-cloud/ -> /docs/grafana-cloud/visualizations/panels-visualizations"
|
||||
[Grafana LLM plugin documentation]: "/docs/grafana/ -> /docs/grafana-cloud/alerting-and-irm/machine-learning/configure/llm-plugin"
|
||||
[Grafana LLM plugin documentation]: "/docs/grafana-cloud/ -> /docs/grafana-cloud/alerting-and-irm/machine-learning/configure/llm-plugin"
|
||||
|
||||
[HTTP API]: "/docs/grafana/ -> /docs/grafana/<GRAFANA VERSION>/developers/http_api"
|
||||
[HTTP API]: "/docs/grafana-cloud/ -> /docs/grafana-cloud/developer-resources/api-reference/http-api"
|
||||
|
||||
[Grafana LLM plugin documentation]: "/docs/grafana/ -> /docs/grafana-cloud/alerting-and-irm/machine-learning/llm-plugin"
|
||||
[Grafana LLM plugin documentation]: "/docs/grafana-cloud/ -> /docs/grafana-cloud/alerting-and-irm/machine-learning/llm-plugin"
|
||||
[Build dashboards]: "/docs/grafana/ -> /docs/grafana/<GRAFANA VERSION>/dashboards/build-dashboards"
|
||||
[Build dashboards]: "/docs/grafana-cloud/ -> /docs/grafana-cloud/visualizations/dashboards/build-dashboards"
|
||||
{{% /docs/reference %}}
|
||||
|
||||
@@ -93,9 +93,26 @@ You can publish snapshots to your local instance or to [snapshots.raintank.io](h
|
||||
|
||||
If you created a snapshot by mistake, click **Delete snapshot** to remove the snapshot from your Grafana instance.
|
||||
|
||||
### Dashboard export
|
||||
### Export a dashboard as JSON
|
||||
|
||||
Grafana dashboards can easily be exported and imported. For more information, refer to [Export and import dashboards][].
|
||||
The dashboard export action creates a Grafana JSON file that contains everything you need, including layout, variables, styles, data sources, queries, and so on, so that you can later import the dashboard.
|
||||
|
||||
1. Click **Dashboards** in the main menu.
|
||||
1. Open the dashboard you want to export.
|
||||
1. Click the **Share** icon in the top navigation bar.
|
||||
1. Click **Export**.
|
||||
|
||||
If you're exporting the dashboard to use in another instance, with different data source UIDs, enable the **Export for sharing externally** switch.
|
||||
|
||||
1. Click **Save to file**.
|
||||
|
||||
Grafana downloads a JSON file to your local machine.
|
||||
|
||||
#### Make a dashboard portable
|
||||
|
||||
If you want to export a dashboard for others to use, you can add template variables for things like a metric prefix (use a constant variable) and server name.
|
||||
|
||||
A template variable of the type `Constant` is automatically hidden in the dashboard, and is also added as a required input when the dashboard is imported.
|
||||
|
||||
## Export dashboard as PDF
|
||||
|
||||
@@ -192,9 +209,6 @@ To create a library panel from the **Share Panel** dialog:
|
||||
1. Save the dashboard.
|
||||
|
||||
{{% docs/reference %}}
|
||||
[Export and import dashboards]: "/docs/grafana/ -> /docs/grafana/<GRAFANA VERSION>/dashboards/manage-dashboards#export-and-import-dashboards"
|
||||
[Export and import dashboards]: "/docs/grafana-cloud/ -> /docs/grafana/<GRAFANA VERSION>/dashboards/manage-dashboards#export-and-import-dashboards"
|
||||
|
||||
[Grafana Enterprise]: "/docs/grafana/ -> /docs/grafana/<GRAFANA VERSION>/introduction/grafana-enterprise"
|
||||
[Grafana Enterprise]: "/docs/grafana-cloud/ -> /docs/grafana/<GRAFANA VERSION>/introduction/grafana-enterprise"
|
||||
|
||||
|
||||
58
docs/sources/dashboards/troubleshoot-dashboards/index.md
Normal file
58
docs/sources/dashboards/troubleshoot-dashboards/index.md
Normal file
@@ -0,0 +1,58 @@
|
||||
---
|
||||
aliases:
|
||||
- ../troubleshooting/troubleshoot-dashboards/
|
||||
- ../reference/timerange/
|
||||
canonical: https://grafana.com/docs/grafana/latest/dashboards/troubleshoot-dashboards/
|
||||
keywords:
|
||||
- grafana
|
||||
- dashboard
|
||||
- troubleshoot
|
||||
- time range
|
||||
labels:
|
||||
products:
|
||||
- cloud
|
||||
- enterprise
|
||||
- oss
|
||||
menuTitle: Troubleshoot dashboards
|
||||
title: Troubleshoot dashboards
|
||||
description: Learn how to troubleshoot common dashboard issues
|
||||
weight: 300
|
||||
---
|
||||
|
||||
# Troubleshoot dashboards
|
||||
|
||||
Use the following strategies to help you troubleshoot common dashboard problems.
|
||||
|
||||
## Dashboard is slow
|
||||
|
||||
- Are you trying to render dozens (or hundreds or thousands) of time series on a graph? This can cause the browser to lag. Try using functions like `highestMax` (in Graphite) to reduce the number of returned series.
|
||||
- Sometimes series names can be very large. This causes larger response sizes. Try using `alias` to reduce the size of the returned series names.
|
||||
- Are you querying many time series or a long time range? Both of these conditions can cause Grafana or your data source to pull in a lot of data, which may slow the dashboard down. Try reducing one or both of these.
|
||||
- There could be high load on your network infrastructure. If the slowness isn't consistent, this may be the problem.
|
||||
|
||||
## Dashboard refresh rate issues
|
||||
|
||||
By default, Grafana queries your data source every 30 seconds. However, setting a low refresh rate on your dashboards puts unnecessary stress on the backend. In many cases, querying this frequently isn't necessary because the data source isn't sending data often enough for there to be changes every 30 seconds.
|
||||
|
||||
We recommend the following:
|
||||
|
||||
- Only enable auto-refreshing on dashboards, panels, or variables if necessary. Users can refresh their browser manually.
|
||||
- If you require auto-refreshing, then set the refresh rate to a longer time period that makes sense, such as once a minute, every 10 minutes, or every hour.
|
||||
- Check the time range of your dashboard. If your dashboard has a longer time range, such as a week, then you really don't need automated refreshing and you should disable it.
|
||||
|
||||
## Handling or rendering null data is wrong or confusing
|
||||
|
||||
Some applications publish data intermittently; for example, they only post a metric when an event occurs. By default, Grafana graphs connect lines between the data points, but this can be deceptive.
|
||||
|
||||
The graph in the following image has:
|
||||
|
||||
- Points and 3-point radius enabled to highlight where data points are actually present.
|
||||
- **Connect null values** set to **Always**.
|
||||
|
||||
{{< figure src="/static/img/docs/troubleshooting/grafana_null_connected.png" max-width="1200px" alt="Graph with null values connected" >}}
|
||||
|
||||
The graph in this next image shows bars instead of lines and has the **No value** option under **Standard options** set to **0**.
|
||||
|
||||
{{< figure src="/static/img/docs/troubleshooting/grafana_null_zero.png" max-width="1200px" alt="Graph with null values not connected" >}}
|
||||
|
||||
As you can see, there's a significant difference in the visualizations.
|
||||
@@ -15,6 +15,8 @@ weight: 130
|
||||
|
||||
# Variables
|
||||
|
||||
{{< youtube id="mMUJ3iwIYwc" >}}
|
||||
|
||||
The following topics describe how to add and manage variables in your dashboards:
|
||||
|
||||
{{< section >}}
|
||||
|
||||
@@ -18,6 +18,8 @@ Grafana comes with built-in support for many _data sources_.
|
||||
If you need other data sources, you can also install one of the many data source plugins.
|
||||
If the plugin you need doesn't exist, you can develop a custom plugin.
|
||||
|
||||
{{< youtube id="cqHO0oYW6Ic" >}}
|
||||
|
||||
Each data source comes with a _query editor_,
|
||||
which formulates custom queries according to the source's structure.
|
||||
After you add and configure a data source, you can use it as an input for many operations, including:
|
||||
@@ -30,14 +32,29 @@ This documentation describes how to manage data sources in general,
|
||||
and how to configure or query the built-in data sources.
|
||||
For other data sources, refer to the list of [datasource plugins](/grafana/plugins/).
|
||||
|
||||
To develop a custom plugin, refer to [Build a plugin](/developers/plugin-tools).
|
||||
To develop a custom plugin, refer to [Create a data source plugin](#create-a-data-source-plugin).
|
||||
|
||||
## Manage data sources
|
||||
|
||||
Only users with the [organization administrator role][organization-roles] can add or remove data sources.
|
||||
To access data source management tools in Grafana as an administrator, navigate to **Configuration > Data Sources** in the Grafana sidebar.
|
||||
|
||||
For details on data source management, including instructions on how to add data sources and configure user permissions for queries, refer to the [administration documentation][data-source-management].
|
||||
For details on data source management, including instructions on how configure user permissions for queries, refer to the [administration documentation][data-source-management].
|
||||
|
||||
## Add a data source
|
||||
|
||||
Before you can create your first dashboard, you need to add your data source.
|
||||
|
||||
{{% admonition type="note" %}}
|
||||
Only users with the organization admin role can add data sources.
|
||||
{{% /admonition %}}
|
||||
|
||||
**To add a data source:**
|
||||
|
||||
1. Click **Connections** in the left-side menu.
|
||||
1. Enter the name of a specific data source in the search dialog. You can filter by **Data source** to only see data sources.
|
||||
1. Click the data source you want to add.
|
||||
1. Configure the data source following instructions specific to that data source.
|
||||
|
||||
## Use query editors
|
||||
|
||||
@@ -53,7 +70,7 @@ For example, this video demonstrates the visual Prometheus query builder:
|
||||
|
||||
{{< vimeo 720004179 >}}
|
||||
|
||||
For general information about querying in Grafana, and common options and user interface elements across all query editors, refer to [Query and transform data][query-transform-data] .
|
||||
For general information about querying in Grafana, and common options and user interface elements across all query editors, refer to [Query and transform data][query-transform-data].
|
||||
|
||||
## Special data sources
|
||||
|
||||
@@ -66,6 +83,7 @@ Grafana includes three special data sources:
|
||||
- You can't change an existing query to use the **Mixed** data source.
|
||||
- Grafana Play example: [Mixed data sources](https://play.grafana.org/d/000000100/mixed-datasources?orgId=1)
|
||||
- **Dashboard:** A data source that uses the result set from another panel in the same dashboard. The dashboard data source can use data either directly from the selected panel or from annotations attached to the selected panel.
|
||||
- Grafana Play example: [Panel as Data source](https://play.grafana.org/d/ede8zps8ndb0gc/panel-as-data-source?orgId=1)
|
||||
|
||||
## Built-in core data sources
|
||||
|
||||
@@ -89,6 +107,24 @@ These built-in core data sources are also included in the Grafana documentation:
|
||||
- [Testdata]({{< relref "./testdata" >}})
|
||||
- [Zipkin]({{< relref "./zipkin" >}})
|
||||
|
||||
## Add additional data source plugins
|
||||
|
||||
You can add additional data sources as plugins (that are not available in core Grafana), which you can install or create yourself.
|
||||
|
||||
### Find data source plugins in the plugin catalog
|
||||
|
||||
To view available data source plugins, go to the [plugin catalog](/grafana/plugins/?type=datasource) and select the "Data sources" filter.
|
||||
For details about the plugin catalog, refer to [Plugin management][Plugin-management].
|
||||
|
||||
You can further filter the plugin catalog's results for data sources provided by the Grafana community, Grafana Labs, and partners.
|
||||
If you use [Grafana Enterprise][Grafana-Enterprise], you can also filter by Enterprise-supported plugins.
|
||||
|
||||
For more documentation on a specific data source plugin's features, including its query language and editor, refer to its plugin catalog page.
|
||||
|
||||
### Create a data source plugin
|
||||
|
||||
To build your own data source plugin, refer to the [Build a data source plugin](/developers/plugin-tools/tutorials/build-a-data-source-plugin) tutorial and [Plugin tools](/developers/plugin-tools).
|
||||
|
||||
{{% docs/reference %}}
|
||||
[alerts]: "/docs/grafana/ -> /docs/grafana/<GRAFANA VERSION>/alerting"
|
||||
[alerts]: "/docs/grafana-cloud/ -> /docs/grafana/<GRAFANA VERSION>/alerting"
|
||||
@@ -107,4 +143,10 @@ These built-in core data sources are also included in the Grafana documentation:
|
||||
|
||||
[query-transform-data]: "/docs/grafana/ -> /docs/grafana/<GRAFANA VERSION>/panels-visualizations/query-transform-data"
|
||||
[query-transform-data]: "/docs/grafana-cloud/ -> /docs/grafana/<GRAFANA VERSION>/panels-visualizations/query-transform-data"
|
||||
|
||||
[Plugin-management]: "/docs/grafana/ -> /docs/grafana/<GRAFANA VERSION>/administration/plugin-management"
|
||||
[Plugin-management]: "/docs/grafana-cloud -> /docs/grafana/<GRAFANA VERSION>/administration/plugin-management"
|
||||
|
||||
[Grafana-Enterprise]: "/docs/grafana/ -> /docs/grafana/<GRAFANA VERSION>/introduction/grafana-enterprise"
|
||||
|
||||
{{% /docs/reference %}}
|
||||
|
||||
@@ -159,7 +159,7 @@ To use the Grafana Assume Role:
|
||||
1. Put in a request to Customer Support to enable`awsDatasourcesTempCredentials`.
|
||||
2. Once the feature is enabled, create a new CloudWatch data source (or update an existing one) and select **Grafana Assume Role** as an authentication provider.
|
||||
3. In the AWS Console, create a new IAM role, and under **Trusted entity type**, select **Another AWS account** as the trusted Entity.
|
||||
4. Enter Grafana's account id (displayed in the instructions box on the the **Settings** tab of the CloudWatch data source configuration) and check the **Require external ID** box.
|
||||
4. Enter Grafana's account id (displayed in the instructions box on the **Settings** tab of the CloudWatch data source configuration) and check the **Require external ID** box.
|
||||
5. Enter the external ID specified in the instructions box on the **Settings** tab of the CloudWatch data source configuration in Grafana. This external ID will be unique to your Grafana instance.
|
||||
6. Attach any required permissions you would like Grafana to be able to access on your behalf (for example, CloudWatch Logs and CloudWatch Metrics policies).
|
||||
7. Give the role a name and description, and click **Create role**.
|
||||
|
||||
@@ -90,7 +90,7 @@ For example:
|
||||
| ----------------------------- | ------------------------------------------------------------------------------------------------------ |
|
||||
| `{{ subscriptionid }}` | Replaced with the subscription ID. |
|
||||
| `{{ subscription }}` | Replaced with the subscription name. |
|
||||
| `{{ resourcegroup }}` | Replaced with the the resource group. |
|
||||
| `{{ resourcegroup }}` | Replaced with the resource group. |
|
||||
| `{{ namespace }}` | Replaced with the resource type or namespace, such as `Microsoft.Compute/virtualMachines`. |
|
||||
| `{{ resourcename }}` | Replaced with the resource name. |
|
||||
| `{{ metric }}` | Replaced with the metric name, such as "Percentage CPU". |
|
||||
|
||||
@@ -60,6 +60,7 @@ datasources:
|
||||
access: proxy
|
||||
url: http://localhost:3100
|
||||
jsonData:
|
||||
timeout: 60
|
||||
maxLines: 1000
|
||||
```
|
||||
|
||||
|
||||
@@ -19,7 +19,7 @@ weight: 1300
|
||||
|
||||
# Prometheus data source
|
||||
|
||||
Prometheus is an open-source database that uses an telemetry collector agent to scrape and store metrics used for monitoring and alerting. If you are just getting started with Prometheus, see [What is Prometheus?][intro-to-prometheus].
|
||||
Prometheus is an open-source database that uses a telemetry collector agent to scrape and store metrics used for monitoring and alerting. If you are just getting started with Prometheus, see [What is Prometheus?][intro-to-prometheus].
|
||||
|
||||
Grafana provides native support for Prometheus.
|
||||
For instructions on downloading Prometheus see [Get started with Grafana and Prometheus][get-started-prometheus].
|
||||
|
||||
80
docs/sources/datasources/pyroscope/_index.md
Normal file
80
docs/sources/datasources/pyroscope/_index.md
Normal file
@@ -0,0 +1,80 @@
|
||||
---
|
||||
aliases:
|
||||
- ../features/datasources/phlare/ # /docs/grafana/<GRAFANA_VERSION>/features/datasources/phlare/
|
||||
- ../features/datasources/grafana-pyroscope/ # /docs/grafana/<GRAFANA_VERSION>/features/datasources/grafana-pyroscope/
|
||||
- ../datasources/grafana-pyroscope/ # /docs/grafana/<GRAFANA_VERSION>/datasources/grafana-pyroscope/
|
||||
description: Horizontally-scalable, highly-available, multi-tenant continuous profiling
|
||||
aggregation system. OSS profiling solution from Grafana Labs.
|
||||
keywords:
|
||||
- grafana
|
||||
- phlare
|
||||
- guide
|
||||
- profiling
|
||||
- pyroscope
|
||||
labels:
|
||||
products:
|
||||
- cloud
|
||||
- enterprise
|
||||
- oss
|
||||
title: Grafana Pyroscope
|
||||
weight: 1150
|
||||
---
|
||||
|
||||
# Grafana Pyroscope data source
|
||||
|
||||
Grafana Pyroscope is a horizontally scalable, highly available, multi-tenant, OSS, continuous profiling aggregation system. Add it as a data source, and you are ready to query your profiles in [Explore][explore].
|
||||
|
||||
To learn more about profiling and Pyroscope, refer to the [Introduction to Pyroscope](/docs/pyroscope/introduction/).
|
||||
|
||||
For information on configuring the Pyroscope data source, refer to [Configure the Grafana Pyroscope data source](./configure-pyroscope-data-source).
|
||||
|
||||
## Integrate profiles into dashboards
|
||||
|
||||
Using the Pyroscope data source, you can integrate profiles into your dashboards.
|
||||
In this case, the screenshot shows memory profiles alongside panels for logs and metrics to be able to debug out of memory (OOM) errors alongside the associated logs and metrics.
|
||||
|
||||
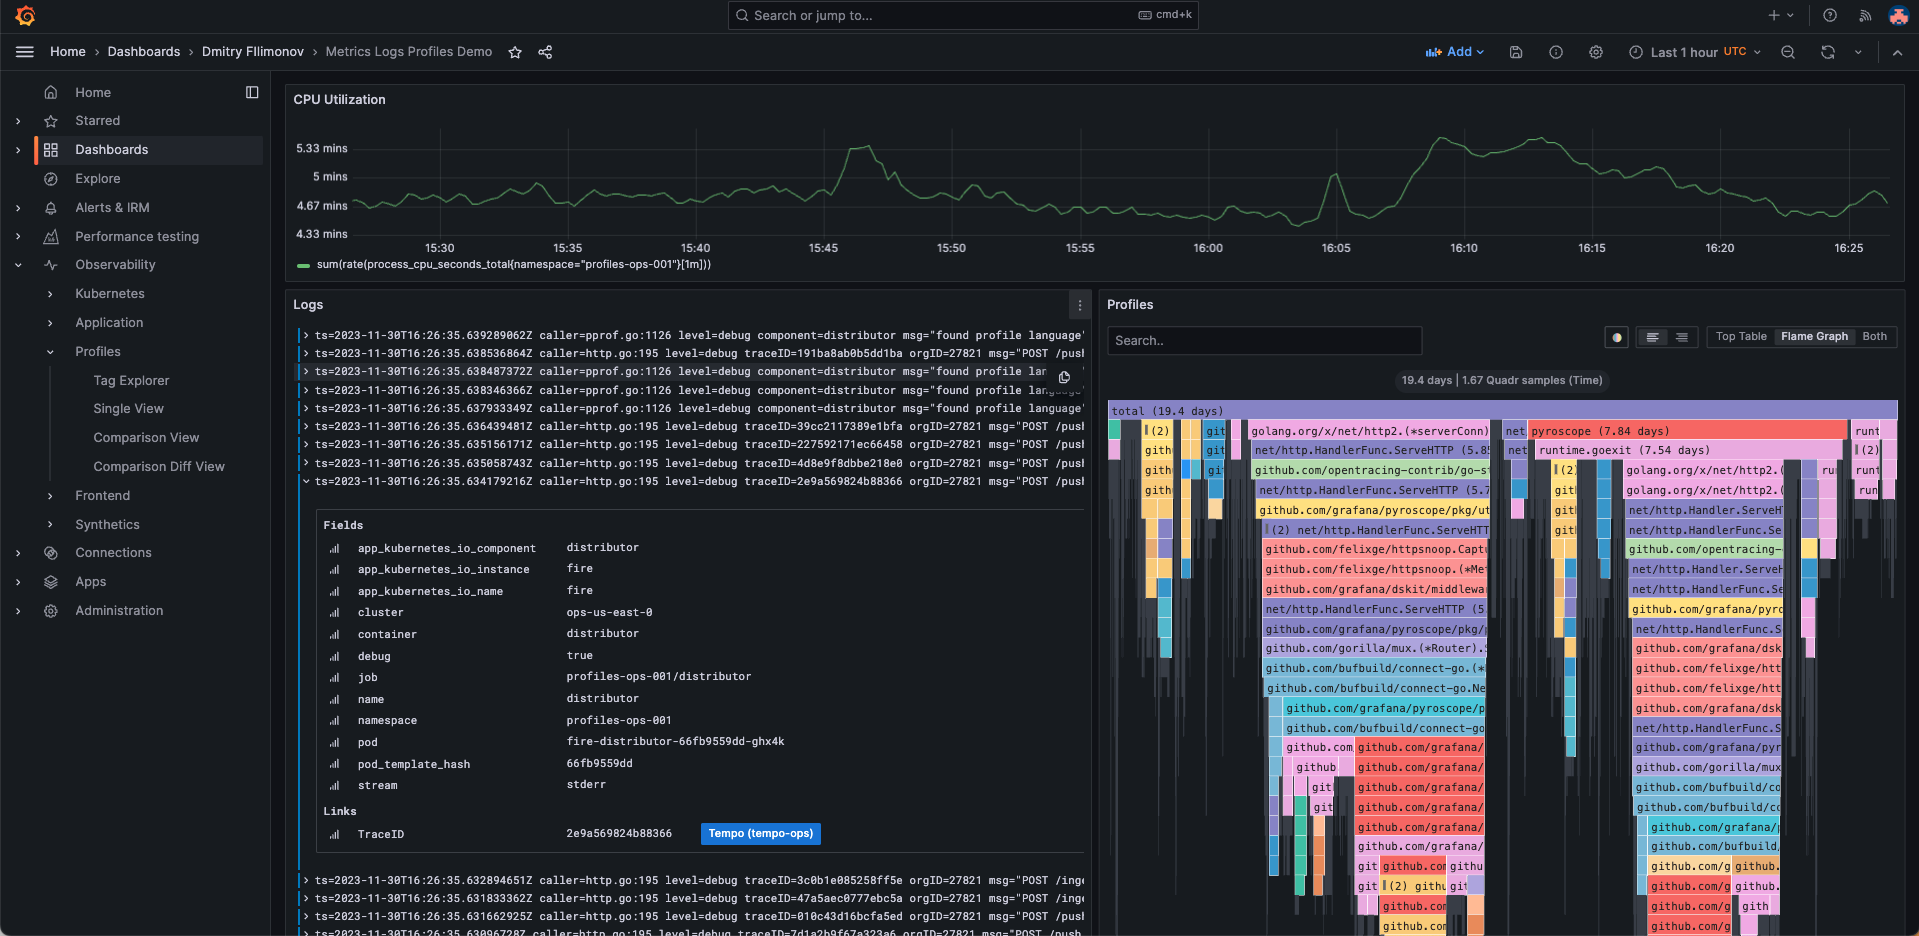
|
||||
|
||||
## Visualize traces and profiles data using Traces to profiles
|
||||
|
||||
You can link profile and tracing data using your Pyroscope data source with the Tempo data source.
|
||||
|
||||
Combined traces and profiles let you see granular line-level detail when available for a trace span. This allows you pinpoint the exact function that's causing a bottleneck in your application as well as a specific request.
|
||||
|
||||
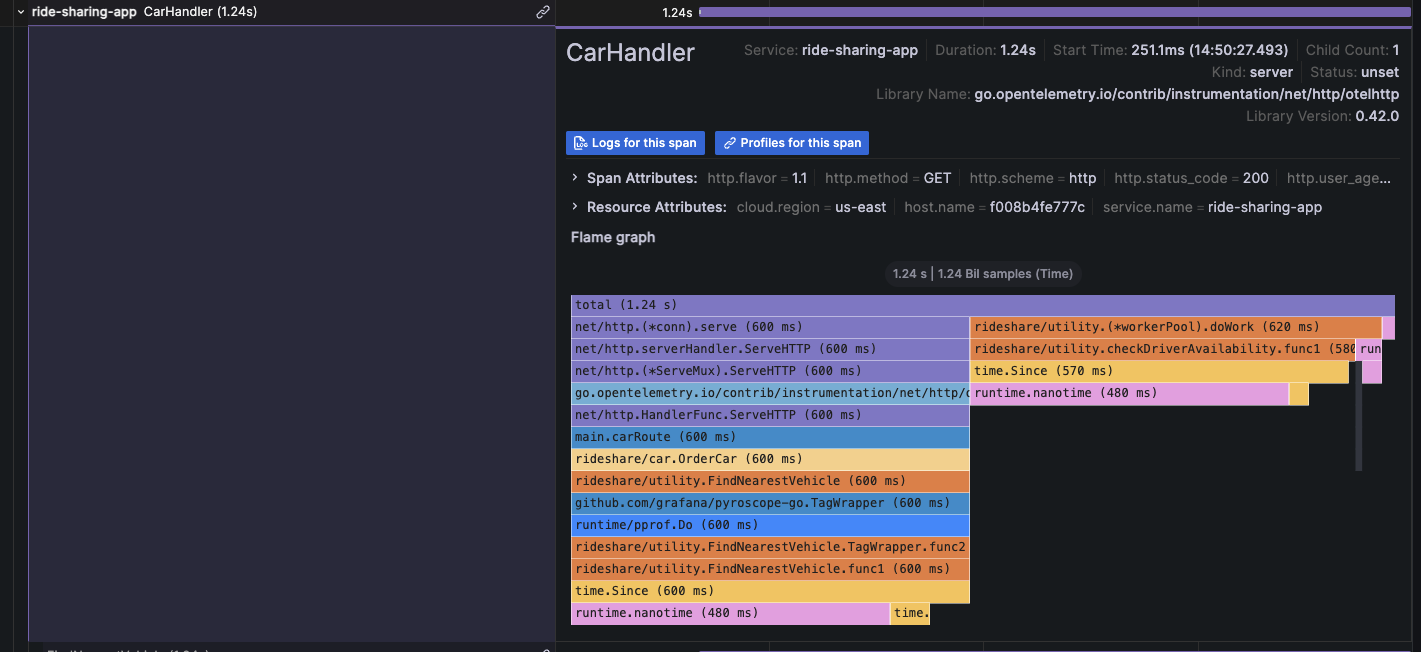
|
||||
|
||||
For more information, refer to the [Traces to profile section][configure-tempo-data-source] of the Tempo data source documentation.
|
||||
|
||||
{{< youtube id="AG8VzfFMLxo" >}}
|
||||
|
||||
## Provision the Grafana Pyroscope data source
|
||||
|
||||
You can modify the Grafana configuration files to provision the Grafana Pyroscope data source.
|
||||
To learn more, and to view the available provisioning settings, refer to [provisioning documentation][provisioning-data-sources].
|
||||
|
||||
Here is an example configuration:
|
||||
|
||||
```yaml
|
||||
apiVersion: 1
|
||||
|
||||
datasources:
|
||||
- name: Grafana Pyroscope
|
||||
type: grafana-pyroscope-datasource
|
||||
url: http://localhost:4040
|
||||
jsonData:
|
||||
minStep: '15s'
|
||||
```
|
||||
|
||||
{{% docs/reference %}}
|
||||
[explore]: "/docs/grafana/ -> /docs/grafana/<GRAFANA VERSION>/explore"
|
||||
[explore]: "/docs/grafana-cloud/ -> /docs/grafana/<GRAFANA VERSION>/explore"
|
||||
|
||||
[flame-graph]: "/docs/grafana/ -> /docs/grafana/<GRAFANA VERSION>/panels-visualizations/visualizations/flame-graph"
|
||||
[flame-graph]: "/docs/grafana-cloud/ -> /docs/grafana/<GRAFANA VERSION>/panels-visualizations/visualizations/flame-graph"
|
||||
|
||||
[provisioning-data-sources]: "/docs/grafana/ -> /docs/grafana/<GRAFANA VERSION>/administration/provisioning#datasources"
|
||||
[provisioning-data-sources]: "/docs/grafana-cloud/ -> /docs/grafana/<GRAFANA VERSION>/administration/provisioning#datasources"
|
||||
|
||||
[configure-tempo-data-source]: "/docs/grafana/ -> /docs/grafana/<GRAFANA VERSION>/datasources/tempo/configure-tempo-data-source"
|
||||
[configure-tempo-data-source]: "/docs/grafana-cloud/ -> docs/grafana-cloud/connect-externally-hosted/data-sources/tempo/configure-tempo-data-source"
|
||||
{{% /docs/reference %}}
|
||||
@@ -1,13 +1,7 @@
|
||||
---
|
||||
aliases:
|
||||
- ../features/datasources/phlare/
|
||||
- ../features/datasources/grafana-pyroscope/
|
||||
description: Horizontally-scalable, highly-available, multi-tenant continuous profiling
|
||||
aggregation system. OSS profiling solution from Grafana Labs.
|
||||
description: Configure your Pyroscope data source for Grafana.
|
||||
keywords:
|
||||
- grafana
|
||||
- phlare
|
||||
- guide
|
||||
- configure
|
||||
- profiling
|
||||
- pyroscope
|
||||
labels:
|
||||
@@ -15,17 +9,14 @@ labels:
|
||||
- cloud
|
||||
- enterprise
|
||||
- oss
|
||||
title: Grafana Pyroscope
|
||||
weight: 1150
|
||||
title: Configure the Grafana Pyroscope data source
|
||||
menuTitle: Configure Pyroscope
|
||||
weight: 200
|
||||
---
|
||||
|
||||
# Grafana Pyroscope data source
|
||||
# Configure the Grafana Pyroscope data source
|
||||
|
||||
Formerly Phlare data source, now Grafana Pyroscope, a horizontally scalable, highly-available, multi-tenant, OSS, continuous profiling aggregation system. Add it as a data source, and you are ready to query your profiles in [Explore][explore].
|
||||
|
||||
## Configure the Grafana Pyroscope data source
|
||||
|
||||
To configure basic settings for the data source, complete the following steps:
|
||||
To configure basic settings for the Pyroscope data source, complete the following steps:
|
||||
|
||||
1. Click **Connections** in the left-side menu.
|
||||
1. Under Your connections, click **Data sources**.
|
||||
@@ -48,7 +39,7 @@ To configure basic settings for the data source, complete the following steps:
|
||||
|
||||
## Querying
|
||||
|
||||
### Query Editor
|
||||
### Query editor
|
||||
|
||||

|
||||
|
||||
82
docs/sources/datasources/pyroscope/query-profile-data.md
Normal file
82
docs/sources/datasources/pyroscope/query-profile-data.md
Normal file
@@ -0,0 +1,82 @@
|
||||
---
|
||||
description: Use the query editor to explore your Pyroscope data.
|
||||
keywords:
|
||||
- query
|
||||
- profiling
|
||||
- pyroscope
|
||||
labels:
|
||||
products:
|
||||
- cloud
|
||||
- enterprise
|
||||
- oss
|
||||
title: Query profile data
|
||||
menuTitle: Query profile data
|
||||
weight: 300
|
||||
---
|
||||
|
||||
# Query profile data
|
||||
|
||||
The Pyroscope data source query editor gives you access to a profile type selector, a label selector, and collapsible options.
|
||||
|
||||

|
||||
|
||||
To access the query editor:
|
||||
|
||||
1. Sign into Grafana or Grafana Cloud.
|
||||
1. Select your Pyroscope data source.
|
||||
1. From the menu, choose **Explore**.
|
||||
|
||||
1. Select a profile type from the drop-down menu.
|
||||
|
||||
{{< figure src="/media/docs/pyroscope/query-editor/select-profile.png" class="docs-image--no-shadow" max-width="450px" caption="Profile selector" >}}
|
||||
|
||||
1. Use the labels selector input to filter by labels. Pyroscope uses similar syntax to Prometheus to filter labels.
|
||||
Refer to [Pyroscope documentation](https://grafana.com/docs/pyroscope/latest/) for available operators and syntax.
|
||||
|
||||
While the label selector can be left empty to query all profiles without filtering by labels, the profile type or app must be selected for the query to be valid.
|
||||
|
||||
Grafana doesn't show any data if the profile type or app isn’t selected when a query runs.
|
||||
|
||||

|
||||
|
||||
1. Expand the **Options** section to view **Query Type** and **Group by**.
|
||||

|
||||
|
||||
1. Select a query type to return the profile data. Data is shown in the [Flame Graph][flame-graph], metric data visualized in a graph, or both. You can only select both options in Explore. The panels used on dashboards allow only one visualization.
|
||||
|
||||
Using **Group by**, you can group metric data by a specified label.
|
||||
Without any **Group by** label, metric data aggregates over all the labels into single time series.
|
||||
You can use multiple labels to group by. Group by only effects the metric data and doesn't change the profile data results.
|
||||
|
||||
## Profiles query results
|
||||
|
||||
Profiles can be visualized in a flame graph.
|
||||
Refer to the [Flame Graph documentation][flame-graph] to learn about the visualization and its features.
|
||||
|
||||

|
||||
|
||||
Pyroscope returns profiles aggregated over a selected time range.
|
||||
The absolute values in the flame graph grow as the time range gets bigger while keeping the relative values meaningful.
|
||||
You can zoom in on the time range to get a higher granularity profile up to the point of a single scrape interval.
|
||||
|
||||
## Metrics query results
|
||||
|
||||
Metrics results represent the aggregated sum value over time of the selected profile type.
|
||||
|
||||

|
||||
|
||||
This allows you to quickly see any spikes in the value of the scraped profiles and zoom in to a particular time range.
|
||||
|
||||
{{% docs/reference %}}
|
||||
[explore]: "/docs/grafana/ -> /docs/grafana/<GRAFANA VERSION>/explore"
|
||||
[explore]: "/docs/grafana-cloud/ -> /docs/grafana/<GRAFANA VERSION>/explore"
|
||||
|
||||
[flame-graph]: "/docs/grafana/ -> /docs/grafana/<GRAFANA VERSION>/panels-visualizations/visualizations/flame-graph"
|
||||
[flame-graph]: "/docs/grafana-cloud/ -> /docs/grafana/<GRAFANA VERSION>/panels-visualizations/visualizations/flame-graph"
|
||||
|
||||
[provisioning-data-sources]: "/docs/grafana/ -> /docs/grafana/<GRAFANA VERSION>/administration/provisioning#datasources"
|
||||
[provisioning-data-sources]: "/docs/grafana-cloud/ -> /docs/grafana/<GRAFANA VERSION>/administration/provisioning#datasources"
|
||||
|
||||
[configure-tempo-data-source]: "/docs/grafana/ -> /docs/grafana/<GRAFANA VERSION>/datasources/tempo/configure-tempo-data-source"
|
||||
[configure-tempo-data-source]: "/docs/grafana-cloud/ -> docs/grafana-cloud/connect-externally-hosted/data-sources/tempo/configure-tempo-data-source"
|
||||
{{% /docs/reference %}}
|
||||
@@ -20,11 +20,11 @@ weight: 1400
|
||||
|
||||
# Tempo data source
|
||||
|
||||
Grafana ships with built-in support for [Tempo](https://grafana.com/docs/tempo/latest/), a high-volume, minimal-dependency trace storage, open-source tracing solution from Grafana Labs. This topic explains configuration and queries specific to the Tempo data source.
|
||||
Grafana ships with built-in support for [Tempo](https://grafana.com/docs/tempo/latest/), a high-volume, minimal-dependency trace storage, open source tracing solution from Grafana Labs. This topic explains configuration and queries specific to the Tempo data source.
|
||||
|
||||
For instructions on how to add a data source to Grafana, refer to the [administration documentation][data-source-management].
|
||||
Only users with the organization administrator role can add data sources.
|
||||
Administrators can also [configure the data source via YAML](#provision-the-data-source) with Grafana's provisioning system.
|
||||
Administrators can also [configure the data source via YAML][configure-tempo-data-source] with Grafana's provisioning system.
|
||||
|
||||
Once you've added the data source, you can [configure it]({{< relref "./configure-tempo-data-source/" >}}) so that your Grafana instance's users can create queries in its [query editor]({{< relref "./query-editor/" >}}) when they [build dashboards][build-dashboards] and use [Explore][explore].
|
||||
|
||||
@@ -37,6 +37,9 @@ Once you've added the data source, you can [configure it]({{< relref "./configur
|
||||
[configure-grafana-feature-toggles]: "/docs/grafana/ -> /docs/grafana/<GRAFANA VERSION>/setup-grafana/configure-grafana#feature_toggles"
|
||||
[configure-grafana-feature-toggles]: "/docs/grafana-cloud/ -> /docs/grafana/<GRAFANA VERSION>/setup-grafana/configure-grafana#feature_toggles"
|
||||
|
||||
[configure-tempo-data-source]: "/docs/grafana/ -> /docs/grafana/<GRAFANA VERSION>/datasources/tempo/configure-tempo-data-source#provision-the-data-source"
|
||||
[configure-tempo-data-source]: "/docs/grafana-cloud/ -> docs/grafana-cloud/connect-externally-hosted/data-sources/tempo/configure-tempo-data-source#provision-the-data-source"
|
||||
|
||||
[data-source-management]: "/docs/grafana/ -> /docs/grafana/<GRAFANA VERSION>/administration/data-source-management"
|
||||
[data-source-management]: "/docs/grafana-cloud/ -> /docs/grafana/<GRAFANA VERSION>/administration/data-source-management"
|
||||
|
||||
|
||||
@@ -55,7 +55,7 @@ There are two ways to configure the trace to logs feature:
|
||||
You can also click **Open advanced data source picker** to see more options, including adding a data source.
|
||||
|
||||
1. Set start and end time shift. As the logs timestamps may not exactly match the timestamps of the spans in trace it may be necessary to search in larger or shifted time range to find the desired logs.
|
||||
1. Select which tags to use in the logs query. The tags you configure must be present in the spans attributes or resources for a trace to logs span link to appear. You can optionally configure a new name for the tag. This is useful for example if the tag has dots in the name and the target data source does not allow using dots in labels. In that case you can for example remap `http.status` to `http_status`.
|
||||
1. Select which tags to use in the logs query. The tags you configure must be present in the span's attributes or resources for a trace to logs span link to appear. You can optionally configure a new name for the tag. This is useful, for example, if the tag has dots in the name and the target data source does not allow using dots in labels. In that case, you can for example remap `http.status` (the span attribute) to `http_status` (the data source field). "Data source" in this context can refer to Loki, or another log data source.
|
||||
1. Optionally switch on the **Filter by trace ID** and/or **Filter by span ID** setting to further filter the logs if your logs consistently contain trace or span IDs.
|
||||
|
||||
### Configure a custom query
|
||||
|
||||
@@ -16,708 +16,193 @@ description: An annotated list of Grafana plugins using AngularJS.
|
||||
|
||||
# Plugins using AngularJS
|
||||
|
||||
The use of AngularJS in Grafana has been [deprecated]({{< relref "../angular_deprecation" >}}) and support for it will be removed in a future release.
|
||||
The use of AngularJS in Grafana has been [deprecated]({{< relref "../angular_deprecation" >}}) in favor of React. Support for AngularJS will be turned off by default in Grafana 11.
|
||||
|
||||
This page is to help users of Grafana understand how they might be impacted by the removal of Angular support, and whether a migration option exists.
|
||||
|
||||
It lists the latest versions of plugins _currently available_ in the Grafana [plugin catalog](https://grafana.com/plugins) which depend on Angular, and will stop working when Angular support is removed from Grafana. The list will be updated as more plugins migrate to React or offer migration advice.
|
||||
|
||||
Plugins which have been [deprecated](/legal/plugin-deprecation/) will _not_ be listed. Generally, we advise users to migrate away from deprecated plugins as they will not be updated and may not function in current or future versions of Grafana.
|
||||
This page explains how Grafana users might be impacted by the removal of Angular support based on plugins dependent on this legacy framework. You will also see if there is a migration option available for a given plugin.
|
||||
|
||||
{{% admonition type="note" %}}
|
||||
We advise you to ensure you are running the latest version of plugins, as previous releases of plugins not listed here may still require AngularJS.
|
||||
We are greatly appreciative of the developers who have contributed plugins to the Grafana ecosystem. Guidance on migrating a plugin to React can be found in our [migration guide](/developers/plugin-tools/migration-guides/migrate-angularjs-to-react).
|
||||
{{% /admonition %}}
|
||||
|
||||
We also list the year in which the plugin was last updated in the catalog and where appropriate, highlight warnings for plugins where the source repository has not been updated in a number of years and appears inactive. This may help indicate the likelihood of a migration being undertaken, but is informational rather than definitive.
|
||||
## What should I do with the list of AngularJS plugins?
|
||||
|
||||
Refer to the [table below](#angularjs-based-plugins) and take the appropriate action for you.
|
||||
|
||||
- Consider the advice on whether to update, migrate to a listed alternative, or explore the Grafana plugins [catalog](/grafana/plugins) to find the most suitable option for your use case.
|
||||
- Use our [detect-angular-dashboards](https://github.com/grafana/detect-angular-dashboards) open source tooling to list dashboards which have a dependency on Angular plugins.
|
||||
- Check your Grafana instances for usage of these plugins. Refer to the documentation on [browsing installed plugins]({{< relref "../../administration/plugin-management/#browse-plugins" >}}).
|
||||
- Customers of Grafana Enterprise and users of Grafana Cloud can also leverage [usage insights]({{< relref "../../dashboards/assess-dashboard-usage/" >}}) to prioritize any migration efforts.
|
||||
- Review the plugin source repositories to add your support to any migration issues or consider forking the repo.
|
||||
|
||||
{{% admonition type="note" %}}
|
||||
Plugins were updated to include signatures in 2021, so whilst a plugin may show as having been updated at that point - the last update to its functionality or dependencies may have been longer ago.
|
||||
{{% /admonition %}}
|
||||
|
||||
## What should I do with the information below?
|
||||
|
||||
- Consider the available migration steps.
|
||||
- Check your Grafana instances for usage of these plugins - see information here on [browsing installed plugins]({{< relref "../../administration/plugin-management/#browse-plugins" >}}).
|
||||
- Review the project repositories to add your support to any migration issues.
|
||||
|
||||
## I'm a plugin author
|
||||
|
||||
We are greatly appreciative of the developers who have contributed plugins to the Grafana ecosystem, your work has helped support millions of users to gain insights into their data. A plugin being listed below is no reflection on its quality, and is purely to help users understand the impact of the removal of Angular support in Grafana.
|
||||
|
||||
Guidance on migrating a plugin to React can be found in our [migration guide](/developers/plugin-tools/migration-guides/migrate-angularjs-to-react). If you would like to add any specific migration guidance for your plugin here or update our assessment, please open a PR by clicking the `Suggest an edit` button at the bottom of this page.
|
||||
|
||||
# Current AngularJS based plugins
|
||||
|
||||
## Apps
|
||||
|
||||
### [Bosun](https://grafana.com/grafana/plugins/bosun-app)
|
||||
|
||||
Latest Version: 0.0.29 | Signature: Community | Last Updated: 2023
|
||||
|
||||
> [Migration issue](https://github.com/bosun-monitor/bosun-grafana-app/issues/63) has been raised.
|
||||
|
||||
### [GLPI](https://grafana.com/grafana/plugins/ddurieux-glpi-app)
|
||||
|
||||
Latest Version: 1.3.1 | Signature: Community | Last Updated: 2021
|
||||
|
||||
> [Migration issue](https://github.com/ddurieux/glpi_app_grafana/issues/96) has been raised.
|
||||
|
||||
### [DevOpsProdigy KubeGraf](https://grafana.com/grafana/plugins/devopsprodigy-kubegraf-app/)
|
||||
|
||||
Latest Version: 1.5.2 | Signature: Community | Last Updated: 2021
|
||||
|
||||
{{% admonition type="warning" %}}
|
||||
[Issues](https://github.com/devopsprodigy/kubegraf/issues/71) in the project repository suggest that the project _may_ be unsupported.
|
||||
{{% /admonition %}}
|
||||
|
||||
> **Migration available - potential alternative:** Grafana Cloud includes a [Kubernetes integration](https://grafana.com/solutions/kubernetes/).
|
||||
|
||||
### [AWS IoT TwinMaker App](https://grafana.com/grafana/plugins/grafana-iot-twinmaker-app)
|
||||
|
||||
Latest Version: 1.6.2 | Signature: Grafana | Last Updated: 2023
|
||||
|
||||
{{% admonition type="note" %}}
|
||||
Plugin should continue to work even if Angular is disabled, and a full removal of Angular related code is planned.
|
||||
{{% /admonition %}}
|
||||
|
||||
### [Stagemonitor Elasticsearch](https://grafana.com/grafana/plugins/stagemonitor-elasticsearch-app)
|
||||
|
||||
Latest Version: 0.83.3 | Signature: Community | Last Updated: 2021
|
||||
|
||||
> [Migration issue](https://github.com/stagemonitor/stagemonitor-grafana-elasticsearch/issues/1) has been raised.
|
||||
|
||||
{{% admonition type="warning" %}}
|
||||
Lack of recent activity in the [project repository](https://github.com/stagemonitor/stagemonitor-grafana-elasticsearch) in the past 4 years suggests project _may_ not be actively maintained.
|
||||
{{% /admonition %}}
|
||||
|
||||
### [Voxter VoIP Platform Metrics](https://grafana.com/grafana/plugins/voxter-app)
|
||||
|
||||
Latest Version: 0.0.2 | Signature: Community | Last Updated: 2021
|
||||
|
||||
{{% admonition type="warning" %}}
|
||||
Lack of recent activity in the [project repository](https://github.com/raintank/voxter-app) in the past 3 years suggests project _may_ not be actively maintained.
|
||||
{{% /admonition %}}
|
||||
|
||||
## Datasources
|
||||
|
||||
### [Akumuli](https://grafana.com/grafana/plugins/akumuli-datasource/)
|
||||
|
||||
Latest Version: 1.3.12 | Signature: Community | Last Updated: 2021
|
||||
|
||||
{{% admonition type="warning" %}}
|
||||
[Issues](https://github.com/akumuli/Akumuli/issues/379) in the project repository suggest that the project _may_ be unsupported.
|
||||
{{% /admonition %}}
|
||||
|
||||
{{% admonition type="warning" %}}
|
||||
Lack of recent activity in the [project repository](https://github.com/akumuli/Akumuli/) in the past 3 years suggests project _may_ not be actively maintained.
|
||||
{{% /admonition %}}
|
||||
|
||||
### [Finance](https://grafana.com/grafana/plugins/ayoungprogrammer-finance-datasource/)
|
||||
|
||||
Latest Version: 1.0.1 | Signature: Community | Last Updated: 2021
|
||||
|
||||
{{% admonition type="warning" %}}
|
||||
[Issues](https://github.com/ayoungprogrammer/grafana-finance/issues/7) in the project repository suggest that the project _may_ be unsupported.
|
||||
{{% /admonition %}}
|
||||
|
||||
{{% admonition type="warning" %}}
|
||||
Lack of recent activity in the [project repository](https://github.com/ayoungprogrammer/grafana-finance) in the past 6 years suggests project _may_ not be actively maintained.
|
||||
{{% /admonition %}}
|
||||
|
||||
### [Chaos Mesh](https://grafana.com/grafana/plugins/chaosmeshorg-datasource/)
|
||||
|
||||
Latest Version: 2.2.3 | Signature: Community | Last Updated: 2022
|
||||
|
||||
{{% admonition type="warning" %}}
|
||||
Lack of recent activity in the [project repository](https://github.com/chaos-mesh/datasource) in the past year suggests project _may_ not be actively maintained.
|
||||
{{% /admonition %}}
|
||||
|
||||
### [DeviceHive](https://grafana.com/grafana/plugins/devicehive-devicehive-datasource/)
|
||||
|
||||
Latest Version: 2.0.2 | Signature: Community | Last Updated: 2021
|
||||
|
||||
{{% admonition type="warning" %}}
|
||||
Lack of recent activity in the [project repository](https://github.com/devicehive/devicehive-grafana-datasource) in the past 5 years suggests project _may_ not be actively maintained.
|
||||
{{% /admonition %}}
|
||||
|
||||
### [Google BigQuery](https://grafana.com/grafana/plugins/doitintl-bigquery-datasource/)
|
||||
|
||||
Latest Version: 2.0.3 | Signature: Community | Last Updated: 2022
|
||||
|
||||
> **Migration available - plugin superseded:** Grafana provides its own [Google BigQuery Plugin](https://grafana.com/grafana/plugins/grafana-bigquery-datasource/). The previous [Project repository](https://github.com/doitintl/bigquery-grafana) was archived on December 11, 2022 with a recommendation to migrate to the aforementioned Grafana provided plugin.
|
||||
|
||||
### [Open-Falcon](https://grafana.com/grafana/plugins/fastweb-openfalcon-datasource/)
|
||||
|
||||
Latest Version: 1.0.1 | Signature: Community | Last Updated: 2021
|
||||
|
||||
{{% admonition type="warning" %}}
|
||||
[Project repository](https://github.com/open-falcon/grafana-openfalcon-datasource) suggests support for Grafana v4.2 - Grafana v5.4.
|
||||
{{% /admonition %}}
|
||||
|
||||
{{% admonition type="warning" %}}
|
||||
Lack of recent activity in the [project repository](https://github.com/open-falcon/grafana-openfalcon-datasource) in the past year suggests project _may_ not be actively maintained.
|
||||
{{% /admonition %}}
|
||||
|
||||
### [GraphQL Data Source](https://grafana.com/grafana/plugins/fifemon-graphql-datasource/)
|
||||
|
||||
Latest Version: 1.3.0 | Signature: Community | Last Updated: 2021
|
||||
|
||||
{{% admonition type="warning" %}}
|
||||
Project support is unclear after a request for new maintainers - [source](https://github.com/fifemon/graphql-datasource/issues/77).
|
||||
{{% /admonition %}}
|
||||
|
||||
> **Migration available - potential alternative:** The [Infinity](https://grafana.com/grafana/plugins/yesoreyeram-infinity-datasource/) data source supports GraphQL.
|
||||
|
||||
### [Cloudera Manager](https://grafana.com/grafana/plugins/foursquare-clouderamanager-datasource/)
|
||||
|
||||
Latest Version: 0.9.3 | Signature: Community | Last Updated: 2021
|
||||
|
||||
{{% admonition type="warning" %}}
|
||||
Lack of recent activity in the [project repository](https://github.com/foursquare/datasource-plugin-clouderamanager) in the past 7 years suggests project _may_ not be actively maintained.
|
||||
{{% /admonition %}}
|
||||
|
||||
### [Simple Annotations](https://grafana.com/grafana/plugins/fzakaria-simple-annotations-datasource/)
|
||||
|
||||
Latest Version: 1.0.1 | Signature: Community | Last Updated: 2021
|
||||
|
||||
{{% admonition type="warning" %}}
|
||||
Plugin only claims support for Grafana v4.x.x.
|
||||
{{% /admonition %}}
|
||||
|
||||
{{% admonition type="warning" %}}
|
||||
Lack of recent activity in the [project repository](https://github.com/fzakaria/simple-annotations-plugin/) in the past 6 years suggests project _may_ not be actively maintained.
|
||||
{{% /admonition %}}
|
||||
|
||||
{{% admonition type="warning" %}}
|
||||
Developer no longer maintains the project, but is open to contributions: https://github.com/fzakaria/simple-annotations-plugin/issues/2
|
||||
{{% /admonition %}}
|
||||
|
||||
### [Gnocchi](https://grafana.com/grafana/plugins/gnocchixyz-gnocchi-datasource/)
|
||||
|
||||
Latest Version: 1.7.1 | Signature: Community | Last Updated: 2021
|
||||
|
||||
{{% admonition type="warning" %}}
|
||||
Plugin only claims support for Grafana v4.x.x
|
||||
{{% /admonition %}}
|
||||
|
||||
{{% admonition type="warning" %}}
|
||||
Lack of recent activity in the [project repository](https://github.com/gnocchixyz/grafana-gnocchi-datasource) in the past 3 years suggests project _may_ not be actively maintained.
|
||||
{{% /admonition %}}
|
||||
|
||||
### [MetaQueries](https://grafana.com/grafana/plugins/goshposh-metaqueries-datasource/)
|
||||
|
||||
Latest Version: 0.0.9 | Signature: Community | Last Updated: 2022
|
||||
|
||||
{{% admonition type="warning" %}}
|
||||
Lack of recent activity in the [project repository](https://github.com/GoshPosh/grafana-meta-queries) in the past year suggests project _may_ not be actively maintained.
|
||||
{{% /admonition %}}
|
||||
|
||||
### [Open Distro for Elasticsearch](https://grafana.com/grafana/plugins/grafana-es-open-distro-datasource/)
|
||||
|
||||
Latest Version: 1.0.6 | Signature: Grafana | Last Updated: 2021
|
||||
|
||||
> **Migration available - plugin superseded:** Plugin was deprecated in favour of the [OpenSearch Plugin](https://grafana.com/grafana/plugins/grafana-opensearch-datasource/).
|
||||
|
||||
### [KairosDB](https://grafana.com/grafana/plugins/grafana-kairosdb-datasource/)
|
||||
|
||||
Latest Version: 3.0.2 | Signature: Grafana | Last Updated: 2021
|
||||
|
||||
{{% admonition type="warning" %}}
|
||||
[Project repository](https://github.com/grafana/kairosdb-datasource) was archived on August 30th, 2021, and is no longer maintained.
|
||||
{{% /admonition %}}
|
||||
|
||||
### [SimpleJson](https://grafana.com/grafana/plugins/grafana-simple-json-datasource/)
|
||||
|
||||
Latest Version: 1.4.2 | Signature: Grafana | Last Updated: 2021
|
||||
|
||||
> **Migration available - potential alternative:** [Project repository](https://github.com/grafana/simple-json-datasource) is no longer maintained, but a number of alternatives exist, including - [Infinity](https://grafana.com/grafana/plugins/yesoreyeram-infinity-datasource/), [JSON](https://grafana.com/grafana/plugins/simpod-json-datasource) and [JSON API](https://grafana.com/grafana/plugins/marcusolsson-json-datasource).
|
||||
|
||||
{{% admonition type="note" %}}
|
||||
If you're looking for an example of a data source plugin to start from, refer to [grafana-starter-datasource-backend](https://github.com/grafana/grafana-starter-datasource-backend).
|
||||
{{% /admonition %}}
|
||||
|
||||
### [openHistorian](https://grafana.com/grafana/plugins/gridprotectionalliance-openhistorian-datasource/)
|
||||
|
||||
Latest Version: 1.0.3 | Signature: Community | Last Updated: 2021
|
||||
|
||||
{{% admonition type="warning" %}}
|
||||
Lack of recent activity in the [project repository](https://github.com/GridProtectionAlliance/openHistorian-grafana/) in the past 2 years suggests project _may_ not be actively maintained.
|
||||
{{% /admonition %}}
|
||||
|
||||
### [Hawkular](https://grafana.com/grafana/plugins/hawkular-datasource/)
|
||||
|
||||
Latest Version: 1.1.2 | Signature: Community | Last Updated: 2021
|
||||
|
||||
{{% admonition type="warning" %}}
|
||||
Lack of recent activity in the [project repository](https://github.com/hawkular/hawkular-grafana-datasource) in the past 5 years suggests project _may_ not be actively maintained.
|
||||
{{% /admonition %}}
|
||||
|
||||
### [PRTG](https://grafana.com/grafana/plugins/jasonlashua-prtg-datasource/)
|
||||
|
||||
Latest Version: 4.0.4 | Signature: Community | Last Updated: 2021
|
||||
|
||||
{{% admonition type="warning" %}}
|
||||
Lack of recent activity in the [project repository](https://github.com/neuralfraud/grafana-prtg) in the past 4 years suggests project _may_ not be actively maintained.
|
||||
{{% /admonition %}}
|
||||
|
||||
{{% admonition type="warning" %}}
|
||||
Unmaintained since 2017 - [source](https://github.com/neuralfraud/grafana-prtg/wiki).
|
||||
{{% /admonition %}}
|
||||
|
||||
### [Monasca](https://grafana.com/grafana/plugins/monasca-datasource/)
|
||||
|
||||
Latest Version: 1.0.1 | Signature: Community | Last Updated: 2021
|
||||
|
||||
{{% admonition type="warning" %}}
|
||||
Lack of recent activity in the [project repository](https://github.com/openstack/monasca-grafana-datasource) in the past 2 years suggests project _may_ not be actively maintained.
|
||||
{{% /admonition %}}
|
||||
|
||||
{{% admonition type="warning" %}}
|
||||
Last updated to support Grafana v7.
|
||||
{{% /admonition %}}
|
||||
|
||||
### [Monitoring Art](https://grafana.com/grafana/plugins/monitoringartist-monitoringart-datasource/)
|
||||
|
||||
Latest Version: 1.0.1 | Signature: Community | Last Updated: 2021
|
||||
|
||||
{{% admonition type="warning" %}}
|
||||
Lack of recent activity in the [project repository](https://github.com/monitoringartist/grafana-monitoring-art) in the past 6 years suggests project _may_ not be actively maintained.
|
||||
{{% /admonition %}}
|
||||
|
||||
### [GoogleCalendar](https://grafana.com/grafana/plugins/mtanda-google-calendar-datasource/)
|
||||
|
||||
Latest Version: 1.0.5 | Signature: Community | Last Updated: 2021
|
||||
|
||||
{{% admonition type="warning" %}}
|
||||
Lack of recent activity in the [project repository](https://github.com/mtanda/grafana-google-calendar-datasource) in the past 2 years suggests project _may_ not be actively maintained.
|
||||
{{% /admonition %}}
|
||||
|
||||
### [USGS Water Services](https://grafana.com/grafana/plugins/natel-usgs-datasource/)
|
||||
|
||||
Latest Version: 0.0.3 | Signature: Community | Last Updated: 2021
|
||||
|
||||
{{% admonition type="warning" %}}
|
||||
Lack of recent activity in the [project repository](https://github.com/NatelEnergy/natel-usgs-datasource) in the past 3 years suggests project _may_ not be actively maintained.
|
||||
{{% /admonition %}}
|
||||
|
||||
### [KapacitorSimpleJson](https://grafana.com/grafana/plugins/paytm-kapacitor-datasource/)
|
||||
|
||||
Latest Version: 0.1.3 | Signature: Community | Last Updated: 2021
|
||||
|
||||
{{% admonition type="warning" %}}
|
||||
Lack of recent activity in the [project repository](https://github.com/paytm/kapacitor-grafana-datasource-plugin) in the past 4 years suggests project _may_ not be actively maintained.
|
||||
{{% /admonition %}}
|
||||
|
||||
### [Ambari Metrics](https://grafana.com/grafana/plugins/praj-ams-datasource/)
|
||||
|
||||
Latest Version: 1.2.1 | Signature: Community | Last Updated: 2021
|
||||
|
||||
{{% admonition type="warning" %}}
|
||||
Lack of recent activity in the [project repository](https://github.com/prajwalrao/ambari-metrics-grafana) in the past 5 years suggests project _may_ not be actively maintained.
|
||||
{{% /admonition %}}
|
||||
|
||||
### [Solr](https://grafana.com/grafana/plugins/pue-solr-datasource/)
|
||||
|
||||
Latest Version: 1.0.3 | Signature: Community | Last Updated: 2021
|
||||
|
||||
{{% admonition type="warning" %}}
|
||||
Unclear progress on migration to React - [issue](https://github.com/pueteam/datasource-plugin-solr/issues/12).
|
||||
{{% /admonition %}}
|
||||
|
||||
> **Migration available - potential alternative:** Users could configure the solr-exporter for Prometheus as described [here](https://solr.apache.org/guide/solr/latest/deployment-guide/monitoring-with-prometheus-and-grafana.html).
|
||||
|
||||
### [QuasarDB](https://grafana.com/grafana/plugins/quasardb-datasource/)
|
||||
|
||||
Latest Version: 3.8.3 | Signature: Community | Last Updated: 2021
|
||||
|
||||
### [Blueflood](https://grafana.com/grafana/plugins/rackerlabs-blueflood-datasource/)
|
||||
|
||||
Latest Version: 0.0.3 | Signature: Community | Last Updated: 2021
|
||||
|
||||
{{% admonition type="warning" %}}
|
||||
Lack of recent activity in the [project repository](https://github.com/rax-maas/blueflood-grafana) in the past 7 years suggests project _may_ not be actively maintained.
|
||||
{{% /admonition %}}
|
||||
|
||||
### [NetXMS](https://grafana.com/grafana/plugins/radensolutions-netxms-datasource/)
|
||||
|
||||
Latest Version: 1.2.3 | Signature: Community | Last Updated: 2021
|
||||
|
||||
{{% admonition type="warning" %}}
|
||||
Lack of recent activity in the [project repository](https://github.com/netxms/grafana) in the past 2 years suggests project _may_ not be actively maintained.
|
||||
{{% /admonition %}}
|
||||
|
||||
### [Sidewinder](https://grafana.com/grafana/plugins/sidewinder-datasource/)
|
||||
|
||||
Latest Version: 0.2.1 | Signature: Community | Last Updated: 2021
|
||||
|
||||
{{% admonition type="warning" %}}
|
||||
Lack of recent activity in the [project repository](https://github.com/srotya/sidewinder-grafana) in the past 5 years suggests project _may_ not be actively maintained.
|
||||
{{% /admonition %}}
|
||||
|
||||
### [Skydive](https://grafana.com/grafana/plugins/skydive-datasource/)
|
||||
|
||||
Latest Version: 1.2.1 | Signature: Community | Last Updated: 2021
|
||||
|
||||
{{% admonition type="warning" %}}
|
||||
Lack of recent activity in the [project repository](https://github.com/skydive-project/skydive-grafana-datasource) in the past 4 years suggests project _may_ not be actively maintained.
|
||||
{{% /admonition %}}
|
||||
|
||||
{{% admonition type="warning" %}}
|
||||
Issues suggest the entire project, not just the plugin, may be abandoned - [source](https://github.com/skydive-project/skydive/issues/2417).
|
||||
{{% /admonition %}}
|
||||
|
||||
### [Altinity plugin for ClickHouse](https://grafana.com/grafana/plugins/vertamedia-clickhouse-datasource/)
|
||||
|
||||
Latest Version: 2.5.3 | Signature: Community | Last Updated: 2022
|
||||
|
||||
{{% admonition type="note" %}}
|
||||
The [migration issue](https://github.com/Altinity/clickhouse-grafana/issues/475) has been assigned to a new major version milestone.
|
||||
{{% /admonition %}}
|
||||
|
||||
### [Pagerduty](https://grafana.com/grafana/plugins/xginn8-pagerduty-datasource/)
|
||||
|
||||
Latest Version: 0.2.2 | Signature: Community | Last Updated: 2021
|
||||
|
||||
{{% admonition type="warning" %}}
|
||||
Lack of recent activity in the [project repository](https://github.com/xginn8/grafana-pagerduty) in the past year suggests project _may_ not be actively maintained.
|
||||
{{% /admonition %}}
|
||||
|
||||
{{% admonition type="warning" %}}
|
||||
Plugin only claims support for Grafana v5.
|
||||
{{% /admonition %}}
|
||||
|
||||
### [Chaos Mesh](https://grafana.com/grafana/plugins/yeya24-chaosmesh-datasource/)
|
||||
|
||||
Latest Version: 0.2.3 | Signature: Community | Last Updated: 2022
|
||||
|
||||
{{% admonition type="warning" %}}
|
||||
Plugin declares itself deprecated in favour of [chaosmeshorg-datasource](https://grafana.com/grafana/plugins/chaosmeshorg-datasource/) which also appears above in this list with warnings around its future.
|
||||
{{% /admonition %}}
|
||||
|
||||
## Panels
|
||||
|
||||
### [FlowCharting](https://grafana.com/grafana/plugins/agenty-flowcharting-panel/)
|
||||
|
||||
Latest Version: 0.9.1 | Signature: Community | Last Updated: 2021
|
||||
|
||||
{{% admonition type="warning" %}}
|
||||
Lack of recent activity in the [project repository](https://github.com/algenty/grafana-flowcharting) in the past year suggests project _may_ not be actively maintained.
|
||||
{{% /admonition %}}
|
||||
|
||||
> **Migration available - potential alternative:** Grafana provides the native [Canvas]({{< relref "../../panels-visualizations/visualizations/canvas/" >}}) panel.
|
||||
|
||||
### [HTML](https://grafana.com/grafana/plugins/aidanmountford-html-panel/)
|
||||
|
||||
Latest Version: 0.0.2 | Signature: Community | Last Updated: 2021
|
||||
|
||||
{{% admonition type="warning" %}}
|
||||
Lack of recent activity in the [project repository](https://github.com/aidanmountford/aidanmountford-html-panel) in the past 4 years suggests project _may_ not be actively maintained.
|
||||
{{% /admonition %}}
|
||||
|
||||
> **Migration available - potential alternative:** The [Text]({{< relref "../../panels-visualizations/visualizations/text/#html" >}}) panel included with Grafana supports rendering HTML content. Other plugins also exist which provide similar capabilities - [HTML](https://grafana.com/grafana/plugins/gapit-htmlgraphics-panel/) and [Dynamic Text](https://grafana.com/grafana/plugins/marcusolsson-dynamictext-panel/).
|
||||
|
||||
### [Track Map](https://grafana.com/grafana/plugins/alexandra-trackmap-panel/)
|
||||
|
||||
Latest Version: 1.2.6 | Signature: Community | Last Updated: 2021
|
||||
|
||||
{{% admonition type="warning" %}}
|
||||
[Issue](https://github.com/alexandrainst/alexandra-trackmap-panel/issues/72#issuecomment-1332179974) suggests problems with ongoing maintenance unless new contributors are found.
|
||||
{{% /admonition %}}
|
||||
|
||||
{{% admonition type="warning" %}}
|
||||
[Migration issue](https://github.com/alexandrainst/alexandra-trackmap-panel/issues/105) has been marked as needing help.
|
||||
{{% /admonition %}}
|
||||
|
||||
### [PictureIt](https://grafana.com/grafana/plugins/bessler-pictureit-panel/)
|
||||
|
||||
Latest Version: 1.0.1 | Signature: Community | Last Updated: 2021
|
||||
|
||||
{{% admonition type="warning" %}}
|
||||
Lack of recent activity in the [project repository](https://github.com/vbessler/grafana-pictureit) in the past 6 years suggests project _may_ not be actively maintained.
|
||||
{{% /admonition %}}
|
||||
|
||||
> **Migration available - potential alternative:** another plugin exists which provides similar capabilities - [ePict](https://grafana.com/grafana/plugins/larona-epict-panel/).
|
||||
|
||||
### [Singlestat Math](https://grafana.com/grafana/plugins/blackmirror1-singlestat-math-panel/)
|
||||
|
||||
Latest Version: 1.1.8 | Signature: Community | Last Updated: 2021
|
||||
|
||||
{{% admonition type="warning" %}}
|
||||
Lack of recent activity in the [project repository](https://github.com/black-mirror-1/singlestat-math) in the past 5 years suggests project _may_ not be actively maintained.
|
||||
{{% /admonition %}}
|
||||
|
||||
### [Status By Group Panel](https://grafana.com/grafana/plugins/blackmirror1-statusbygroup-panel/)
|
||||
|
||||
Latest Version: 1.1.2 | Signature: Community | Last Updated: 2021
|
||||
|
||||
{{% admonition type="warning" %}}
|
||||
Lack of recent activity in the [project repository](https://github.com/black-mirror-1/Grafana_Status_panel) in the past 5 years suggests project _may_ not be actively maintained.
|
||||
{{% /admonition %}}
|
||||
|
||||
### [Datatable Panel](https://grafana.com/grafana/plugins/briangann-datatable-panel/)
|
||||
|
||||
Latest Version: 1.0.3 | Signature: Community | Last Updated: 2021
|
||||
|
||||
{{% admonition type="note" %}}
|
||||
Migration to React is planned - [issue](https://github.com/briangann/grafana-datatable-panel/issues/174).
|
||||
{{% /admonition %}}
|
||||
|
||||
### [GeoLoop](https://grafana.com/grafana/plugins/citilogics-geoloop-panel/)
|
||||
|
||||
Latest Version: 1.1.2 | Signature: Community | Last Updated: 2021
|
||||
|
||||
{{% admonition type="warning" %}}
|
||||
Lack of recent activity in the [project repository](https://github.com/CitiLogics/citilogics-geoloop-panel) in the past 2 years suggests project _may_ not be actively maintained.
|
||||
{{% /admonition %}}
|
||||
|
||||
### [Progress List](https://grafana.com/grafana/plugins/corpglory-progresslist-panel/)
|
||||
|
||||
Latest Version: 1.0.6 | Signature: Community | Last Updated: 2021
|
||||
|
||||
{{% admonition type="warning" %}}
|
||||
Lack of recent activity in the [project repository](https://github.com/CorpGlory/grafana-progress-list) in the past 2 years suggests project _may_ not be actively maintained.
|
||||
{{% /admonition %}}
|
||||
|
||||
### [Bubble Chart](https://grafana.com/grafana/plugins/digrich-bubblechart-panel/)
|
||||
|
||||
Latest Version: 1.2.1 | Signature: Community | Last Updated: 2021
|
||||
|
||||
{{% admonition type="warning" %}}
|
||||
Lack of recent activity in the [project repository](https://github.com/digrich/bubblechart-panel) in the past 3 years suggests project _may_ not be actively maintained.
|
||||
{{% /admonition %}}
|
||||
|
||||
### [Blendstat](https://grafana.com/grafana/plugins/farski-blendstat-panel/)
|
||||
|
||||
Latest Version: 1.0.3 | Signature: Community | Last Updated: 2021
|
||||
|
||||
> **Migration available - potential alternative:** plugin author recommends use of single stat panel and transformations functionality - [source](https://github.com/farski/blendstat-grafana/issues/11#issuecomment-1112158909).
|
||||
|
||||
### [WindRose](https://grafana.com/grafana/plugins/fatcloud-windrose-panel/)
|
||||
|
||||
Latest Version: 0.7.1 | Signature: Community | Last Updated: 2021
|
||||
|
||||
{{% admonition type="warning" %}}
|
||||
Lack of recent activity in the [project repository](https://github.com/fatcloud/windrose-panel) in the past 4 years suggests project _may_ not be actively maintained.
|
||||
{{% /admonition %}}
|
||||
|
||||
> **Migration available - potential alternative:** another plugin exists which provides similar capabilities - [Operator Windrose](https://grafana.com/grafana/plugins/operato-windrose-panel/)
|
||||
|
||||
### [Statusmap](https://grafana.com/grafana/plugins/flant-statusmap-panel/)
|
||||
|
||||
Latest Version: 0.5.1 | Signature: Community | Last Updated: 2022
|
||||
|
||||
{{% admonition type="warning" %}}
|
||||
Unknown whether migration to React will be undertaken - [migration issue](https://github.com/flant/grafana-statusmap/issues/302).
|
||||
{{% /admonition %}}
|
||||
|
||||
### [Singlestat](https://grafana.com/grafana/plugins/grafana-singlestat-panel/)
|
||||
|
||||
Latest Version: 2.0.0 | Signature: Grafana | Last Updated: 2022
|
||||
|
||||
> **Migration available - plugin superseded:** Singlestat plugin was replaced by the [Stat]({{< relref "../../panels-visualizations/visualizations/stat/" >}})panel included in Grafana.
|
||||
|
||||
### [Worldmap Panel](https://grafana.com/grafana/plugins/grafana-worldmap-panel/)
|
||||
|
||||
Latest Version: 1.0.3 | Signature: Grafana | Last Updated: 2023
|
||||
|
||||
> **Migration available - plugin superseded:** Worldmap plugin was replaced by [Geomap]({{< relref "../../panels-visualizations/visualizations/geomap/" >}}) panel included in Grafana.
|
||||
|
||||
### [Topology Panel](https://grafana.com/grafana/plugins/gretamosa-topology-panel/)
|
||||
|
||||
Latest Version: 1.0.1 | Signature: Community | Last Updated: 2021
|
||||
|
||||
{{% admonition type="warning" %}}
|
||||
Lack of recent activity in the [project repository](https://github.com/gretamosa/gretamosa-topology-panel) in the past 4 years suggests project _may_ not be actively maintained.
|
||||
{{% /admonition %}}
|
||||
|
||||
### [SVG](https://grafana.com/grafana/plugins/marcuscalidus-svg-panel/)
|
||||
|
||||
Latest Version: 0.3.4 | Signature: Community | Last Updated: 2021
|
||||
|
||||
{{% admonition type="warning" %}}
|
||||
Lack of recent activity in the [project repository](https://github.com/MarcusCalidus/marcuscalidus-svg-panel) in the past year suggests project _may_ not be actively maintained.
|
||||
{{% /admonition %}}
|
||||
|
||||
> **Migration available - potential alternative:** Grafana provides the native [Canvas]({{< relref "../../panels-visualizations/visualizations/canvas/" >}}) panel.
|
||||
|
||||
> **Migration available - potential alternative:** other plugins exist which provide similar capabilities - [HTML](https://grafana.com/grafana/plugins/gapit-htmlgraphics-panel/), [Dynamic Text](https://grafana.com/grafana/plugins/marcusolsson-dynamictext-panel/) and [ACE.SVG](https://grafana.com/grafana/plugins/aceiot-svg-panel/). Note that the ACE.SVG panel has compatibility issues with Grafana versions 10.0.0-10.1.0.
|
||||
|
||||
### [Annunciator](https://grafana.com/grafana/plugins/michaeldmoore-annunciator-panel/)
|
||||
|
||||
Latest Version: 1.1.0 | Signature: Community | Last Updated: 2021
|
||||
|
||||
{{% admonition type="warning" %}}
|
||||
Plugin developer has indicated they will retire the plugin once Angular support is discontinued - [source](https://github.com/michaeldmoore/michaeldmoore-annunciator-panel/issues/24#issuecomment-1479372673).
|
||||
{{% /admonition %}}
|
||||
|
||||
### [Multistat](https://grafana.com/grafana/plugins/michaeldmoore-multistat-panel/)
|
||||
|
||||
Latest Version: 1.7.2 | Signature: Community | Last Updated: 2021
|
||||
|
||||
{{% admonition type="warning" %}}
|
||||
Plugin developer has indicated they will retire the plugin once Angular support is discontinued - [source](https://github.com/michaeldmoore/michaeldmoore-multistat-panel/issues/71#issuecomment-1479372977).
|
||||
{{% /admonition %}}
|
||||
|
||||
### [HeatmapEpoch](https://grafana.com/grafana/plugins/mtanda-heatmap-epoch-panel/)
|
||||
|
||||
Latest Version: 0.1.8 | Signature: Community | Last Updated: 2021
|
||||
|
||||
{{% admonition type="warning" %}}
|
||||
Plugin advises caution as not stable; [project repository](https://github.com/mtanda/grafana-heatmap-epoch-panel) has not been updated in 7 years.
|
||||
{{% /admonition %}}
|
||||
|
||||
> **Migration available - potential alternative:** Other Heatmap panels exist including natively in Grafana - [learn more]({{< relref "../../panels-visualizations/visualizations/heatmap/" >}}).
|
||||
|
||||
### [Histogram](https://grafana.com/grafana/plugins/mtanda-histogram-panel/)
|
||||
|
||||
Latest Version: 0.1.7 | Signature: Community | Last Updated: 2021
|
||||
|
||||
{{% admonition type="warning" %}}
|
||||
Lack of recent activity in the [project repository](https://github.com/mtanda/grafana-histogram-panel) in the past 7 years suggests project _may_ not be actively maintained.
|
||||
{{% /admonition %}}
|
||||
|
||||
> **Migration available - potential alternative:** other Histogram panels exist including natively in Grafana - [learn more]({{< relref "../../panels-visualizations/visualizations/histogram/" >}}).
|
||||
|
||||
### [Separator](https://grafana.com/grafana/plugins/mxswat-separator-panel/)
|
||||
|
||||
Latest Version: 1.0.1 | Signature: Community | Last Updated: 2021
|
||||
|
||||
{{% admonition type="warning" %}}
|
||||
Lack of recent activity in the [project repository](https://github.com/mxswat/grafana-separator-panel) in the past 5 years suggests project _may_ not be actively maintained.
|
||||
{{% /admonition %}}
|
||||
|
||||
> **Migration available - potential alternative:** the [Text]({{< relref "../../panels-visualizations/visualizations/text/#html" >}}) panel can be used with no data to provide space within dashboards.
|
||||
|
||||
### [Discrete](https://grafana.com/grafana/plugins/natel-discrete-panel/)
|
||||
|
||||
Latest Version: 0.1.1 | Signature: Community | Last Updated: 2021
|
||||
|
||||
{{% admonition type="warning" %}}
|
||||
Lack of recent activity in the [project repository](https://github.com/NatelEnergy/grafana-discrete-panel) in the past 3 years suggests project _may_ not be actively maintained.
|
||||
{{% /admonition %}}
|
||||
|
||||
### [Influx Admin](https://grafana.com/grafana/plugins/natel-influx-admin-panel/)
|
||||
|
||||
Latest Version: 0.0.6 | Signature: Community | Last Updated: 2021
|
||||
|
||||
{{% admonition type="warning" %}}
|
||||
Lack of recent activity in the [project repository](https://github.com/NatelEnergy/grafana-influx-admin) in the past 5 years suggests project _may_ not be actively maintained.
|
||||
{{% /admonition %}}
|
||||
|
||||
### [Plotly](https://grafana.com/grafana/plugins/natel-plotly-panel/)
|
||||
|
||||
Latest Version: 0.0.7 | Signature: Community | Last Updated: 2021
|
||||
|
||||
{{% admonition type="warning" %}}
|
||||
Lack of recent activity in the [project repository](https://github.com/NatelEnergy/grafana-plotly-panel) in the past 2 years suggests project _may_ not be actively maintained.
|
||||
{{% /admonition %}}
|
||||
|
||||
> **Migration available - potential alternative:** other plugins exist which provide similar capabilities - [nline-plotlyjs-panel](https://grafana.com/grafana/plugins/nline-plotlyjs-panel/) and [ae3e-plotly-panel](https://grafana.com/grafana/plugins/ae3e-plotly-panel/).
|
||||
|
||||
### [Cal-HeatMap](https://grafana.com/grafana/plugins/neocat-cal-heatmap-panel/)
|
||||
|
||||
Latest Version: 0.0.4 | Signature: Community | Last Updated: 2021
|
||||
|
||||
{{% admonition type="warning" %}}
|
||||
Plugin advises caution as not stable; [project repository](https://github.com/NeoCat/grafana-cal-heatmap-panel) has not been updated in 7 years.
|
||||
{{% /admonition %}}
|
||||
|
||||
> **Migration available - potential alternative:** other Heatmap panels exist including natively in Grafana - [learn more]({{< relref "../../panels-visualizations/visualizations/heatmap/" >}}).
|
||||
|
||||
### [Annotation Panel](https://grafana.com/grafana/plugins/novalabs-annotations-panel/)
|
||||
|
||||
Latest Version: 0.0.2 | Signature: Community | Last Updated: 2021
|
||||
|
||||
{{% admonition type="warning" %}}
|
||||
Lack of recent activity in the [project repository](https://github.com/novalabs/grafana-annotations-panel) in the past 6 years suggests project _may_ not be actively maintained.
|
||||
{{% /admonition %}}
|
||||
|
||||
### [Carpet plot](https://grafana.com/grafana/plugins/petrslavotinek-carpetplot-panel/)
|
||||
|
||||
Latest Version: 0.1.2 | Signature: Community | Last Updated: 2021
|
||||
|
||||
{{% admonition type="warning" %}}
|
||||
Lack of recent activity in the [project repository](https://github.com/petrslavotinek/grafana-carpetplot) in the past 6 years suggests project _may_ not be actively maintained.
|
||||
{{% /admonition %}}
|
||||
|
||||
### [TrackMap](https://grafana.com/grafana/plugins/pr0ps-trackmap-panel/)
|
||||
|
||||
Latest Version: 2.1.4 | Signature: Community | Last Updated: 2023
|
||||
|
||||
{{% admonition type="warning" %}}
|
||||
Unknown whether migration to React will be undertaken - [migration issue](https://github.com/pR0Ps/grafana-trackmap-panel/issues/84).
|
||||
{{% /admonition %}}
|
||||
|
||||
### [AJAX](https://grafana.com/grafana/plugins/ryantxu-ajax-panel/)
|
||||
|
||||
Latest Version: 0.1.0 | Signature: Community | Last Updated: 2021
|
||||
|
||||
{{% admonition type="warning" %}}
|
||||
Lack of recent activity in the [project repository](https://github.com/ryantxu/ajax-panel) in the past 2 years suggests project _may_ not be actively maintained.
|
||||
{{% /admonition %}}
|
||||
|
||||
### [3D Globe Panel](https://grafana.com/grafana/plugins/satellogic-3d-globe-panel/)
|
||||
|
||||
Latest Version: 0.1.1 | Signature: Community | Last Updated: 2021
|
||||
|
||||
{{% admonition type="warning" %}}
|
||||
Lack of recent activity in the [project repository](https://github.com/satellogic/grafana-3d-globe-panel) in the past 5 years suggests project _may_ not be actively maintained.
|
||||
{{% /admonition %}}
|
||||
|
||||
### [Heatmap](https://grafana.com/grafana/plugins/savantly-heatmap-panel/)
|
||||
|
||||
Latest Version: 0.2.1 | Signature: Community | Last Updated: 2021
|
||||
|
||||
{{% admonition type="warning" %}}
|
||||
Lack of recent activity in the [project repository](https://github.com/savantly-net/grafana-heatmap) in the past 6 years suggests project _may_ not be actively maintained.
|
||||
{{% /admonition %}}
|
||||
|
||||
> **Migration available - potential alternative:** other Heatmap panels exist including natively in Grafana - [learn more]({{< relref "../../panels-visualizations/visualizations/heatmap/" >}}).
|
||||
|
||||
### [TrafficLight](https://grafana.com/grafana/plugins/smartmakers-trafficlight-panel/)
|
||||
|
||||
Latest Version: 1.0.1 | Signature: Community | Last Updated: 2021
|
||||
|
||||
{{% admonition type="warning" %}}
|
||||
Lack of recent activity in the [project repository](https://github.com/smartmakers/grafana-trafficlight) in the past 5 years suggests project _may_ not be actively maintained.
|
||||
{{% /admonition %}}
|
||||
|
||||
### [Radar Graph](https://grafana.com/grafana/plugins/snuids-radar-panel/)
|
||||
|
||||
Latest Version: 1.5.1 | Signature: Community | Last Updated: 2022
|
||||
|
||||
{{% admonition type="warning" %}}
|
||||
Unknown whether migration to React will be undertaken - [migration issue](https://github.com/snuids/grafana-radar-panel/issues/29).
|
||||
{{% /admonition %}}
|
||||
|
||||
### [Traffic Lights](https://grafana.com/grafana/plugins/snuids-trafficlights-panel/)
|
||||
|
||||
Latest Version: 1.6.0 | Signature: Community | Last Updated: 2023
|
||||
|
||||
{{% admonition type="warning" %}}
|
||||
Unknown whether migration to React will be undertaken - [migration issue](https://github.com/snuids/trafficlights-panel/issues/44).
|
||||
{{% /admonition %}}
|
||||
|
||||
### [Status Panel](https://grafana.com/grafana/plugins/vonage-status-panel/)
|
||||
|
||||
Latest Version: 1.0.11 | Signature: Community | Last Updated: 2021
|
||||
|
||||
{{% admonition type="warning" %}}
|
||||
Lack of recent activity in the [project repository](https://github.com/Vonage/Grafana_Status_panel) in the past 3 years suggests project _may_ not be actively maintained.
|
||||
{{% /admonition %}}
|
||||
|
||||
### [Boom Table](https://grafana.com/grafana/plugins/yesoreyeram-boomtable-panel/)
|
||||
|
||||
Latest Version: 1.4.1 | Signature: Community | Last Updated: 2021
|
||||
|
||||
{{% admonition type="warning" %}}
|
||||
Lack of recent activity in the [project repository](https://github.com/yesoreyeram/yesoreyeram-boomtable-panel) in the past 3 years suggests project _may_ not be actively maintained.
|
||||
{{% /admonition %}}
|
||||
|
||||
### [Parity Report](https://grafana.com/grafana/plugins/zuburqan-parity-report-panel/)
|
||||
|
||||
Latest Version: 1.2.2 | Signature: Community | Last Updated: 2021
|
||||
|
||||
{{% admonition type="warning" %}}
|
||||
Unknown whether migration to React will be undertaken - [migration issue](https://github.com/zuburqan/grafana-parity-report/issues/17).
|
||||
{{% /admonition %}}
|
||||
If you want to add any specific migration guidance for your plugin here or update our assessment, please open a PR by clicking **Suggest an edit** at the bottom of this page.
|
||||
{{% /admonition %}}
|
||||
|
||||
## Private plugins
|
||||
|
||||
Grafana OSS and Grafana Enterprise support the creation of private plugins for use on local instances. These plugins may have a dependency on AngularJS and require an update.
|
||||
|
||||
The `detect-angular-dashboards` tool listed above will include private plugins in its report **if the Grafana version is v10.1.0 or later**.
|
||||
|
||||
Additionally, warning icons and messages will be displayed when browsing the catalog via **Administration** > **Plugins and Data** > **Plugins** in your local instance.
|
||||
|
||||
## Automatic migration of plugins
|
||||
|
||||
Certain legacy Grafana panel plugins automatically update to their React-based replacements when Angular support is disabled. This migration is usually available within the panel options, as shown in the screenshot below for World Map. Automatic migration can also be tested by appending `&__feature.autoMigrateOldPanels=true` to the dashboard URL in your browser.
|
||||
|
||||
Automatic migration is supported for the plugins shown in the following table. Each of the target plugins are included in Grafana as Core plugins which don't require installation.
|
||||
|
||||
| Plugin | Migration target |
|
||||
| ----------- | ---------------- |
|
||||
| Graph (old) | Time Series |
|
||||
| Singlestat | Stat |
|
||||
| Stat (old) | Stat |
|
||||
| Table (old) | Table |
|
||||
| Worldmap | Geomap |
|
||||
|
||||
A dashboard must still be saved with the new plugin ID to persist the change.
|
||||
|
||||
# AngularJS-based plugins
|
||||
|
||||
This table lists plugins which we have detected as having a dependency on AngularJS. For alternatives, consider included [Visualizations]({{< relref "../../panels-visualizations/visualizations" >}}) and [Data sources]({{< relref "../../datasources" >}}), as well as external plugins from the [catalog](/grafana/plugins).
|
||||
|
||||
| Plugin ID | Name | Action |
|
||||
| ----------------------------------------------- | ----------------------------------- | ------------------------------------------------------------------------------------------------------------------------------------------------------------------------------------------------------------------------------------------------- |
|
||||
| grafana-worldmap-panel | Worldmap Panel | Migrate - [Geomap]({{< relref "../../panels-visualizations/visualizations/geomap" >}}) (core) replaced Worldmap - Note this should migrate when Angular is disabled. |
|
||||
| natel-discrete-panel | Discrete | Migrate - Browse included visualizations and plugins catalog for potential alternatives. |
|
||||
| vonage-status-panel | Status Panel | Migrate - Consider [Stat]({{< relref "../../panels-visualizations/visualizations/stat" >}}) (core) or [Polystat](https://grafana.com/grafana/plugins/grafana-polystat-panel/) as potential alternatives. |
|
||||
| grafana-simple-json-datasource | SimpleJson | Migrate - Consider [Infinity](https://grafana.com/grafana/plugins/yesoreyeram-infinity-datasource/) as a potential alternative. |
|
||||
| natel-plotly-panel | Plotly | Migrate - Consider alternative [nline-plotlyjs-panel](https://grafana.com/grafana/plugins/nline-plotlyjs-panel/) plugin. |
|
||||
| agenty-flowcharting-panel | FlowCharting | Migrate - Consider [Canvas]({{< relref "../../panels-visualizations/visualizations/canvas" >}}) (core) or [Diagram](https://grafana.com/grafana/plugins/jdbranham-diagram-panel/) as potential alternatives. |
|
||||
| camptocamp-prometheus-alertmanager-datasource | Prometheus AlertManager | Update - Note the minimum version for React is 2.0.0. |
|
||||
| briangann-gauge-panel | D3 Gauge | Update - Note the minimum version for React is 2.0.0. We recommend the latest. |
|
||||
| yesoreyeram-boomtable-panel | Boom Table | Migrate - Consider [Table]({{< relref "../../panels-visualizations/visualizations/table" >}}) (core) and [transformations]({{< relref "../../panels-visualizations/query-transform-data/transform-data/" >}}) as appropriate. |
|
||||
| briangann-datatable-panel | Datatable Panel | Wait - New version with React migration is planned. |
|
||||
| flant-statusmap-panel | Statusmap | Migrate - Browse included visualizations and plugins catalog for potential alternatives. |
|
||||
| michaeldmoore-multistat-panel | Multistat | Migrate - Browse included visualizations and plugins catalog for potential alternatives. |
|
||||
| pr0ps-trackmap-panel | TrackMap | Migrate - Browse included visualizations and plugins catalog for potential alternatives. |
|
||||
| snuids-trafficlights-panel | Traffic Lights | Migrate - Consider [Traffic Light](https://grafana.com/grafana/plugins/heywesty-trafficlight-panel/) as a potential alternative. |
|
||||
| vertamedia-clickhouse-datasource | Altinity plugin for ClickHouse | Update - Note the minimum version for React is 3.0.0. |
|
||||
| petrslavotinek-carpetplot-panel | Carpet plot | Migrate - Browse included visualizations and plugins catalog for potential alternatives. |
|
||||
| ryantxu-ajax-panel | AJAX | Migrate - Browse included visualizations and plugins catalog for potential alternatives. |
|
||||
| michaeldmoore-annunciator-panel | Annunciator | Migrate - Consider [Stat]({{< relref "../../panels-visualizations/visualizations/stat" >}}) (core). |
|
||||
| marcuscalidus-svg-panel | SVG | Migrate - Consider alternatives such as [Canvas]({{< relref "../../panels-visualizations/visualizations/canvas" >}}) (core), [Colored SVG](https://grafana.com/grafana/plugins/snuids-svg-panel/), or others. |
|
||||
| neocat-cal-heatmap-panel | Cal-HeatMap | Migrate - Consider [Heatmap]({{< relref "../../panels-visualizations/visualizations/heatmap" >}}) (core) visualization. |
|
||||
| blackmirror1-singlestat-math-panel | Singlestat Math | Migrate - Browse included visualizations and plugins catalog for potential alternatives. |
|
||||
| scadavis-synoptic-panel | SCADAvis Synoptic Panel | Update - Note the minimum version for React is 2.0. |
|
||||
| farski-blendstat-panel | Blendstat | Migrate - Consider [Stat]({{< relref "../../panels-visualizations/visualizations/stat" >}}) (core) and [transformations]({{< relref "../../panels-visualizations/query-transform-data/transform-data/" >}}) as appropriate. |
|
||||
| savantly-heatmap-panel | Heatmap | Migrate - Consider [Heatmap]({{< relref "../../panels-visualizations/visualizations/heatmap" >}}) (core) visualization. |
|
||||
| mtanda-histogram-panel | Histogram | Migrate - Consider included [Histogram]({{< relref "../../panels-visualizations/visualizations/histogram" >}}) visualization. |
|
||||
| snuids-radar-panel | Radar Graph | Migrate - Browse included visualizations and plugins catalog for potential alternatives. |
|
||||
| fatcloud-windrose-panel | WindRose | Migrate - Consider alternative [Operator Windrose](https://grafana.com/grafana/plugins/operato-windrose-panel/) plugin. |
|
||||
| bessler-pictureit-panel | PictureIt | Migrate - Consider alternative [ePict](https://grafana.com/grafana/plugins/larona-epict-panel/) plugin. |
|
||||
| digrich-bubblechart-panel | Bubble Chart | Update - Note the minimum version for React is 2.0.1. We recommend the latest. |
|
||||
| corpglory-progresslist-panel | Progress List | Migrate - Browse included visualizations and plugins catalog for potential alternatives. |
|
||||
| aidanmountford-html-panel | HTML | Migrate - Consider alternatives such as [Text]({{< relref "../../panels-visualizations/visualizations/text" >}}) (core), [HTML](https://grafana.com/grafana/plugins/gapit-htmlgraphics-panel), or others. |
|
||||
| fifemon-graphql-datasource | GraphQL Data Source | Wait - Removal of AngularJS is planned. Consider [Infinity](https://grafana.com/grafana/plugins/yesoreyeram-infinity-datasource/) plugin as alternative. |
|
||||
| goshposh-metaqueries-datasource | MetaQueries | Migrate - Browse included data sources and plugins catalog for potential alternatives. |
|
||||
| mxswat-separator-panel | Separator | Migrate - Consider alternative [Text]({{< relref "../../panels-visualizations/visualizations/text" >}}) panel (core) which can be empty and used as a separator. |
|
||||
| natel-influx-admin-panel | Influx Admin | Migrate - Browse included data sources and plugins catalog for potential alternatives. |
|
||||
| doitintl-bigquery-datasource | Google BigQuery | Migrate - Consider [Grafana Big Query](https://grafana.com/grafana/plugins/grafana-bigquery-datasource/) plugin. |
|
||||
| satellogic-3d-globe-panel | 3D Globe Panel | Migrate - Browse included visualizations and plugins catalog for potential alternatives. |
|
||||
| foursquare-clouderamanager-datasource | Cloudera Manager | Migrate - Browse included data sources and plugins catalog for potential alternatives. |
|
||||
| grafana-splunk-datasource | Splunk | Update - Note the minimum version for React is 4.1.0. We recommend the latest. |
|
||||
| grafana-singlestat-panel | Singlestat | Migrate - Consider [Stat]({{< relref "../../panels-visualizations/visualizations/stat" >}}) panel (core). |
|
||||
| blackmirror1-statusbygroup-panel | Status By Group Panel | Migrate - Browse included visualizations and plugins catalog for potential alternatives. |
|
||||
| novalabs-annotations-panel | Annotation Panel | Migrate - Browse included visualizations and plugins catalog for potential alternatives. |
|
||||
| jasonlashua-prtg-datasource | PRTG | Migrate - Browse included data sources and plugins catalog for potential alternatives. |
|
||||
| ryantxu-annolist-panel | Annotation List | Migrate - Consider [annotations list]({{< relref "../../panels-visualizations/visualizations/annotations" >}}) (core). |
|
||||
| cloudflare-app | Cloudflare Grafana App | Migrate - Consider using the [Cloudflare Dashboard](https://dash.cloudflare.com/?to=/:account/:zone/analytics/dns) or [DNS Analytics API](https://developers.cloudflare.com/api/operations/dns-analytics-table). |
|
||||
| smartmakers-trafficlight-panel | TrafficLight | Migrate - Consider [Traffic Light](https://grafana.com/grafana/plugins/heywesty-trafficlight-panel/) as a potential alternative. |
|
||||
| zuburqan-parity-report-panel | Parity Report | Migrate - Browse included visualizations and plugins catalog for potential alternatives. |
|
||||
| citilogics-geoloop-panel | GeoLoop | Migrate - Browse included visualizations and plugins catalog for potential alternatives. |
|
||||
| xginn8-pagerduty-datasource | Pagerduty | Wait - We are developing an Enterprise plugin for Pagerduty targeted for availability in Q1 2024. Note that all roadmap items are subject to change. |
|
||||
| gretamosa-topology-panel | Topology Panel | Migrate - Browse included visualizations and plugins catalog for potential alternatives. |
|
||||
| fzakaria-simple-annotations-datasource | Simple Annotations | Migrate - Check for annotations support within your data sources to remove dependency on this plugin. |
|
||||
| oci-metrics-datasource | Oracle Cloud Infrastructure Metrics | Update - Note the minimum version for React is 5.0.0. |
|
||||
| abhisant-druid-datasource | Druid | Migrate - Migrate to replacement [Druid](https://grafana.com/grafana/plugins/grafadruid-druid-datasource/) plugin. |
|
||||
| devopsprodigy-kubegraf-app | DevOpsProdigy KubeGraf | Migrate - Consider [Grafana Kubernetes Monitoring](https://grafana.com/solutions/kubernetes/) (Grafana Cloud only). |
|
||||
| mtanda-heatmap-epoch-panel | HeatmapEpoch | Migrate - Consider [Heatmap]({{< relref "../../panels-visualizations/visualizations/heatmap" >}}) (core) visualization. |
|
||||
| alexandra-trackmap-panel | Track Map | Migrate - Browse included visualizations and plugins catalog for potential alternatives. |
|
||||
| gnocchixyz-gnocchi-datasource | Gnocchi | Migrate - Browse included data sources and plugins catalog for potential alternatives. |
|
||||
| tencentcloud-monitor-app | Tencent Cloud Monitor | Migrate - Browse included data sources and plugins catalog for potential alternatives. |
|
||||
| andig-darksky-datasource | DarkSky | Remove - Note that support for the DarkSky API was ended by Apple in March 2023. |
|
||||
| mtanda-google-calendar-datasource | GoogleCalendar | Wait - Migration to React is planned. |
|
||||
| ntop-ntopng-datasource | ntopng | Migrate - Consider [InfluxDB]({{< relref "../../datasources/influxdb/" >}}) (core), with additional guidance available [here](https://www.ntop.org/guides/ntopng/basic_concepts/timeseries.html#influxdb-driver). |
|
||||
| ayoungprogrammer-finance-datasource | Finance | Migrate - Browse included data sources and plugins catalog for potential alternatives. |
|
||||
| grafana-kairosdb-datasource | KairosDB | Migrate - Browse included data sources and plugins catalog for potential alternatives. |
|
||||
| fastweb-openfalcon-datasource | Open-Falcon | Migrate - Browse included data sources and plugins catalog for potential alternatives. |
|
||||
| praj-ams-datasource | Ambari Metrics | Migrate - Browse included data sources and plugins catalog for potential alternatives. |
|
||||
| monasca-datasource | Monasca | Migrate - Browse included data sources and plugins catalog for potential alternatives. |
|
||||
| grafana-strava-datasource | Strava | Update - Note the minimum version for React is 1.6.0. We recommend the latest. |
|
||||
| gridprotectionalliance-osisoftpi-datasource | OSIsoft-PI | Update - Note the minimum version for React is 4.0.0. We recommend the latest. |
|
||||
| monitoringartist-monitoringart-datasource | Monitoring Art | Migrate - Browse included visualizations and plugins catalog for potential alternatives. |
|
||||
| hawkular-datasource | Hawkular | Migrate - Browse included data sources and plugins catalog for potential alternatives. |
|
||||
| ovh-warp10-datasource | Warp 10 | Migrate - Browse included data sources and plugins catalog for potential alternatives. |
|
||||
| natel-usgs-datasource | USGS Water Services | Migrate - Browse included data sources and plugins catalog for potential alternatives. |
|
||||
| radensolutions-netxms-datasource | NetXMS | Migrate - Browse included data sources and plugins catalog for potential alternatives. |
|
||||
| ibm-apm-datasource | IBM APM | Migrate - Browse included data sources and plugins catalog for potential alternatives. |
|
||||
| cognitedata-datasource | Cognite Data Fusion | Update - Note the minimum version for React is 4.0.0. We recommend the latest. |
|
||||
| linksmart-sensorthings-datasource | LinkSmart SensorThings | Migrate - Browse included data sources and plugins catalog for potential alternatives. |
|
||||
| pue-solr-datasource | Solr | Migrate - Consider this [guidance](https://solr.apache.org/guide/solr/latest/deployment-guide/monitoring-with-prometheus-and-grafana.html) on using solr-exporter for prometheus. |
|
||||
| paytm-kapacitor-datasource | KapacitorSimpleJson | Migrate - Browse included data sources and plugins catalog for potential alternatives. |
|
||||
| oci-logs-datasource | Oracle Cloud Infrastructure Logs | Update - Note the minimum version for React is 4.0.0. |
|
||||
| gridprotectionalliance-openhistorian-datasource | openHistorian | Wait - Note that new version with React migration is planned. |
|
||||
| devicehive-devicehive-datasource | DeviceHive | Migrate - Browse included data sources and plugins catalog for potential alternatives. |
|
||||
| rackerlabs-blueflood-datasource | Blueflood | Migrate - Browse included data sources and plugins catalog for potential alternatives. |
|
||||
| udoprog-heroic-datasource | Heroic | Migrate - Note that Heroic DB has been discontinued. |
|
||||
| akumuli-datasource | Akumuli | Migrate - Browse included data sources and plugins catalog for potential alternatives. |
|
||||
| bmchelix-ade-datasource | BMC Helix | Migrate - Browse included data sources and plugins catalog for potential alternatives. |
|
||||
| sidewinder-datasource | Sidewinder | Migrate - Browse included data sources and plugins catalog for potential alternatives. |
|
||||
| linksmart-hds-datasource | LinkSmart HDS Datasource | Migrate - browse included data sources and plugins catalog for potential alternatives. |
|
||||
| skydive-datasource | Skydive | Migrate - Browse included data sources and plugins catalog for potential alternatives. |
|
||||
| quasardb-datasource | QuasarDB | Migrate - Browse included data sources and plugins catalog for potential alternatives. |
|
||||
| spotify-heroic-datasource | Heroic | Migrate - Note that Heroic DB has been discontinued. |
|
||||
| grafana-es-open-distro-datasource | Open Distro for Elasticsearch | Migrate - Note that [OpenSearch](https://grafana.com/grafana/plugins/grafana-opensearch-datasource/) replaced Open Distro for Elasticseach. |
|
||||
| humio-datasource | Humio | Migrate - Browse included data sources and plugins catalog for potential alternatives. |
|
||||
| yeya24-chaosmesh-datasource | Chaos Mesh | Migrate - Note that plugin was replaced by [chaosmeshorg-datasource](https://grafana.com/grafana/plugins/chaosmeshorg-datasource/). |
|
||||
| kentik-connect-app | Kentik Connect Pro | Update - Note the minimum version for React is 1.7.0. |
|
||||
| chaosmeshorg-datasource | Chaos Mesh | Update - Note the minimum version for React is 3.0.0. |
|
||||
| aquaqanalytics-kdbadaptor-datasource | kdb+ | Migrate - Note that [kdb+ backend](https://grafana.com/grafana/plugins/aquaqanalytics-kdbbackend-datasource) replaced kdb.+. |
|
||||
| alexanderzobnin-zabbix-app | Zabbix | Update - Note the minimum version for React is 4.3.0. We recommend the latest. Recently brought under Grafana signature. |
|
||||
| bosun-app | Bosun | Migrate - Browse included data sources and plugins catalog for potential alternatives. |
|
||||
| belugacdn-app | BelugaCDN | Migrate - Browse included data sources and plugins catalog for potential alternatives. |
|
||||
| grafana-azure-data-explorer-datasource | Azure Data Explorer Datasource | Update - The minimum supported version is 3.5.1. We recommend the latest. |
|
||||
| ddurieux-glpi-app | glpi | Migrate - Browse included data sources and plugins catalog for potential alternatives. |
|
||||
| fetzerch-sunandmoon-datasource | Sun and Moon | Update - Note the minimum version for React is 0.3.0. |
|
||||
| grafana-clock-panel | Clock | Update - Note the minimum version for React is 1.1.0. We recommend the latest. |
|
||||
| grafana-github-datasource | GitHub | Update - Note the minimum version for React is 1.3.3. We recommend the latest. |
|
||||
| grafana-datadog-datasource | Datadog | Update - Note the minimum version for React is 3.0.0. We recommend the latest. |
|
||||
| grafana-gitlab-datasource | Gitlab | Update - Note the minimum version for React is 1.1.0. We recommend the latest. |
|
||||
| grafana-iot-twinmaker-app | AWS IoT TwinMaker App | Update - Note the minimum version for React is 1.6.3. We recommend the latest. |
|
||||
| grafana-newrelic-datasource | New Relic | Update - Note the minimum version for React is 3.0.0. We recommend the latest. |
|
||||
| grafana-opensearch-datasource | Opensearch | Update - Note the minimum version for React is 2.0.0. We recommend the latest. |
|
||||
| grafana-oracle-datasource | Oracle | Update - Note the minimum version for React is 2.0.6. We recommend the latest. |
|
||||
| grafana-piechart-panel | Pie Chart | Migrate - Note that [Pie Chart]({{< relref "../../panels-visualizations/visualizations/pie-chart" >}}) (core) replaced Pie Chart. |
|
||||
| grafana-polystat-panel | Polystat | Update - Note the minimum version for React is 2.0.0. We recommend the latest. |
|
||||
| grafana-servicenow-datasource | ServiceNow | Update - Note the minimum version for React is 2.0.2. We recommend the latest. |
|
||||
| grafana-synthetic-monitoring-app | Synthetic Monitoring | Update - Note the minimum version for React is 0.7.3. We recommend the latest. |
|
||||
| grafana-wavefront-datasource | Wavefront | Update - Note the minimum version for React is 2.0.0. We recommend the latest. |
|
||||
| hadesarchitect-cassandra-datasource | Apache Cassandra | Update - Note the minimum version for React is 2.1.1. We recommend the latest. |
|
||||
| instana-datasource | Instana | Update - Note the minimum version for React is 3.0.0. We recommend the latest. |
|
||||
| jdbranham-diagram-panel | Diagram | Update - Note the minimum version for React is 1.7.1. We recommend the latest. |
|
||||
| larona-epict-panel | ePict | Update - Note the minimum version for React is 2.0.0. We recommend the latest. |
|
||||
| moogsoft-aiops-app | Moogsoft AIOps | Update - Note the minimum version for React is 9.0.0. |
|
||||
| opennms-helm-app | OpenNMS Helm | Migrate - Note that [OpenNMS Plugin for Grafana](https://grafana.com/grafana/plugins/opennms-opennms-app/) replaced OpenNMS Helm. |
|
||||
| percona-percona-app | Percona | Migrate - Consider use of [Percona dashboards](https://github.com/percona/grafana-dashboards/). |
|
||||
| novatec-sdg-panel | Service Dependency Graph | Update - Note the minimum version for React is 4.0.3. |
|
||||
| pierosavi-imageit-panel | ImageIt | Migrate - Consider [ePict](https://grafana.com/grafana/plugins/larona-epict-panel/) or browse plugins catalog for potential alternatives. |
|
||||
| redis-app | Redis Application | Update - Note the minimum version for React is 1.2.0. We recommend the latest. |
|
||||
| sbueringer-consul-datasource | Consul | Migrate - Browse included data sources and plugins catalog for potential alternatives. |
|
||||
| simpod-json-datasource | JSON | Update - Note the minimum version for React is 0.3.0. We recommend the latest. |
|
||||
| singlestat | Singlestat | Migrate - Note that [Stat]({{< relref "../../panels-visualizations/visualizations/stat" >}}) (core) replaced Singlestat. |
|
||||
| sni-pnp-datasource | PNP | Update - Note the minimum version for React is 2.0.0. We recommend the latest. |
|
||||
| sni-thruk-datasource | Thruk | Update - Note the minimum version for React is 2.0.0. We recommend the latest. |
|
||||
| stagemonitor-elasticsearch-app | stagemonitor Elasticsearch | Migrate - Browse included data sources and plugins catalog for potential alternatives. |
|
||||
| tdengine-datasource | TDengine Datasource | Update - Note the minimum version for React is 3.3.0. We recommend the latest. |
|
||||
| vertica-grafana-datasource | Vertica | Update - Note the minimum version for React is 2.0.0. We recommend the latest. |
|
||||
| vonage-status-panel | Status Panel | Wait - Updated version may become available, or browse included visualizations and plugins catalog for potential alternatives. |
|
||||
| voxter-app | Voxter VoIP Platform Metrics | Migrate - Browse included data sources and plugins catalog for potential alternatives. |
|
||||
| graph | Graph (old) | Migrate - Note that this is replaced by [Time Series]({{< relref "../../panels-visualizations/visualizations/time-series" >}}) (core) - This plugin should migrate when Angular is disabled. Also consider Bar Chart or Histogram if appropriate. |
|
||||
| table-old | Table (old) | Migrate - Note that this is replaced by [Table]({{< relref "../../panels-visualizations/visualizations/table" >}}) (core) - This plugin should migrate when AngularJS is disabled. |
|
||||
| shorelinesoftware-shoreline-datasource | Shoreline Data Source | Update - Note the minimum version for React is 1.2.1. We recommend the latest. |
|
||||
|
||||
@@ -383,12 +383,12 @@ Content-Type: application/json
|
||||
HTTP/1.1 200 OK
|
||||
Content-Type: application/json; charset=UTF-8
|
||||
|
||||
```
|
||||
|
||||
#### Status codes
|
||||
|
||||
| Code | Description |
|
||||
| ---- | ---------------------------------------------------------------------------------- |
|
||||
```
|
||||
|
||||
#### Status codes
|
||||
|
||||
| Code | Description |
|
||||
| ---- | ---------------------------------------------------------------------------------- |
|
||||
| 200 | Role is deleted. |
|
||||
| 400 | Bad request (invalid json, missing content-type, missing or invalid fields, etc.). |
|
||||
| 403 | Access denied |
|
||||
@@ -498,13 +498,13 @@ For more information, refer to [Create role validation errors]({{< ref "#create-
|
||||
```http
|
||||
HTTP/1.1 200 OK
|
||||
Content-Type: application/json; charset=UTF-8
|
||||
|
||||
```
|
||||
|
||||
#### Status codes
|
||||
|
||||
| Code | Description |
|
||||
| ---- | -------------------------------------------------------------------- |
|
||||
|
||||
```
|
||||
|
||||
#### Status codes
|
||||
|
||||
| Code | Description |
|
||||
| ---- | -------------------------------------------------------------------- |
|
||||
| 200 | Set of assigned permissions is returned. |
|
||||
| 403 | Access denied. |
|
||||
| 500 | Unexpected error. Refer to body and/or server logs for more details. |
|
||||
@@ -532,7 +532,7 @@ Accept: application/json
|
||||
```http
|
||||
POST /api/access-control/users/1/roles
|
||||
Accept: application/json
|
||||
Content-Type: application/json
|
||||
Content-Type: application/json
|
||||
|
||||
{
|
||||
"global": false,
|
||||
|
||||
File diff suppressed because it is too large
Load Diff
@@ -29,6 +29,8 @@ If you just want to explore your data and do not want to create a dashboard, the
|
||||
|
||||
## Start exploring
|
||||
|
||||
{{< youtube id="1q3YzX2DDM4" >}}
|
||||
|
||||
> Refer to [Role-based access Control]({{< relref "../administration/roles-and-permissions/access-control/" >}}) in Grafana Enterprise to understand how you can manage Explore with role-based permissions.
|
||||
|
||||
In order to access Explore, you must have an editor or an administrator role, unless the [viewers_can_edit option]({{< relref "../setup-grafana/configure-grafana/#viewers_can_edit" >}}) is enabled. Refer to [About users and permissions]({{< relref "../administration/roles-and-permissions/" >}}) for more information on what each role has access to.
|
||||
|
||||
@@ -32,7 +32,7 @@ and the bar height represents the frequency (such as count) of values that fell
|
||||
This _histogram_ shows the value distribution of a couple of time series. You can easily see that
|
||||
most values land between 240-300 with a peak between 260-280.
|
||||
|
||||

|
||||

|
||||
|
||||
Here is an example showing height distribution of people.
|
||||
|
||||
@@ -48,7 +48,7 @@ A _heatmap_ is like a histogram, but over time, where each time slice represents
|
||||
|
||||
In this example, you can clearly see what values are more common and how they trend over time.
|
||||
|
||||

|
||||

|
||||
|
||||
For more information about heatmap visualization options, refer to [Heatmap][heatmap].
|
||||
|
||||
|
||||
@@ -28,7 +28,7 @@ In [Introduction to time series][time-series-databases], the concept of _labels_
|
||||
|
||||
With time series data, the data often contain more than a single series, and is a set of multiple time series. Many Grafana data sources support this type of data.
|
||||
|
||||
{{< figure src="/static/img/docs/example_graph_multi_dim.png" class="docs-image--no-shadow" max-width="850px" >}}
|
||||
{{< figure src="/static/img/docs/example_graph_multi_dim.png" class="docs-image--no-shadow" max-width="850px" alt="Temperature by location" >}}
|
||||
|
||||
The common case is issuing a single query for a measurement with one or more additional properties as dimensions. For example, querying a temperature measurement along with a location property. In this case, multiple series are returned back from that single query and each series has unique location as a dimension.
|
||||
|
||||
|
||||
@@ -31,7 +31,7 @@ Temperature data like this is one example of what we call a _time series_ — a
|
||||
|
||||
Tables are useful when you want to identify individual measurements, but they make it difficult to see the big picture. A more common visualization for time series is the _graph_, which instead places each measurement along a time axis. Visual representations like the graph make it easier to discover patterns and features of the data that otherwise would be difficult to see.
|
||||
|
||||
{{< figure src="/static/img/docs/example_graph.png" class="docs-image--no-shadow" max-width="850px" >}}
|
||||
{{< figure src="/static/img/docs/example_graph.png" class="docs-image--no-shadow" max-width="850px" alt="Temperature data displayed on dashboard" >}}
|
||||
|
||||
Temperature data like the one in the example, is far from the only example of a time series. Other examples of time series are:
|
||||
|
||||
|
||||
@@ -77,7 +77,7 @@ Congratulations, you have created your first dashboard and it's displaying resul
|
||||
|
||||
#### Next steps
|
||||
|
||||
Continue to experiment with what you have built, try the [explore workflow]({{< relref "../explore" >}}) or another visualization feature. Refer to [Data sources]({{< relref "../datasources" >}}) for a list of supported data sources and instructions on how to [add a data source]({{< relref "../administration/data-source-management#add-a-data-source" >}}). The following topics will be of interest to you:
|
||||
Continue to experiment with what you have built, try the [explore workflow]({{< relref "../explore" >}}) or another visualization feature. Refer to [Data sources]({{< relref "../datasources" >}}) for a list of supported data sources and instructions on how to [add a data source]({{< relref "../datasources#add-a-data-source" >}}). The following topics will be of interest to you:
|
||||
|
||||
- [Panels and visualizations]({{< relref "../panels-visualizations" >}})
|
||||
- [Dashboards]({{< relref "../dashboards" >}})
|
||||
|
||||
@@ -38,7 +38,7 @@ Windows users might need to make additional adjustments. Look for special instru
|
||||
|
||||
You can have more than one InfluxDB data source defined in Grafana.
|
||||
|
||||
1. Follow the general instructions to [add a data source]({{< relref "../administration/data-source-management#add-a-data-source" >}}).
|
||||
1. Follow the general instructions to [add a data source]({{< relref "../datasources#add-a-data-source" >}}).
|
||||
1. Decide if you will use InfluxQL or Flux as your query language.
|
||||
- [Configure the data source]({{< relref "../datasources/influxdb#configure-the-data-source" >}}) for your chosen query language.
|
||||
Each query language has its own unique data source settings.
|
||||
|
||||
@@ -87,6 +87,7 @@ With a Grafana Enterprise license, you also get access to premium data sources,
|
||||
- [MongoDB](/grafana/plugins/grafana-mongodb-datasource)
|
||||
- [New Relic](/grafana/plugins/grafana-newrelic-datasource)
|
||||
- [Oracle Database](/grafana/plugins/grafana-oracle-datasource)
|
||||
- [PagerDuty](/grafana/plugins/grafana-pagerduty-datasource)
|
||||
- [Salesforce](/grafana/plugins/grafana-salesforce-datasource)
|
||||
- [SAP HANA®](/grafana/plugins/grafana-saphana-datasource)
|
||||
- [ServiceNow](/grafana/plugins/grafana-servicenow-datasource)
|
||||
|
||||
@@ -30,8 +30,13 @@ Panels can be dragged, dropped, and resized to rearrange them on the dashboard.
|
||||
|
||||
Before you add a panel, ensure that you have configured a data source.
|
||||
|
||||
- For more information about adding and managing data sources as an administrator, refer to [Data source management][].
|
||||
- For details about using specific data sources, refer to [Data sources][].
|
||||
- For details about using data sources, refer to [Data sources][].
|
||||
|
||||
- For more information about managing data sources as an administrator, refer to [Data source management][].
|
||||
|
||||
{{% admonition type="note" %}}
|
||||
[Data source management](https://grafana.com/docs/grafana/<GRAFANA_VERSION>/administration/data-source-management/) is only available in [Grafana Enterprise](https://grafana.com/docs/grafana/<GRAFANA_VERSION>/introduction/grafana-enterprise/) and [Grafana Cloud](https://grafana.com/docs/grafana-cloud/).
|
||||
{{% /admonition %}}
|
||||
|
||||
This section includes the following sub topics:
|
||||
|
||||
|
||||
@@ -26,13 +26,37 @@ weight: 80
|
||||
|
||||
# Configure data links
|
||||
|
||||
You can use data link variables or data links to create links between panels.
|
||||
Data links allow you to provide more granular context to your links. You can create links that include the series name or even the value under the cursor. For example, if your visualization shows four servers, you can add a data link to one or two of them. You can also link panels using data links.
|
||||
|
||||
The link itself is accessible in different ways depending on the visualization. For the time series visualization you need to click a data point or line:
|
||||
|
||||

|
||||
|
||||
For visualizations like stat, gauge, or bar gauge you can click anywhere on the visualization to open the context menu:
|
||||
|
||||

|
||||
|
||||
If there's only one data link in the visualization, clicking anywhere on the visualization opens the link rather than the context menu.
|
||||
|
||||
## Supported visualizations
|
||||
|
||||
You can configure data links for the following visualizations:
|
||||
|
||||
| | | |
|
||||
| -------------------------- | ---------------------- | -------------------------------- |
|
||||
| [Bar chart][bar chart] | [Geomap][geomap] | [State timeline][state timeline] |
|
||||
| [Bar gauge][bar gauge] | [Heatmap][heatmap] | [Status history][status history] |
|
||||
| [Candlestick][candlestick] | [Histogram][histogram] | [Table][table] |
|
||||
| [Canvas][canvas] | [Pie chart][pie chart] | [Time series][time series] |
|
||||
| [Gauge][gauge] | [Stat][stat] | [Trend][trend] |
|
||||
|
||||
<!--Also xy chart -->
|
||||
|
||||
## Data link variables
|
||||
|
||||
You can use variables in data links to refer to series fields, labels, and values. For more information about data links, refer to [Data links](#data-links).
|
||||
Variables in data links let you send people to a detailed dashboard with preserved data filters. For example, you could use variables to specify a label, time range, series, or variable selection.
|
||||
|
||||
To see a list of available variables, type `$` in the data link **URL** field to see a list of variables that you can use.
|
||||
To see a list of available variables, enter `$` in the data link **URL** field.
|
||||
|
||||
{{% admonition type="note" %}}
|
||||
These variables changed in 6.4 so if you have an older version of Grafana, then use the version picker to select docs for an older version of Grafana.
|
||||
@@ -40,50 +64,65 @@ These variables changed in 6.4 so if you have an older version of Grafana, then
|
||||
|
||||
Azure Monitor, [CloudWatch][], and [Google Cloud Monitoring][] have pre-configured data links called _deep links_.
|
||||
|
||||
You can also use template variables in your data links URLs, refer to [Templates and variables][] for more information on template variables.
|
||||
You can also use template variables in your data links URLs. For more information, refer to [Templates and variables][].
|
||||
|
||||
## Time range panel variables
|
||||
### Time range panel variables
|
||||
|
||||
These variables allow you to include the current time range in the data link URL.
|
||||
These variables allow you to include the current time range in the data link URL:
|
||||
|
||||
- `__url_time_range` - current dashboard's time range (i.e. `?from=now-6h&to=now`)
|
||||
- `$__from and $__to` - For more information, refer to [Global variables][].
|
||||
| Variable | Description |
|
||||
| ------------------ | ------------------------------------------------------------------- |
|
||||
| `__url_time_range` | Current dashboard's time range (for example, `?from=now-6h&to=now`) |
|
||||
| `__from` | For more information, refer to [Global variables][]. |
|
||||
| `__to` | For more information, refer to [Global variables][]. |
|
||||
|
||||
## Series variables
|
||||
When you create data links using time range variables like `__url_time_range` in the URL, you have to form the query parameter syntax yourself; that is, you must format the URL by appending query parameters using the question mark (`?`) and ampersand (`&`) syntax. These characters aren't automatically generated.
|
||||
|
||||
### Series variables
|
||||
|
||||
Series-specific variables are available under `__series` namespace:
|
||||
|
||||
- `__series.name` - series name to the URL
|
||||
| Variable | Description |
|
||||
| --------------- | ---------------------- |
|
||||
| `__series.name` | Series name to the URL |
|
||||
|
||||
## Field variables
|
||||
### Field variables
|
||||
|
||||
Field-specific variables are available under `__field` namespace:
|
||||
|
||||
- `__field.name` - the name of the field
|
||||
- `__field.labels.<LABEL>` - label's value to the URL. If your label contains dots, then use `__field.labels["<LABEL>"]` syntax.
|
||||
| Variable | Description |
|
||||
| ------------------------ | --------------------------------------------------------------------------------------------------- |
|
||||
| `__field.name` | The name of the field |
|
||||
| `__field.labels.<LABEL>` | Label's value to the URL. If your label contains dots, then use `__field.labels["<LABEL>"]` syntax. |
|
||||
|
||||
## Value variables
|
||||
### Value variables
|
||||
|
||||
Value-specific variables are available under `__value` namespace:
|
||||
|
||||
- `__value.time` - value's timestamp (Unix ms epoch) to the URL (i.e. `?time=1560268814105`)
|
||||
- `__value.raw` - raw value
|
||||
- `__value.numeric` - numeric representation of a value
|
||||
- `__value.text` - text representation of a value
|
||||
- `__value.calc` - calculation name if the value is result of calculation
|
||||
| Variable | Description |
|
||||
| ----------------- | --------------------------------------------------------------------------------- |
|
||||
| `__value.time` | Value's timestamp (Unix ms epoch) to the URL (for example, `?time=1560268814105`) |
|
||||
| `__value.raw` | Raw value |
|
||||
| `__value.numeric` | Numeric representation of a value |
|
||||
| `__value.text` | Text representation of a value |
|
||||
| `__value.calc` | Calculation name if the value is result of calculation |
|
||||
|
||||
Using value-specific variables in data links can show different results depending on the set option of Tooltip mode.
|
||||
|
||||
## Data variables
|
||||
When you create data links using time range variables like `__value.time` in the URL, you have to form the query parameter syntax yourself; that is, you must add the question mark (`?`) and ampersand (`&`). These characters aren't automatically generated.
|
||||
|
||||
### Data variables
|
||||
|
||||
To access values and labels from other fields use:
|
||||
|
||||
- `${__data.fields[i]}` - value of field `i` (on the same row)
|
||||
- `${__data.fields["NameOfField"]}` - value of field using name instead of index
|
||||
- `${__data.fields["NameOfField"]}` - value of field using name instead of index
|
||||
- `${__data.fields[1].labels.cluster}` - access labels of another field
|
||||
| Variable | Description |
|
||||
| --------------------------------- | ------------------------------------------ |
|
||||
| `__data.fields[i]` | Value of field `i` (on the same row) |
|
||||
| `__data.fields["NameOfField"]` | Value of field using name instead of index |
|
||||
| `__data.fields["NameOfField"]` | Value of field using name instead of index |
|
||||
| `__data.fields[1].labels.cluster` | Access labels of another field |
|
||||
|
||||
## Template variables
|
||||
### Template variables
|
||||
|
||||
When linking to another dashboard that uses template variables, select variable values for whoever clicks the link.
|
||||
|
||||
@@ -97,54 +136,69 @@ When linking to another dashboard that uses template variables, select variable
|
||||
|
||||
If you want to add all of the current dashboard's variables to the URL, then use `${__all_variables}`.
|
||||
|
||||
## Data links
|
||||
## Add a data link
|
||||
|
||||
Data links allow you to provide more granular context to your links. You can create links that include the series name or even the value under the cursor. For example, if your visualization showed four servers, you could add a data link to one or two of them.
|
||||
|
||||
The link itself is accessible in different ways depending on the visualization. For the Graph you need to click on a data point or line, for a panel like
|
||||
Stat, Gauge, or Bar Gauge you can click anywhere on the visualization to open the context menu.
|
||||
|
||||
You can use variables in data links to send people to a detailed dashboard with preserved data filters. For example, you could use variables to specify a time range, series, and variable selection. For more information, refer to [Data link variables](#data-link-variables).
|
||||
|
||||
### Typeahead suggestions
|
||||
|
||||
When creating or updating a data link, press Cmd+Space or Ctrl+Space on your keyboard to open the typeahead suggestions to more easily add variables to your URL.
|
||||
|
||||
{{< figure src="/static/img/docs/data_link_typeahead.png" max-width= "800px" alt="Drop-down list with variable suggestions open from the URL field" >}}
|
||||
|
||||
### Add a data link
|
||||
|
||||
1. Hover over any part of the panel you want to which you want to add the data link to display the actions menu on the top right corner.
|
||||
1. Click the menu and select **Edit**.
|
||||
|
||||
To use a keyboard shortcut to open the panel, hover over the panel and press `e`.
|
||||
|
||||
1. Scroll down to the Data links section and expand it.
|
||||
1. Navigate to the panel to which you want to add the data link.
|
||||
1. Hover over any part of the panel to display the menu icon in the upper-right corner.
|
||||
1. Click the menu icon and select **Edit** to open the panel editor.
|
||||
1. In the panel edit pane, scroll down to the **Data links** section and expand it.
|
||||
1. Click **Add link**.
|
||||
1. Enter a **Title**. **Title** is a human-readable label for the link that will be displayed in the UI.
|
||||
1. Enter the **URL** you want to link to.
|
||||
1. In the dialog box that opens, enter a **Title**. This is a human-readable label for the link, which will be displayed in the UI.
|
||||
1. Enter the **URL** or variable to which you want to link.
|
||||
|
||||
You can even add one of the template variables defined in the dashboard. Click in the **URL** field and then type `$` or press Ctrl+Space or Cmd+Space to see a list of available variables. By adding template variables to your panel link, the link sends the user to the right context, with the relevant variables already set. For more information, refer to [Data link variables](#data-link-variables).
|
||||
To add a data link variable, click in the **URL** field and enter `$` or press Ctrl+Space or Cmd+Space to see a list of available variables.
|
||||
|
||||
1. If you want the link to open in a new tab, then select **Open in a new tab**.
|
||||
1. Click **Save** to save changes and close the window.
|
||||
1. Click **Save** in the upper right to save your changes to the dashboard.
|
||||
|
||||
### Update a data link
|
||||
|
||||
1. Scroll down to the Data links section, expand it, and find the link that you want to make changes to.
|
||||
1. Click the Edit (pencil) icon to open the Edit link window.
|
||||
1. Make any necessary changes.
|
||||
1. Click **Save** to save changes and close the window.
|
||||
1. Click **Save** in the upper right to save your changes to the dashboard.
|
||||
|
||||
### Delete a data link
|
||||
|
||||
1. Scroll down to the Data links section, expand it, and find the link that you want to delete.
|
||||
1. Click the **X** icon next to the link you want to delete.
|
||||
1. Click **Save** in the upper right to save your changes to the dashboard.
|
||||
1. If you want the link to open in a new tab, then toggle the **Open in a new tab** switch.
|
||||
1. Click **Save** to save changes and close the dialog box.
|
||||
1. Click **Apply** to see your changes in the dashboard.
|
||||
1. Click the **Save dashboard** icon to save your changes to the dashboard.
|
||||
|
||||
{{% docs/reference %}}
|
||||
[bar chart]: "/docs/grafana/ -> /docs/grafana/<GRAFANA VERSION>/panels-visualizations/visualizations/bar-chart"
|
||||
[bar chart]: "/docs/grafana-cloud/ -> /docs/grafana-cloud/visualizations/panels-visualizations/visualizations/bar-chart"
|
||||
|
||||
[bar gauge]: "/docs/grafana/ -> /docs/grafana/<GRAFANA VERSION>/panels-visualizations/visualizations/bar-gauge"
|
||||
[bar gauge]: "/docs/grafana-cloud/ -> /docs/grafana-cloud/visualizations/panels-visualizations/visualizations/bar-gauge"
|
||||
|
||||
[candlestick]: "/docs/grafana/ -> /docs/grafana/<GRAFANA VERSION>/panels-visualizations/visualizations/candlestick"
|
||||
[candlestick]: "/docs/grafana-cloud/ -> /docs/grafana-cloud/visualizations/panels-visualizations/visualizations/candlestick"
|
||||
|
||||
[canvas]: "/docs/grafana/ -> /docs/grafana/<GRAFANA VERSION>/panels-visualizations/visualizations/canvas"
|
||||
[canvas]: "/docs/grafana-cloud/ -> /docs/grafana-cloud/visualizations/panels-visualizations/visualizations/canvas"
|
||||
|
||||
[gauge]: "/docs/grafana/ -> /docs/grafana/<GRAFANA VERSION>/panels-visualizations/visualizations/gauge"
|
||||
[gauge]: "/docs/grafana-cloud/ -> /docs/grafana-cloud/visualizations/panels-visualizations/visualizations/gauge"
|
||||
|
||||
[geomap]: "/docs/grafana/ -> /docs/grafana/<GRAFANA VERSION>/panels-visualizations/visualizations/geomap"
|
||||
[geomap]: "/docs/grafana-cloud/ -> /docs/grafana-cloud/visualizations/panels-visualizations/visualizations/geomap"
|
||||
|
||||
[heatmap]: "/docs/grafana/ -> /docs/grafana/<GRAFANA VERSION>/panels-visualizations/visualizations/heatmap"
|
||||
[heatmap]: "/docs/grafana-cloud/ -> /docs/grafana-cloud/visualizations/panels-visualizations/visualizations/heatmap"
|
||||
|
||||
[histogram]: "/docs/grafana/ -> /docs/grafana/<GRAFANA VERSION>/panels-visualizations/visualizations/histogram"
|
||||
[histogram]: "/docs/grafana-cloud/ -> /docs/grafana-cloud/visualizations/panels-visualizations/visualizations/histogram"
|
||||
|
||||
[pie chart]: "/docs/grafana/ -> /docs/grafana/<GRAFANA VERSION>/panels-visualizations/visualizations/pie-chart"
|
||||
[pie chart]: "/docs/grafana-cloud/ -> /docs/grafana-cloud/visualizations/panels-visualizations/visualizations/pie-chart"
|
||||
|
||||
[stat]: "/docs/grafana/ -> /docs/grafana/<GRAFANA VERSION>/panels-visualizations/visualizations/stat"
|
||||
[stat]: "/docs/grafana-cloud/ -> /docs/grafana-cloud/visualizations/panels-visualizations/visualizations/stat"
|
||||
|
||||
[state timeline]: "/docs/grafana/ -> /docs/grafana/<GRAFANA VERSION>/panels-visualizations/visualizations/state-timeline"
|
||||
[state timeline]: "/docs/grafana-cloud/ -> /docs/grafana-cloud/visualizations/panels-visualizations/visualizations/state-timeline"
|
||||
|
||||
[status history]: "/docs/grafana/ -> /docs/grafana/<GRAFANA VERSION>/panels-visualizations/visualizations/status-history"
|
||||
[status history]: "/docs/grafana-cloud/ -> /docs/grafana-cloud/visualizations/panels-visualizations/visualizations/status-history"
|
||||
|
||||
[table]: "/docs/grafana/ -> /docs/grafana/<GRAFANA VERSION>/panels-visualizations/visualizations/table"
|
||||
[table]: "/docs/grafana-cloud/ -> /docs/grafana-cloud/visualizations/panels-visualizations/visualizations/table"
|
||||
|
||||
[time series]: "/docs/grafana/ -> /docs/grafana/<GRAFANA VERSION>/panels-visualizations/visualizations/time-series"
|
||||
[time series]: "/docs/grafana-cloud/ -> /docs/grafana-cloud/visualizations/panels-visualizations/visualizations/time-series"
|
||||
|
||||
[trend]: "/docs/grafana/ -> /docs/grafana/<GRAFANA VERSION>/panels-visualizations/visualizations/trend"
|
||||
[trend]: "/docs/grafana-cloud/ -> /docs/grafana-cloud/visualizations/panels-visualizations/visualizations/trend"
|
||||
|
||||
[Cloudwatch]: "/docs/grafana/ -> /docs/grafana/<GRAFANA VERSION>/datasources/aws-cloudwatch/query-editor#deep-link-grafana-panels-to-the-cloudwatch-console-1"
|
||||
[Cloudwatch]: "/docs/grafana-cloud/ -> /docs/grafana-cloud/connect-externally-hosted/data-sources/aws-cloudwatch/query-editor#deep-link-grafana-panels-to-the-cloudwatch-console-1"
|
||||
|
||||
@@ -152,8 +206,8 @@ When creating or updating a data link, press Cmd+Space or Ctrl+Space on your key
|
||||
[Google Cloud Monitoring]: "/docs/grafana-cloud/ -> /docs/grafana-cloud/connect-externally-hosted/data-sources/google-cloud-monitoring/query-editor#deep-link-from-grafana-panels-to-the-google-cloud-console-metrics-explorer"
|
||||
|
||||
[Templates and variables]: "/docs/grafana/ -> /docs/grafana/<GRAFANA VERSION>/dashboards/variables"
|
||||
[Templates and variables]: "/docs/grafana-cloud/ -> /docs/grafana/<GRAFANA VERSION>/dashboards/variables"
|
||||
[Templates and variables]: "/docs/grafana-cloud/ -> /docs/grafana-cloud/visualizations/dashboards/variables"
|
||||
|
||||
[Global variables]: "/docs/grafana/ -> /docs/grafana/<GRAFANA VERSION>/dashboards/variables/add-template-variables#**from-and-**to"
|
||||
[Global variables]: "/docs/grafana-cloud/ -> /docs/grafana/<GRAFANA VERSION>/dashboards/variables/add-template-variables#**from-and-**to"
|
||||
[Global variables]: "/docs/grafana-cloud/ -> /docs/grafana-cloud/visualizations/dashboards/variables/add-template-variables#**from-and-**to"
|
||||
{{% /docs/reference %}}
|
||||
|
||||
@@ -30,7 +30,7 @@ Legends are supported for the following visualizations:
|
||||
- [Trend][trend]
|
||||
<!-- - xy chart -->
|
||||
|
||||
[Geomaps][] and [heatmaps][] also have legends, but they only provide the the choice to display or not display a legend and don't support other legend options.
|
||||
[Geomaps][] and [heatmaps][] also have legends, but they only provide the choice to display or not display a legend and don't support other legend options.
|
||||
|
||||
## Legend options
|
||||
|
||||
|
||||
@@ -127,8 +127,8 @@ To see an example of repeating panels, refer to [this dashboard with repeating p
|
||||
[Configure repeating rows]: "/docs/grafana/ -> /docs/grafana/<GRAFANA VERSION>/dashboards/build-dashboards/create-dashboard#configure-repeating-rows"
|
||||
[Configure repeating rows]: "/docs/grafana-cloud/ -> /docs/grafana/<GRAFANA VERSION>/dashboards/build-dashboards/create-dashboard#configure-repeating-rows"
|
||||
|
||||
[Grafana LLM plugin]: "/docs/grafana/ -> /docs/grafana-cloud/alerting-and-irm/machine-learning/llm-plugin"
|
||||
[Grafana LLM plugin]: "/docs/grafana-cloud/ -> /docs/grafana-cloud/alerting-and-irm/machine-learning/llm-plugin"
|
||||
[Grafana LLM plugin]: "/docs/grafana/ -> /docs/grafana-cloud/alerting-and-irm/machine-learning/configure/llm-plugin"
|
||||
[Grafana LLM plugin]: "/docs/grafana-cloud/ -> /docs/grafana-cloud/alerting-and-irm/machine-learning/configure/llm-plugin"
|
||||
|
||||
[Set up generative AI features for dashboards documentation]: "/docs/grafana/ -> /docs/grafana/<GRAFANA VERSION>/dashboards/manage-dashboards#set-up-generative-ai-features-for-dashboards"
|
||||
[Set up generative AI features for dashboards documentation]: "/docs/grafana-cloud/ -> /docs/grafana-cloud/visualizations/dashboards/manage-dashboards#set-up-generative-ai-features-for-dashboards"
|
||||
|
||||
@@ -20,60 +20,101 @@ weight: 100
|
||||
|
||||
# Configure thresholds
|
||||
|
||||
This section includes information about using thresholds in your visualizations. You'll learn about thresholds, their defaults, how to add or delete a threshold, and adding a threshold to a legacy panel.
|
||||
In dashboards, a threshold is a value or limit you set for a metric that's reflected visually when it's met or exceeded. Thresholds are one way you can conditionally style and color your visualizations based on query results.
|
||||
|
||||
## About thresholds
|
||||
Using thresholds, you can color grid lines and regions in a time series visualization:
|
||||

|
||||
|
||||
A threshold is a value that you specify for a metric that is visually reflected in a dashboard when the threshold value is met or exceeded.
|
||||
You can color the background or value text in a stat visualization:
|
||||

|
||||
|
||||
Thresholds provide one method for you to conditionally style and color your visualizations based on query results. You can apply thresholds to most, but not all, visualizations. For more information about visualizations, refer to [Visualization panels][].
|
||||
You can define regions and region colors in a state timeline:
|
||||

|
||||
|
||||
You can use thresholds to:
|
||||
You can also use thresholds to:
|
||||
|
||||
- Color grid lines or grid areas in the [Time-series visualization][]
|
||||
- Color lines in the [Time-series visualization][]
|
||||
- Color the background or value text in the [Stat visualization][]
|
||||
- Color the gauge and threshold markers in the [Gauge visualization][]
|
||||
- Color markers in the [Geomap visualization][]
|
||||
- Color cell text or background in the [Table visualization][]
|
||||
- Define regions and region colors in the [State timeline visualization][]
|
||||
- Color lines in a time series visualization
|
||||
- Color the gauge and threshold markers in a gauge
|
||||
- Color markers in a geomap
|
||||
- Color cell text or background in a table
|
||||
|
||||
There are two types of thresholds:
|
||||
## Supported visualizations
|
||||
|
||||
- **Absolute** thresholds are defined by a number. For example, 80 on a scale of 1 to 150.
|
||||
- **Percentage** thresholds are defined relative to minimum or maximum. For example, 80 percent.
|
||||
You can set thresholds in the following visualizations:
|
||||
|
||||
### Default thresholds
|
||||
| | | |
|
||||
| -------------------------- | -------------------------------- | -------------------------------- |
|
||||
| [Bar chart][bar chart] | [Geomap][geomap] | [Status history][status history] |
|
||||
| [Bar gauge][bar gauge] | [Histogram][histogram] | [Table][table] |
|
||||
| [Candlestick][candlestick] | [Stat][stat] | [Time series][time series] |
|
||||
| [Canvas][canvas] | [State timeline][state timeline] | [Trend][trend] |
|
||||
| [Gauge][gauge] |
|
||||
|
||||
On visualizations that support it, Grafana sets default threshold values of:
|
||||
## Default thresholds
|
||||
|
||||
On visualizations that support thresholds, Grafana has the following default threshold settings:
|
||||
|
||||
- 80 = red
|
||||
- Base = green
|
||||
- Mode = Absolute
|
||||
- Show thresholds = Off (for some visualizations); for more information, see the [Show thresholds](#show-threshold) option.
|
||||
|
||||
The **Base** value represents minus infinity. It is generally the “good” color.
|
||||
## Thresholds options
|
||||
|
||||
## Add or delete a threshold
|
||||
You can set the following options to further define how thresholds look.
|
||||
|
||||
You can add as many thresholds to a panel as you want. Grafana automatically sorts thresholds values from highest to lowest.
|
||||
### Threshold value
|
||||
|
||||
Delete a threshold when it is no longer needed. When you delete a threshold, the system removes the threshold from all visualizations that include the threshold.
|
||||
This number is the value that triggers the threshold. You can also set the color associated with the threshold in this field.
|
||||
|
||||
1. To add a threshold:
|
||||
The **Base** value represents minus infinity. By default, it's set to the color green, which is generally the “good” color.
|
||||
|
||||
a. Edit the panel to which you want to add a threshold.
|
||||
### Thresholds mode
|
||||
|
||||
b. In the options side pane, locate the **Thresholds** section and click **+ Add threshold**.
|
||||
There are two threshold modes:
|
||||
|
||||
c. Select a threshold color, number, and mode.
|
||||
Threshold mode applies to all thresholds on this panel.
|
||||
- **Absolute** thresholds are defined by a number. For example, 80 on a scale of 1 to 150.
|
||||
- **Percentage** thresholds are defined relative to minimum or maximum. For example, 80 percent.
|
||||
|
||||
d. For a time-series panel, select a **Show thresholds** option.
|
||||
### Show thresholds
|
||||
|
||||
1. To delete a threshold, navigate to the panel that contains the threshold and click the trash icon next to the threshold you want to remove.
|
||||
{{< admonition type="note" >}}
|
||||
This option is supported for the bar chart, candlestick, time series, and trend visualizations.
|
||||
{{< /admonition>}}
|
||||
|
||||
Set if and how thresholds are shown with the following options.
|
||||
|
||||
| Option | Example |
|
||||
| ------------------------------------ | ---------------------------------------------------------------------------------------------------------------------------------------------------------------------------------------------------- |
|
||||
| Off | |
|
||||
| As lines | {{< figure max-width="500px" src="/media/docs/grafana/panels-visualizations/screenshot-thresholds-lines-v10.4.png" alt="Visualization with threshold as a line" >}} |
|
||||
| As lines (dashed) | {{< figure max-width="500px" src="/media/docs/grafana/panels-visualizations/screenshot-thresholds-dashed-lines-v10.4.png" alt="Visualization with threshold as a dashed line" >}} |
|
||||
| As filled regions | {{< figure max-width="500px" src="/media/docs/grafana/panels-visualizations/screenshot-thresholds-regions-v10.4.png" alt="Visualization with threshold as a region" >}} |
|
||||
| As filled regions and lines | {{< figure max-width="500px" src="/media/docs/grafana/panels-visualizations/screenshot-thresholds-lines-regions-v10.4.png" alt="Visualization with threshold as a region and line" >}} |
|
||||
| As filled regions and lines (dashed) | {{< figure max-width="500px" src="/media/docs/grafana/panels-visualizations/screenshot-thresholds-dashed-lines-regions-v10.4.png" alt="Visualization with threshold as a region and dashed line" >}} |
|
||||
|
||||
## Add a threshold
|
||||
|
||||
You can add as many thresholds to a visualization as you want. Grafana automatically sorts thresholds values from highest to lowest.
|
||||
|
||||
1. Navigate to the panel you want to update.
|
||||
1. Hover over any part of the panel you want to work on to display the menu on the top right corner.
|
||||
1. Click the menu and select **Edit**.
|
||||
1. Scroll to the **Thresholds** section or enter `thresholds` in the search bar at the top of the panel edit pane.
|
||||
1. Click **+ Add threshold**.
|
||||
1. Enter a new threshold value or use the up and down arrows at the right side of the field to increase or decrease the value incrementally.
|
||||
1. Click the colored circle to the left of the threshold value to open the color picker, where you can update the threshold color.
|
||||
1. Under **Thresholds mode**, select either **Absolute** or **Percentage**.
|
||||
1. Under **Show thresholds**, set how the threshold is displayed or turn it off.
|
||||
|
||||
To delete a threshold, navigate to the panel that contains the threshold and click the trash icon next to the threshold you want to remove.
|
||||
|
||||
## Add a threshold to a legacy graph panel
|
||||
|
||||
{{< admonition type="caution" >}}
|
||||
Starting with Grafana v11, the legacy graph panel will be deprecated along with all other Angular panel plugins. For more information, refer to [Angular support deprecation](https://grafana.com/docs/grafana/<GRAFANA_VERSION>/developers/angular_deprecation/).
|
||||
{{< /admonition >}}
|
||||
|
||||
In the Graph panel visualization, thresholds enable you to add lines or sections to a graph to make it easier to recognize when the graph crosses a threshold.
|
||||
|
||||
1. Navigate to the graph panel to which you want to add a threshold.
|
||||
@@ -94,24 +135,42 @@ In the Graph panel visualization, thresholds enable you to add lines or sections
|
||||
1. Click **Save** to save the changes in the dashboard.
|
||||
|
||||
{{% docs/reference %}}
|
||||
[Table visualization]: "/docs/grafana/ -> /docs/grafana/<GRAFANA VERSION>/panels-visualizations/visualizations/table"
|
||||
[Table visualization]: "/docs/grafana-cloud/ -> /docs/grafana/<GRAFANA VERSION>/panels-visualizations/visualizations/table"
|
||||
[bar chart]: "/docs/grafana/ -> /docs/grafana/<GRAFANA VERSION>/panels-visualizations/visualizations/bar-chart"
|
||||
[bar chart]: "/docs/grafana-cloud/ -> /docs/grafana-cloud/visualizations/panels-visualizations/visualizations/bar-chart"
|
||||
|
||||
[Stat visualization]: "/docs/grafana/ -> /docs/grafana/<GRAFANA VERSION>/panels-visualizations/visualizations/stat"
|
||||
[Stat visualization]: "/docs/grafana-cloud/ -> /docs/grafana/<GRAFANA VERSION>/panels-visualizations/visualizations/stat"
|
||||
[bar gauge]: "/docs/grafana/ -> /docs/grafana/<GRAFANA VERSION>/panels-visualizations/visualizations/bar-gauge"
|
||||
[bar gauge]: "/docs/grafana-cloud/ -> /docs/grafana-cloud/visualizations/panels-visualizations/visualizations/bar-gauge"
|
||||
|
||||
[Time-series visualization]: "/docs/grafana/ -> /docs/grafana/<GRAFANA VERSION>/panels-visualizations/visualizations/time-series#from-thresholds"
|
||||
[Time-series visualization]: "/docs/grafana-cloud/ -> /docs/grafana/<GRAFANA VERSION>/panels-visualizations/visualizations/time-series#from-thresholds"
|
||||
[candlestick]: "/docs/grafana/ -> /docs/grafana/<GRAFANA VERSION>/panels-visualizations/visualizations/candlestick"
|
||||
[candlestick]: "/docs/grafana-cloud/ -> /docs/grafana-cloud/visualizations/panels-visualizations/visualizations/candlestick"
|
||||
|
||||
[State timeline visualization]: "/docs/grafana/ -> /docs/grafana/<GRAFANA VERSION>/panels-visualizations/visualizations/state-timeline"
|
||||
[State timeline visualization]: "/docs/grafana-cloud/ -> /docs/grafana/<GRAFANA VERSION>/panels-visualizations/visualizations/state-timeline"
|
||||
[canvas]: "/docs/grafana/ -> /docs/grafana/<GRAFANA VERSION>/panels-visualizations/visualizations/canvas"
|
||||
[canvas]: "/docs/grafana-cloud/ -> /docs/grafana-cloud/visualizations/panels-visualizations/visualizations/canvas"
|
||||
|
||||
[Gauge visualization]: "/docs/grafana/ -> /docs/grafana/<GRAFANA VERSION>/panels-visualizations/visualizations/gauge"
|
||||
[Gauge visualization]: "/docs/grafana-cloud/ -> /docs/grafana/<GRAFANA VERSION>/panels-visualizations/visualizations/gauge"
|
||||
[gauge]: "/docs/grafana/ -> /docs/grafana/<GRAFANA VERSION>/panels-visualizations/visualizations/gauge"
|
||||
[gauge]: "/docs/grafana-cloud/ -> /docs/grafana-cloud/visualizations/panels-visualizations/visualizations/gauge"
|
||||
|
||||
[Visualization panels]: "/docs/grafana/ -> /docs/grafana/<GRAFANA VERSION>/panels-visualizations/visualizations"
|
||||
[Visualization panels]: "/docs/grafana-cloud/ -> /docs/grafana/<GRAFANA VERSION>/panels-visualizations/visualizations"
|
||||
[geomap]: "/docs/grafana/ -> /docs/grafana/<GRAFANA VERSION>/panels-visualizations/visualizations/geomap"
|
||||
[geomap]: "/docs/grafana-cloud/ -> /docs/grafana-cloud/visualizations/panels-visualizations/visualizations/geomap"
|
||||
|
||||
[Geomap visualization]: "/docs/grafana/ -> /docs/grafana/<GRAFANA VERSION>/panels-visualizations/visualizations/geomap"
|
||||
[Geomap visualization]: "/docs/grafana-cloud/ -> /docs/grafana/<GRAFANA VERSION>/panels-visualizations/visualizations/geomap"
|
||||
[histogram]: "/docs/grafana/ -> /docs/grafana/<GRAFANA VERSION>/panels-visualizations/visualizations/histogram"
|
||||
[histogram]: "/docs/grafana-cloud/ -> /docs/grafana-cloud/visualizations/panels-visualizations/visualizations/histogram"
|
||||
|
||||
[stat]: "/docs/grafana/ -> /docs/grafana/<GRAFANA VERSION>/panels-visualizations/visualizations/stat"
|
||||
[stat]: "/docs/grafana-cloud/ -> /docs/grafana-cloud/visualizations/panels-visualizations/visualizations/stat"
|
||||
|
||||
[state timeline]: "/docs/grafana/ -> /docs/grafana/<GRAFANA VERSION>/panels-visualizations/visualizations/state-timeline"
|
||||
[state timeline]: "/docs/grafana-cloud/ -> /docs/grafana-cloud/visualizations/panels-visualizations/visualizations/state-timeline"
|
||||
|
||||
[status history]: "/docs/grafana/ -> /docs/grafana/<GRAFANA VERSION>/panels-visualizations/visualizations/status-history"
|
||||
[status history]: "/docs/grafana-cloud/ -> /docs/grafana-cloud/visualizations/panels-visualizations/visualizations/status-history"
|
||||
|
||||
[table]: "/docs/grafana/ -> /docs/grafana/<GRAFANA VERSION>/panels-visualizations/visualizations/table"
|
||||
[table]: "/docs/grafana-cloud/ -> /docs/grafana-cloud/visualizations/panels-visualizations/visualizations/table"
|
||||
|
||||
[time series]: "/docs/grafana/ -> /docs/grafana/<GRAFANA VERSION>/panels-visualizations/visualizations/time-series"
|
||||
[time series]: "/docs/grafana-cloud/ -> /docs/grafana-cloud/visualizations/panels-visualizations/visualizations/time-series"
|
||||
|
||||
[trend]: "/docs/grafana/ -> /docs/grafana/<GRAFANA VERSION>/panels-visualizations/visualizations/trend"
|
||||
[trend]: "/docs/grafana-cloud/ -> /docs/grafana-cloud/visualizations/panels-visualizations/visualizations/trend"
|
||||
{{% /docs/reference %}}
|
||||
|
||||
@@ -16,34 +16,55 @@ labels:
|
||||
- oss
|
||||
menuTitle: Configure value mappings
|
||||
title: Configure value mappings
|
||||
description: Configure value mappings to change the visual treatment of data in your visualizations
|
||||
description: Configure value mappings to change how data appears in your visualizations
|
||||
weight: 90
|
||||
---
|
||||
|
||||
# Configure value mappings
|
||||
|
||||
In addition to field overrides, value mapping is a technique that you can use to change the visual treatment of data that appears in a visualization.
|
||||
In addition to field overrides, value mapping is a technique you can use to change how data appears in a visualization.
|
||||
|
||||
Values mapped using value mappings bypass the unit formatting. This means that a text value mapped to a numerical value is not formatted using the configured unit.
|
||||
For example, the mapping applied in the following image causes the visualization to display the text `Cold`, `Good`, and `Hot` in blue, green, and red for ranges of temperatures rather than actual temperature values. Using value mappings this way can make data faster and easier to understand and interpret.
|
||||
|
||||

|
||||

|
||||
|
||||
If value mappings are present in a panel, then Grafana displays a summary in the side pane of the panel editor.
|
||||
Value mappings bypass unit formatting set in the **Standard options** section of panel editor, like color or number of decimal places displayed. When value mappings are present in a panel, Grafana displays a summary of them in the **Value mappings** section of the editor panel.
|
||||
|
||||
## Supported visualizations
|
||||
|
||||
You can configure value mappings for the following visualizations:
|
||||
|
||||
| | | |
|
||||
| -------------------------- | -------------------------------- | -------------------------------- |
|
||||
| [Bar chart][bar chart] | [Geomap][geomap] | [Status history][status history] |
|
||||
| [Bar gauge][bar gauge] | [Histogram][histogram] | [Table][table] |
|
||||
| [Candlestick][candlestick] | [Pie chart][pie chart] | [Time series][time series] |
|
||||
| [Canvas][canvas] | [Stat][stat] | [Trend][trend] |
|
||||
| [Gauge][gauge] | [State timeline][state timeline] | |
|
||||
|
||||
## Types of value mappings
|
||||
|
||||
{{% admonition type="note" %}}
|
||||
The new value mappings are not compatible with some visualizations, such as Graph (old), Text, and Heatmap.
|
||||
{{% /admonition %}}
|
||||
Grafana supports the following value mapping types:
|
||||
|
||||
Grafana supports the following value mappings:
|
||||
### Value
|
||||
|
||||
- **Value:** Maps text values to a color or different display text. For example, you can configure a value mapping so that all instances of the value `10` appear as **Perfection!** rather than the number.
|
||||
- **Range:** Maps numerical ranges to a display text and color. For example, if a value is within a certain range, you can configure a range value mapping to display **Low** or **High** rather than the number.
|
||||
- **Regex:** Maps regular expressions to replacement text and a color. For example, if a value is `www.example.com`, you can configure a regex value mapping so that Grafana displays **www** and truncates the domain.
|
||||
- **Special** Maps special values like `Null`, `NaN` (not a number), and boolean values like `true` and `false` to a display text and color. For example, you can configure a special value mapping so that `null` values appear as **N/A**.
|
||||
A **Value** mapping maps specific values to text and a color. For example, you can configure a mapping so that all instances of the value `10` appear as **Perfection!** rather than the number. Use **Value** mapping when you want to format a single value.
|
||||

|
||||
|
||||
You can also use the dots on the left to drag and reorder value mappings in the list.
|
||||
### Range
|
||||
|
||||
A **Range** mapping maps numerical ranges to text and a color. For example, if a value is within a certain range, you can configure a range value mapping to display **Low** or **High** rather than the number. Use **Range** mapping when you want to format multiple, continuous values.
|
||||

|
||||
|
||||
### Regex
|
||||
|
||||
A **Regex** mapping maps regular expressions to text and a color. For example, if a value is `www.example.com`, you can configure a regular expression value mapping so that Grafana displays **www** and truncates the domain. Use the **Regex** mapping when you want to format the text and color of a regular expression value.
|
||||

|
||||
|
||||
### Special
|
||||
|
||||
A **Special** mapping maps special values like `Null`, `NaN` (not a number), and boolean values like `true` and `false` to text and color. For example, you can configure a special value mapping so that `null` values appear as **N/A**. Use the **Special** mapping when you want to format uncommon, boolean, or empty values.
|
||||

|
||||
|
||||
## Examples
|
||||
|
||||
@@ -51,19 +72,19 @@ Refer to the following examples to learn more about value mapping.
|
||||
|
||||
### Time series example
|
||||
|
||||
The following image shows a time series visualization with value mappings. Value mapping colors are not applied to this visualization, but the display text is shown on the axis.
|
||||
The following image shows a time series visualization with value mappings. Value mapping colors aren't applied to this visualization, but the display text is shown on the axis.
|
||||
|
||||

|
||||
|
||||
### Stat example
|
||||
|
||||
The following image shows a Stat visualization with value mappings and text colors applied. You can hide the sparkline so it doesn't interfere with the values.
|
||||
The following image shows a stat visualization with value mappings and text colors applied. You can hide the sparkline so it doesn't interfere with the values.
|
||||
|
||||

|
||||
|
||||
### Bar gauge example
|
||||
|
||||
The following image shows a bar gauge visualization with value mappings. The value mapping colors are applied to the text, but not to the gauges.
|
||||
The following image shows a bar gauge visualization with value mappings. Note that the value mapping colors are applied to the text, but not to the gauges.
|
||||
|
||||

|
||||
|
||||
@@ -73,64 +94,67 @@ The following image shows a table visualization with value mappings. If you want
|
||||
|
||||

|
||||
|
||||
## Map a value
|
||||
## Add a value mapping
|
||||
|
||||
Map a value when you want to format a single value.
|
||||
1. Navigate to the panel you want to update.
|
||||
1. Hover over any part of the panel you want to work on to display the menu on the top right corner.
|
||||
1. Click the menu and select **Edit**.
|
||||
1. Scroll to the **Value mappings** section and expand it.
|
||||
1. Click **Add value mappings**.
|
||||
1. Click **Add a new mapping** and then select one of the following:
|
||||
|
||||
- **Value** - Enter a single value to match.
|
||||
- **Range** - Enter the beginning and ending values of a range to match.
|
||||
- **Regex** - Enter a regular expression pattern to match.
|
||||
- **Special** - Select a special value to match.
|
||||
|
||||
1. Open a panel for which you want to map a value.
|
||||
1. In panel display options, locate the **Value mappings** section and click **Add value mappings**.
|
||||
1. Click **Add a new mapping** and then select **Value**.
|
||||
1. Enter the value for Grafana to match.
|
||||
1. (Optional) Enter display text.
|
||||
1. (Optional) Set the color.
|
||||
1. (Optional) Set an icon (canvas visualizations only).
|
||||
1. Click **Update** to save the value mapping.
|
||||
|
||||

|
||||
After you've added a mapping, the **Edit value mappings** button replaces the **Add value mappings** button. Click the edit button to add or update mappings.
|
||||
|
||||
## Map a range
|
||||
{{% docs/reference %}}
|
||||
[bar chart]: "/docs/grafana/ -> /docs/grafana/<GRAFANA VERSION>/panels-visualizations/visualizations/bar-chart"
|
||||
[bar chart]: "/docs/grafana-cloud/ -> /docs/grafana-cloud/visualizations/panels-visualizations/visualizations/bar-chart"
|
||||
|
||||
Map a range of values when you want to format multiple, continuous values.
|
||||
[bar gauge]: "/docs/grafana/ -> /docs/grafana/<GRAFANA VERSION>/panels-visualizations/visualizations/bar-gauge"
|
||||
[bar gauge]: "/docs/grafana-cloud/ -> /docs/grafana-cloud/visualizations/panels-visualizations/visualizations/bar-gauge"
|
||||
|
||||
1. Edit the panel for which you want to map a range of values.
|
||||
1. In panel display options, in the **Value mappings** section, click **Add value mappings**.
|
||||
1. Click **Add a new mapping** and then select **Range**.
|
||||
1. Enter the beginning and ending values in the range for Grafana to match.
|
||||
1. (Optional) Enter display text.
|
||||
1. (Optional) Set the color.
|
||||
1. Click **Update** to save the value mapping.
|
||||
[candlestick]: "/docs/grafana/ -> /docs/grafana/<GRAFANA VERSION>/panels-visualizations/visualizations/candlestick"
|
||||
[candlestick]: "/docs/grafana-cloud/ -> /docs/grafana-cloud/visualizations/panels-visualizations/visualizations/candlestick"
|
||||
|
||||

|
||||
[canvas]: "/docs/grafana/ -> /docs/grafana/<GRAFANA VERSION>/panels-visualizations/visualizations/canvas"
|
||||
[canvas]: "/docs/grafana-cloud/ -> /docs/grafana-cloud/visualizations/panels-visualizations/visualizations/canvas"
|
||||
|
||||
## Map a regular expression
|
||||
[gauge]: "/docs/grafana/ -> /docs/grafana/<GRAFANA VERSION>/panels-visualizations/visualizations/gauge"
|
||||
[gauge]: "/docs/grafana-cloud/ -> /docs/grafana-cloud/visualizations/panels-visualizations/visualizations/gauge"
|
||||
|
||||
Map a regular expression when you want to format the text and color of a regular expression value.
|
||||
[geomap]: "/docs/grafana/ -> /docs/grafana/<GRAFANA VERSION>/panels-visualizations/visualizations/geomap"
|
||||
[geomap]: "/docs/grafana-cloud/ -> /docs/grafana-cloud/visualizations/panels-visualizations/visualizations/geomap"
|
||||
|
||||
1. Edit the panel for which you want to map a regular expression.
|
||||
1. In the **Value mappings** section of the panel display options, click **Add value mappings**.
|
||||
1. Click **Add a new mapping** and then select **Regex**.
|
||||
1. Enter the regular expression pattern for Grafana to match.
|
||||
1. (Optional) Enter display text.
|
||||
1. (Optional) Set the color.
|
||||
1. Click **Update** to save the value mapping.
|
||||
[histogram]: "/docs/grafana/ -> /docs/grafana/<GRAFANA VERSION>/panels-visualizations/visualizations/histogram"
|
||||
[histogram]: "/docs/grafana-cloud/ -> /docs/grafana-cloud/visualizations/panels-visualizations/visualizations/histogram"
|
||||
|
||||
## Map a special value
|
||||
[pie chart]: "/docs/grafana/ -> /docs/grafana/<GRAFANA VERSION>/panels-visualizations/visualizations/pie-chart"
|
||||
[pie chart]: "/docs/grafana-cloud/ -> /docs/grafana-cloud/visualizations/panels-visualizations/visualizations/pie-chart"
|
||||
|
||||
Map a special value when you want to format uncommon, boolean, or empty values.
|
||||
[stat]: "/docs/grafana/ -> /docs/grafana/<GRAFANA VERSION>/panels-visualizations/visualizations/stat"
|
||||
[stat]: "/docs/grafana-cloud/ -> /docs/grafana-cloud/visualizations/panels-visualizations/visualizations/stat"
|
||||
|
||||
1. Edit the panel for which you want to map a special value.
|
||||
1. In panel display options, locate the **Value mappings** section and click **Add value mappings**.
|
||||
1. Click **Add a new mapping** and then select **Special**.
|
||||
1. Select the special value for Grafana to match.
|
||||
1. (Optional) Enter display text.
|
||||
1. (Optional) Set the color.
|
||||
1. Click **Update** to save the value mapping.
|
||||
[state timeline]: "/docs/grafana/ -> /docs/grafana/<GRAFANA VERSION>/panels-visualizations/visualizations/state-timeline"
|
||||
[state timeline]: "/docs/grafana-cloud/ -> /docs/grafana-cloud/visualizations/panels-visualizations/visualizations/state-timeline"
|
||||
|
||||

|
||||
[status history]: "/docs/grafana/ -> /docs/grafana/<GRAFANA VERSION>/panels-visualizations/visualizations/status-history"
|
||||
[status history]: "/docs/grafana-cloud/ -> /docs/grafana-cloud/visualizations/panels-visualizations/visualizations/status-history"
|
||||
|
||||
## Edit a value mapping
|
||||
[table]: "/docs/grafana/ -> /docs/grafana/<GRAFANA VERSION>/panels-visualizations/visualizations/table"
|
||||
[table]: "/docs/grafana-cloud/ -> /docs/grafana-cloud/visualizations/panels-visualizations/visualizations/table"
|
||||
|
||||
You can edit a value mapping at any time.
|
||||
[time series]: "/docs/grafana/ -> /docs/grafana/<GRAFANA VERSION>/panels-visualizations/visualizations/time-series"
|
||||
[time series]: "/docs/grafana-cloud/ -> /docs/grafana-cloud/visualizations/panels-visualizations/visualizations/time-series"
|
||||
|
||||
1. Edit the panel that contains the value mapping you want to edit.
|
||||
1. In the panel display options, in the **Value mappings** section, click **Edit value mappings**.
|
||||
1. Make the changes and click **Update**.
|
||||
[trend]: "/docs/grafana/ -> /docs/grafana/<GRAFANA VERSION>/panels-visualizations/visualizations/trend"
|
||||
[trend]: "/docs/grafana-cloud/ -> /docs/grafana-cloud/visualizations/panels-visualizations/visualizations/trend"
|
||||
{{% /docs/reference %}}
|
||||
|
||||
@@ -21,7 +21,8 @@ The Dashboard data source lets you select a panel in your dashboard that contain
|
||||
This strategy can drastically reduce the number of queries being made when you for example have several panels visualizing the same data.
|
||||
|
||||
1. [Create a dashboard][].
|
||||
1. Change the title to "Source panel". You'll use this panel as a source for the other panels.
|
||||
1. Create a panel.
|
||||
1. Change the panel title to "Source panel". You'll use this panel as a source for the other panels.
|
||||
1. Define the [query][] or queries that you want share.
|
||||
|
||||
If you don't have a data source available, use the **Grafana** data source, which returns a random time series that you can use for testing.
|
||||
|
||||
Some files were not shown because too many files have changed in this diff Show More
Reference in New Issue
Block a user