mirror of
https://github.com/grafana/grafana.git
synced 2026-01-07 17:33:22 +08:00
Compare commits
1527 Commits
| Author | SHA1 | Date | |
|---|---|---|---|
|
|
c114c46119 | ||
|
|
bbe191a975 | ||
|
|
f8326c29f9 | ||
|
|
491e6897e7 | ||
|
|
5b74bea476 | ||
|
|
314bff1b78 | ||
|
|
9c30bf53cf | ||
|
|
4bc6ecb241 | ||
|
|
6372e22180 | ||
|
|
f842265388 | ||
|
|
bf138d1845 | ||
|
|
c177a9a77a | ||
|
|
6d22a67a30 | ||
|
|
6b1ae1a8a8 | ||
|
|
dd9d4ecfbe | ||
|
|
fca80ff525 | ||
|
|
2de94d6548 | ||
|
|
788f677ed7 | ||
|
|
d6b8c6a2d2 | ||
|
|
c1ef89d3bf | ||
|
|
aa24839ac9 | ||
|
|
337fb9bdfa | ||
|
|
512535e8ff | ||
|
|
4e719aa0c1 | ||
|
|
29de6387cb | ||
|
|
a76f3fba2e | ||
|
|
d71456b96f | ||
|
|
85bd1861d6 | ||
|
|
1a53d6453b | ||
|
|
10f058036c | ||
|
|
73248d6687 | ||
|
|
b349b3ef55 | ||
|
|
dd67c9d420 | ||
|
|
968ba30fa5 | ||
|
|
379f984293 | ||
|
|
3c16230158 | ||
|
|
fd76c855f9 | ||
|
|
e16cadaa27 | ||
|
|
665fef0114 | ||
|
|
ff4cd1aef6 | ||
|
|
0e18c82d95 | ||
|
|
a7b0a01b13 | ||
|
|
18cfe1b192 | ||
|
|
f6100dd8eb | ||
|
|
ee4bbf61a9 | ||
|
|
7164183739 | ||
|
|
90602942f5 | ||
|
|
6e344f6eea | ||
|
|
057b8a6b2d | ||
|
|
e5f84484eb | ||
|
|
b1580bf385 | ||
|
|
293daf2ca1 | ||
|
|
75c4c4d8b5 | ||
|
|
2953d64429 | ||
|
|
4b851de648 | ||
|
|
1076b75a21 | ||
|
|
b1506a2b09 | ||
|
|
e13575eaef | ||
|
|
7c566a6539 | ||
|
|
d971eddc7a | ||
|
|
ce0de35a6c | ||
|
|
93be16b106 | ||
|
|
8ec33574a1 | ||
|
|
de647c4100 | ||
|
|
51d021a337 | ||
|
|
7dc6d67d46 | ||
|
|
62979916ad | ||
|
|
4670c74942 | ||
|
|
c9a30ef149 | ||
|
|
9dac602e98 | ||
|
|
652fce7e76 | ||
|
|
e98254e1e3 | ||
|
|
4446e95155 | ||
|
|
5d4b8b5a5c | ||
|
|
095ac80d19 | ||
|
|
9451e6af39 | ||
|
|
82d365bdb8 | ||
|
|
ec64dc8fae | ||
|
|
b333ad9481 | ||
|
|
22be9436f7 | ||
|
|
bc690232fb | ||
|
|
0005f8e7b3 | ||
|
|
4e387ed47a | ||
|
|
52676161bb | ||
|
|
01e2729dba | ||
|
|
a1faa6d4d9 | ||
|
|
1a3d34b918 | ||
|
|
5d3c3a6889 | ||
|
|
4eabf6ce81 | ||
|
|
2789c4f1e1 | ||
|
|
9bafb108f7 | ||
|
|
88e4b6ee75 | ||
|
|
2fc67da69a | ||
|
|
6e4090abf2 | ||
|
|
284cacf560 | ||
|
|
c5400ffe76 | ||
|
|
c3cffeb10c | ||
|
|
ce6050f5d6 | ||
|
|
07e192ff47 | ||
|
|
e8e1f1bc6d | ||
|
|
40c008f870 | ||
|
|
66441650cd | ||
|
|
91fb3f2224 | ||
|
|
7b1473649b | ||
|
|
eb0f5cc900 | ||
|
|
84d4958a3c | ||
|
|
40ae2cef38 | ||
|
|
52177a45d9 | ||
|
|
bdfbc2453f | ||
|
|
9b60a63778 | ||
|
|
abeaef71cc | ||
|
|
54129b1340 | ||
|
|
dda1cf1a88 | ||
|
|
bdb1cfb008 | ||
|
|
c5c5fa0db3 | ||
|
|
78ea1ea76e | ||
|
|
bdd239e933 | ||
|
|
aef4eca254 | ||
|
|
74ddebc8ea | ||
|
|
546f903141 | ||
|
|
c2b05341e5 | ||
|
|
c92317bafa | ||
|
|
407f1ad475 | ||
|
|
ead7ae7635 | ||
|
|
311fa66590 | ||
|
|
72690b3962 | ||
|
|
62f5770908 | ||
|
|
bf110d02d1 | ||
|
|
e91cf28f8d | ||
|
|
3b9fbd60d8 | ||
|
|
ad14ccf4bd | ||
|
|
9375441991 | ||
|
|
ef3c543620 | ||
|
|
54f932e960 | ||
|
|
451ecce4ab | ||
|
|
ef162c3dc7 | ||
|
|
3eea5d235d | ||
|
|
d6085755c4 | ||
|
|
a0cb744746 | ||
|
|
dc7616e560 | ||
|
|
f7ec8e0de0 | ||
|
|
47f8145246 | ||
|
|
71c22fdbff | ||
|
|
71c9582944 | ||
|
|
632a5e9b97 | ||
|
|
3c9798bec9 | ||
|
|
bf4ffe41b0 | ||
|
|
e763104a6f | ||
|
|
4f9fbcc211 | ||
|
|
bcb3dfac9f | ||
|
|
8bf49c51b9 | ||
|
|
0ba5706400 | ||
|
|
63d6ab476a | ||
|
|
d19aa89ec0 | ||
|
|
bbf9d7677b | ||
|
|
a31d0df897 | ||
|
|
5c2958023d | ||
|
|
7b5019482e | ||
|
|
649122b4fb | ||
|
|
e3bd51e38d | ||
|
|
73f0bd3b4b | ||
|
|
3222677493 | ||
|
|
020aae1427 | ||
|
|
17cb3f6e6a | ||
|
|
d4dd0222fa | ||
|
|
167995776f | ||
|
|
02248273ae | ||
|
|
c4feef2541 | ||
|
|
5420f271f1 | ||
|
|
776e6e2c3f | ||
|
|
679ddc9696 | ||
|
|
b716a2595a | ||
|
|
d8d59fd8d4 | ||
|
|
c7959ff06e | ||
|
|
d2437d3cf1 | ||
|
|
b260a642e7 | ||
|
|
e75b39376a | ||
|
|
6b5400bdb6 | ||
|
|
149e694ce6 | ||
|
|
0b2cc404ff | ||
|
|
b9540e4c49 | ||
|
|
43fa852cc1 | ||
|
|
1105bb371f | ||
|
|
59513ff963 | ||
|
|
459a8ed695 | ||
|
|
80f5c914e8 | ||
|
|
68cac6ccb5 | ||
|
|
668cb3c1ef | ||
|
|
e8a20643d6 | ||
|
|
5c0773023f | ||
|
|
1c8c746956 | ||
|
|
eac0d30e99 | ||
|
|
26ad025705 | ||
|
|
aa670244f1 | ||
|
|
e0bbb74b0c | ||
|
|
0e0e60317e | ||
|
|
152c4170da | ||
|
|
1652426dfe | ||
|
|
68c4ce34d5 | ||
|
|
fec41cf038 | ||
|
|
fee1e6df41 | ||
|
|
addeccb4f0 | ||
|
|
a47b31ac62 | ||
|
|
cd16db4d09 | ||
|
|
563795245a | ||
|
|
59d1654df4 | ||
|
|
2fb25d8fa4 | ||
|
|
a8ac215039 | ||
|
|
eb944551c0 | ||
|
|
928fedaad7 | ||
|
|
d3680d290c | ||
|
|
83beff300b | ||
|
|
64b5153e7d | ||
|
|
781dd25c82 | ||
|
|
f979e95820 | ||
|
|
1507c02ebb | ||
|
|
7c14ade623 | ||
|
|
7031f7e772 | ||
|
|
bf8171fd63 | ||
|
|
b74fe05fec | ||
|
|
ecb66e7678 | ||
|
|
e4dabb657c | ||
|
|
48fa642727 | ||
|
|
3e392ef921 | ||
|
|
0e2b809f7e | ||
|
|
4fe79edd40 | ||
|
|
35522c475f | ||
|
|
92f71136e6 | ||
|
|
ee835242ca | ||
|
|
def45f55da | ||
|
|
54c79c5648 | ||
|
|
649fe7e462 | ||
|
|
0d25357367 | ||
|
|
aa889e59a1 | ||
|
|
d285045ff6 | ||
|
|
132cd36b0c | ||
|
|
1e5778174c | ||
|
|
c082372ffe | ||
|
|
4f9cfcd632 | ||
|
|
0bd03098ea | ||
|
|
ee297487a5 | ||
|
|
8930e04f2b | ||
|
|
97d1676fe8 | ||
|
|
f547c93a4f | ||
|
|
58528a951a | ||
|
|
6e0f767af7 | ||
|
|
0a23f3dd28 | ||
|
|
26766ddb27 | ||
|
|
c0b0a54a8f | ||
|
|
8e618bc169 | ||
|
|
6131347806 | ||
|
|
ef0c90b9ca | ||
|
|
1ce134cc6f | ||
|
|
8f5fbb4254 | ||
|
|
c7ca4830a8 | ||
|
|
1372d2e517 | ||
|
|
77b7f4b376 | ||
|
|
c7e8b98d14 | ||
|
|
8d7186d40d | ||
|
|
3dc9d76b38 | ||
|
|
a5bdfec0de | ||
|
|
b5017d1e18 | ||
|
|
b241b98196 | ||
|
|
a5d5f3d82f | ||
|
|
c17b5d1306 | ||
|
|
ede827f5c0 | ||
|
|
6224a25e42 | ||
|
|
f7ea08dba7 | ||
|
|
814d164e5b | ||
|
|
663a3293ee | ||
|
|
b01a4e6583 | ||
|
|
f64ebf538c | ||
|
|
91a921e12d | ||
|
|
e72baca4a7 | ||
|
|
2aa26c98b6 | ||
|
|
ae3e869d70 | ||
|
|
deab5a54bf | ||
|
|
ecfe28d7ac | ||
|
|
9fb22ef86c | ||
|
|
5d2054323b | ||
|
|
1e4b0f01d6 | ||
|
|
6d9cbdd59e | ||
|
|
c4eadb576e | ||
|
|
7de1c0eaa2 | ||
|
|
73a1a262ef | ||
|
|
e9989cb690 | ||
|
|
0fcc87010a | ||
|
|
91a533d948 | ||
|
|
ede6d71e72 | ||
|
|
4d82a1076a | ||
|
|
44fbd3ec9f | ||
|
|
c79a68dcd1 | ||
|
|
55b24be115 | ||
|
|
bf7516d9bf | ||
|
|
81dc64d4ec | ||
|
|
c7c5730c40 | ||
|
|
34cda65998 | ||
|
|
61d8eb1fac | ||
|
|
d630f3d59e | ||
|
|
06e87c151f | ||
|
|
73563d087c | ||
|
|
23558c61d4 | ||
|
|
ef9dd014c7 | ||
|
|
5406481e7b | ||
|
|
510ad001b4 | ||
|
|
0c70d271dc | ||
|
|
417c5163dd | ||
|
|
5542309170 | ||
|
|
6b344d0158 | ||
|
|
22758d5112 | ||
|
|
7b768bca3f | ||
|
|
c4683f1ae8 | ||
|
|
cb8ecb2d5f | ||
|
|
ce4939bd56 | ||
|
|
d46fd890a5 | ||
|
|
8ca08d65e7 | ||
|
|
f5ed5c6529 | ||
|
|
9825cd1ebb | ||
|
|
0f33ac9e10 | ||
|
|
24a79a6bea | ||
|
|
723f5bc9e8 | ||
|
|
287c222fc7 | ||
|
|
6956110497 | ||
|
|
f500dfd1e5 | ||
|
|
cd0e1a8978 | ||
|
|
2d2800e710 | ||
|
|
4a678c2884 | ||
|
|
1a25b78ef2 | ||
|
|
bbfdfc012f | ||
|
|
b16b649c9b | ||
|
|
9d50ab8fb5 | ||
|
|
af56cc4c28 | ||
|
|
e8157f01ec | ||
|
|
aecc6860e3 | ||
|
|
9bbc942534 | ||
|
|
13c966c178 | ||
|
|
4073949af0 | ||
|
|
a6920eb2ff | ||
|
|
32f9a42d5e | ||
|
|
c5f6cf0809 | ||
|
|
a045f175b6 | ||
|
|
17d57ab074 | ||
|
|
74984f8da6 | ||
|
|
e4950c2dc1 | ||
|
|
4844bf9be3 | ||
|
|
43974898c1 | ||
|
|
bb3bcbe6a1 | ||
|
|
228c210379 | ||
|
|
92937c591f | ||
|
|
89822acf38 | ||
|
|
2d99518f90 | ||
|
|
5bffdfe9a4 | ||
|
|
f8d22385ce | ||
|
|
1dedc886f2 | ||
|
|
1ccfca109f | ||
|
|
68e7219135 | ||
|
|
3a075be7e9 | ||
|
|
fc82de1543 | ||
|
|
c296e73b83 | ||
|
|
a622c55b1b | ||
|
|
e6f9546a7c | ||
|
|
fe3bcd3678 | ||
|
|
cff1c37064 | ||
|
|
e5b499a958 | ||
|
|
1994b767d3 | ||
|
|
eca11e862e | ||
|
|
fbff905c57 | ||
|
|
a4266319ad | ||
|
|
49113c1ccb | ||
|
|
6d4c29ea9b | ||
|
|
ab53b05c39 | ||
|
|
ba1c79b7a8 | ||
|
|
de9ebc9a74 | ||
|
|
9341412acc | ||
|
|
16cda723d3 | ||
|
|
36a1ab48c5 | ||
|
|
3583057155 | ||
|
|
1940b33dc1 | ||
|
|
d20455ab5f | ||
|
|
934c0fea6f | ||
|
|
c1c1bcb874 | ||
|
|
1da98f5e1e | ||
|
|
74093c700f | ||
|
|
f773a9b4c3 | ||
|
|
205be91a84 | ||
|
|
109fd998ed | ||
|
|
a5afd8152d | ||
|
|
3ae5f7c632 | ||
|
|
a71423481b | ||
|
|
20a2334c87 | ||
|
|
6f4c7a4d65 | ||
|
|
e269b3b2a0 | ||
|
|
1499c2bf74 | ||
|
|
b8aa203707 | ||
|
|
1fd7b60efe | ||
|
|
fb99ddf295 | ||
|
|
8683aff3e9 | ||
|
|
7ea5930a90 | ||
|
|
97a7081b57 | ||
|
|
8634c9d457 | ||
|
|
3ac306a72e | ||
|
|
91ad260517 | ||
|
|
8973b48f96 | ||
|
|
1a61d2814c | ||
|
|
b674b9dba2 | ||
|
|
83fbace6b9 | ||
|
|
12644372c4 | ||
|
|
c12a7d7f59 | ||
|
|
7c840cdf38 | ||
|
|
b63d2b3279 | ||
|
|
8e5672aee6 | ||
|
|
53ea9cfbcf | ||
|
|
1deeef9e91 | ||
|
|
10127e8ac9 | ||
|
|
8c8b1dde8a | ||
|
|
e8d01218d8 | ||
|
|
5aac2d2078 | ||
|
|
60da730c95 | ||
|
|
73fcc919cd | ||
|
|
be29357d22 | ||
|
|
86a73c359b | ||
|
|
a3d22ae9c7 | ||
|
|
b54b43a42e | ||
|
|
bc6a57ce32 | ||
|
|
2479e51a6b | ||
|
|
2a93bed453 | ||
|
|
eaba985f25 | ||
|
|
77136d7a70 | ||
|
|
8440d2d0a2 | ||
|
|
41d300f69d | ||
|
|
9a7e460865 | ||
|
|
8626bdfed8 | ||
|
|
1f4140057b | ||
|
|
0eb297822c | ||
|
|
ad080af38f | ||
|
|
49fdbb3843 | ||
|
|
724368d0cd | ||
|
|
25f88e9b3a | ||
|
|
39ffb04be1 | ||
|
|
056c57d551 | ||
|
|
5d63ad21c1 | ||
|
|
a49e82e447 | ||
|
|
e9c8881d54 | ||
|
|
840099bec0 | ||
|
|
76c4bfe268 | ||
|
|
5f3b5fdcb2 | ||
|
|
6a95df403a | ||
|
|
380e7e7f04 | ||
|
|
581b977787 | ||
|
|
c771dd4bd2 | ||
|
|
cb720d8eaf | ||
|
|
9ff4ab1236 | ||
|
|
1f92e589e8 | ||
|
|
812ac5cb8e | ||
|
|
7d642546b3 | ||
|
|
192c447c2c | ||
|
|
d10d897d65 | ||
|
|
6992b484bc | ||
|
|
cdd5ba6198 | ||
|
|
6c04057285 | ||
|
|
217c746445 | ||
|
|
95c8a76aa6 | ||
|
|
a8e9700334 | ||
|
|
50b09f4f10 | ||
|
|
2c75593c1a | ||
|
|
3c41d0477a | ||
|
|
f7c48c5a5f | ||
|
|
c5d5d7ac5a | ||
|
|
71b62f5cf9 | ||
|
|
922073a357 | ||
|
|
aa3a737fea | ||
|
|
f0169656ba | ||
|
|
525da95f49 | ||
|
|
01ff3bbe0a | ||
|
|
61bdc91272 | ||
|
|
08b37186a5 | ||
|
|
5225e4283f | ||
|
|
e7e675e471 | ||
|
|
391dc1e225 | ||
|
|
46412c8475 | ||
|
|
3ba8aeb9a7 | ||
|
|
64d620c987 | ||
|
|
f4debbf501 | ||
|
|
56b3c4a3a0 | ||
|
|
577dfee086 | ||
|
|
8f6c9c5946 | ||
|
|
ef1dfed0d8 | ||
|
|
948e5ae74d | ||
|
|
c4e872b9da | ||
|
|
7b5f7ed553 | ||
|
|
5409f4c0eb | ||
|
|
9b629cd5a6 | ||
|
|
546d489dd3 | ||
|
|
88da3a99e1 | ||
|
|
689e366f59 | ||
|
|
e2061312f5 | ||
|
|
e43d09e15b | ||
|
|
746d6cdc88 | ||
|
|
9c1401849e | ||
|
|
2a52e25d5b | ||
|
|
cabbfe9adc | ||
|
|
f18ebea03e | ||
|
|
82d4d54dc5 | ||
|
|
c87418d060 | ||
|
|
12219cffe0 | ||
|
|
c296ae1178 | ||
|
|
e18007153d | ||
|
|
1b79e17970 | ||
|
|
fdfcd5cbf0 | ||
|
|
bab21c9069 | ||
|
|
f3980504e2 | ||
|
|
1efdd92ae8 | ||
|
|
7c1dc2444d | ||
|
|
f224fd8310 | ||
|
|
4fe9935321 | ||
|
|
d996275f8f | ||
|
|
d2eca2faa1 | ||
|
|
045f5e11fc | ||
|
|
d55cc4e2a3 | ||
|
|
966c2912fc | ||
|
|
d47c47853a | ||
|
|
3bea304bab | ||
|
|
e9d5e037e8 | ||
|
|
77c046aac6 | ||
|
|
1bdf82dca3 | ||
|
|
6783d1000c | ||
|
|
95a4ec8bf2 | ||
|
|
ed4d170bcc | ||
|
|
812958162a | ||
|
|
cd3807055e | ||
|
|
26ec874fb1 | ||
|
|
e4cb103966 | ||
|
|
5c1833de1f | ||
|
|
f16e3e38ee | ||
|
|
d318c9093f | ||
|
|
c95162e067 | ||
|
|
0d865a83bc | ||
|
|
980b9b5ca0 | ||
|
|
371625aeec | ||
|
|
beced6f3a6 | ||
|
|
5e0b03928e | ||
|
|
0d39852ef4 | ||
|
|
ab44c7d63e | ||
|
|
ed2092e287 | ||
|
|
c0d5b61403 | ||
|
|
7004a84c30 | ||
|
|
c2885430bd | ||
|
|
e65f86147f | ||
|
|
c17d02e496 | ||
|
|
ee0d0155a5 | ||
|
|
f484b4c347 | ||
|
|
3292a48381 | ||
|
|
8422697199 | ||
|
|
a927b893ae | ||
|
|
e6616cc551 | ||
|
|
60d5d5fb15 | ||
|
|
68397d342b | ||
|
|
09267bbfe8 | ||
|
|
0a1c2a7024 | ||
|
|
b6e46c9eb8 | ||
|
|
d1d47b5697 | ||
|
|
90871ca12e | ||
|
|
896f849b84 | ||
|
|
ac28c4b233 | ||
|
|
8b7a0100b1 | ||
|
|
dcf7385cc1 | ||
|
|
090594a0bc | ||
|
|
007c08f2a8 | ||
|
|
2d29d7b3d6 | ||
|
|
3133721422 | ||
|
|
28bff0c1f3 | ||
|
|
b17a1ed557 | ||
|
|
e6d79dfedf | ||
|
|
5740702cb5 | ||
|
|
a5318def66 | ||
|
|
634ee0f9fa | ||
|
|
6541ffe045 | ||
|
|
12c8bf9b18 | ||
|
|
d4048e1423 | ||
|
|
6257fbced6 | ||
|
|
330cb92b24 | ||
|
|
befc15c5a1 | ||
|
|
3695337980 | ||
|
|
648e8a9547 | ||
|
|
1e3a42ca68 | ||
|
|
21e61319f1 | ||
|
|
48fdfe721e | ||
|
|
423ad4d36e | ||
|
|
bd8a0be3aa | ||
|
|
d9c6f7a141 | ||
|
|
044668a395 | ||
|
|
90dbd4978b | ||
|
|
359421b5e8 | ||
|
|
73cb035231 | ||
|
|
d47078e27f | ||
|
|
5e33b5fcfa | ||
|
|
c34db77f04 | ||
|
|
7c50563f0f | ||
|
|
a64c06d02c | ||
|
|
966cefc8d0 | ||
|
|
a0b9dcad4d | ||
|
|
370db82238 | ||
|
|
20e631a22d | ||
|
|
6d3246e39e | ||
|
|
d4264cbfc2 | ||
|
|
f7215608e9 | ||
|
|
7cb6466251 | ||
|
|
d840645dd7 | ||
|
|
a8673a2e33 | ||
|
|
4a2c405ac0 | ||
|
|
499e01d832 | ||
|
|
5e090b84ec | ||
|
|
b8aa6a8e47 | ||
|
|
912301fe24 | ||
|
|
5909f9ef92 | ||
|
|
5fcb966297 | ||
|
|
6ad1a396a5 | ||
|
|
5513d3c9d1 | ||
|
|
878121bb46 | ||
|
|
9045be5689 | ||
|
|
9c35d3f87c | ||
|
|
f7a6c9a1e6 | ||
|
|
f65878c21d | ||
|
|
78dbb4dc13 | ||
|
|
d5481fa0f1 | ||
|
|
59f3cca135 | ||
|
|
8918922179 | ||
|
|
43d5525aaa | ||
|
|
fbc3e0371d | ||
|
|
86ce3d5e45 | ||
|
|
4182acda58 | ||
|
|
16fb7a2e4a | ||
|
|
f5118ced4d | ||
|
|
ab874cd037 | ||
|
|
540ee35393 | ||
|
|
e61b392916 | ||
|
|
87f5222907 | ||
|
|
d261f33c3d | ||
|
|
972be88569 | ||
|
|
fc146fe54e | ||
|
|
8e03f321eb | ||
|
|
9dc220b8e2 | ||
|
|
48cf58e739 | ||
|
|
c713bd9a9a | ||
|
|
820671d6cc | ||
|
|
02c79a6389 | ||
|
|
e8b798914d | ||
|
|
8b11712f5e | ||
|
|
f84dc24fcb | ||
|
|
f697f81950 | ||
|
|
fd969bf659 | ||
|
|
9566197620 | ||
|
|
fd5fc0b7ab | ||
|
|
fcbe306628 | ||
|
|
88d4fde815 | ||
|
|
a73f664d54 | ||
|
|
3a892727b3 | ||
|
|
a9c535e551 | ||
|
|
375e60750e | ||
|
|
17198807c9 | ||
|
|
910e54d75e | ||
|
|
5076460254 | ||
|
|
2e7ac8f2da | ||
|
|
5e85558e9e | ||
|
|
88672389f3 | ||
|
|
2c3f3dffa3 | ||
|
|
2c5563442f | ||
|
|
f976e465c4 | ||
|
|
4ce0bf4d16 | ||
|
|
ab6740c685 | ||
|
|
30b6c3b54a | ||
|
|
b2c14b858e | ||
|
|
8c9cc4fae1 | ||
|
|
1d4338ba54 | ||
|
|
0a68dabb89 | ||
|
|
d6eefcb5ce | ||
|
|
ee8799de88 | ||
|
|
4a35126bf6 | ||
|
|
f350ae242b | ||
|
|
c21f86f6b4 | ||
|
|
d791f902e9 | ||
|
|
b054b1faac | ||
|
|
acff78d421 | ||
|
|
8bbff2c44e | ||
|
|
e218052a90 | ||
|
|
84141eb14a | ||
|
|
79120a0b1f | ||
|
|
8d072de556 | ||
|
|
fdc97010b4 | ||
|
|
25a267a7ab | ||
|
|
f168c9e53d | ||
|
|
076a94560b | ||
|
|
be284adacc | ||
|
|
556829eda9 | ||
|
|
823b40a360 | ||
|
|
e2f0b42d90 | ||
|
|
c323d2fc4c | ||
|
|
e8fbfce59a | ||
|
|
0f24b45c1a | ||
|
|
29653d2bec | ||
|
|
fbf39598b8 | ||
|
|
ece21b2d95 | ||
|
|
dd5a426911 | ||
|
|
43c6f74904 | ||
|
|
4412e41738 | ||
|
|
5c9810fba4 | ||
|
|
2479ad262e | ||
|
|
e75bc5d39a | ||
|
|
6ee11f1172 | ||
|
|
f167d459fe | ||
|
|
5acabc6ccb | ||
|
|
b4a8678cae | ||
|
|
61b51c0cbf | ||
|
|
0390a7c17b | ||
|
|
11959f0c4c | ||
|
|
dbcd19bbce | ||
|
|
b7a1ff753a | ||
|
|
0bab1fd088 | ||
|
|
cbba692962 | ||
|
|
e80e0c044b | ||
|
|
e08188929d | ||
|
|
b61de0cddc | ||
|
|
287cd83e76 | ||
|
|
59fdda6559 | ||
|
|
ed8d284715 | ||
|
|
e6c29391c6 | ||
|
|
2304a710bf | ||
|
|
186a5e9d6f | ||
|
|
c57ec23a66 | ||
|
|
b042c53980 | ||
|
|
deab4a378a | ||
|
|
44f76fdabc | ||
|
|
6ebb31bed4 | ||
|
|
c1de972eb5 | ||
|
|
53ccc6f48f | ||
|
|
f43c749422 | ||
|
|
ad3da0f47c | ||
|
|
665cf55e6e | ||
|
|
b4cfb225cf | ||
|
|
ac6c93b3da | ||
|
|
0fd96b951a | ||
|
|
83c138f575 | ||
|
|
02455753b5 | ||
|
|
88dd8af4ce | ||
|
|
4f9f186575 | ||
|
|
c46b73538c | ||
|
|
0ac9ec8f7e | ||
|
|
c6d5259c6d | ||
|
|
26f4a8e5a4 | ||
|
|
a93fa0acde | ||
|
|
b14c3d63e4 | ||
|
|
2361e2ddd9 | ||
|
|
b1691f1cd1 | ||
|
|
24e3777894 | ||
|
|
f5a6c306a6 | ||
|
|
c92d719a72 | ||
|
|
d4f7a2bc99 | ||
|
|
b909cfbde4 | ||
|
|
a0d8afd435 | ||
|
|
f23239650e | ||
|
|
8f4c797399 | ||
|
|
6707d77af5 | ||
|
|
1a3bc60e69 | ||
|
|
9e13c93379 | ||
|
|
dc1178acc8 | ||
|
|
1edeaa5e7e | ||
|
|
d2a22e7b23 | ||
|
|
19a04b7e4a | ||
|
|
f6f2d85aa7 | ||
|
|
6538e86793 | ||
|
|
6d9e8bd147 | ||
|
|
368e847d12 | ||
|
|
fe64ed424e | ||
|
|
b780415f25 | ||
|
|
aee4af2148 | ||
|
|
4720216e5e | ||
|
|
9f462c0519 | ||
|
|
b08b22192b | ||
|
|
c3bad4701a | ||
|
|
87c978ebc9 | ||
|
|
8beb873db4 | ||
|
|
8c448d95a1 | ||
|
|
6ff1144abf | ||
|
|
b489e93d94 | ||
|
|
d085aaad41 | ||
|
|
787fea90b9 | ||
|
|
ae5e004b69 | ||
|
|
c485fed744 | ||
|
|
92d723d6f5 | ||
|
|
9e0acdda23 | ||
|
|
ef36ffb5d0 | ||
|
|
48acffe095 | ||
|
|
09b7516d47 | ||
|
|
16d27a4a8d | ||
|
|
663f7ee239 | ||
|
|
b8259d7583 | ||
|
|
2b029912aa | ||
|
|
7784e4e24b | ||
|
|
413ee33d5d | ||
|
|
d1e6f90f92 | ||
|
|
8f17a84f31 | ||
|
|
253b8be449 | ||
|
|
01fc6da3b2 | ||
|
|
fdc68a8baa | ||
|
|
6ea99540ec | ||
|
|
6160978019 | ||
|
|
a49ef90a1d | ||
|
|
b22b3e5bb9 | ||
|
|
8874be4c66 | ||
|
|
2c51f11440 | ||
|
|
ea53e7221e | ||
|
|
97e2d75f51 | ||
|
|
c78c460f79 | ||
|
|
1bbc149089 | ||
|
|
459d195291 | ||
|
|
6ec1d16327 | ||
|
|
50e70cf3db | ||
|
|
fc878bc8ad | ||
|
|
2cb2c4073e | ||
|
|
4368c5a896 | ||
|
|
f1276774a0 | ||
|
|
98266bd95a | ||
|
|
11806dfa78 | ||
|
|
1e29d4fcfa | ||
|
|
ee3a553800 | ||
|
|
d123b951e9 | ||
|
|
e164eba677 | ||
|
|
7078d5d524 | ||
|
|
62d11c147b | ||
|
|
456b07b766 | ||
|
|
0bae7212f6 | ||
|
|
73718afb79 | ||
|
|
809467955a | ||
|
|
db36639ffc | ||
|
|
3ee886d0fb | ||
|
|
85baa50194 | ||
|
|
473006e8cf | ||
|
|
5dad324ab7 | ||
|
|
7aa992bde4 | ||
|
|
f0816b37bd | ||
|
|
a64e000f1a | ||
|
|
715453204e | ||
|
|
5df82be290 | ||
|
|
f2dffeb543 | ||
|
|
fa2a7db657 | ||
|
|
03ef1fd758 | ||
|
|
60ef7d8768 | ||
|
|
aa47b9bf5c | ||
|
|
b77991f69b | ||
|
|
f490c5f12c | ||
|
|
fb163450a5 | ||
|
|
a151de1d37 | ||
|
|
0335c1f368 | ||
|
|
ea92ddccb3 | ||
|
|
ff426ae9a3 | ||
|
|
dbe5480edc | ||
|
|
2fce88ee62 | ||
|
|
3a607f96a3 | ||
|
|
c68fffcd6d | ||
|
|
2f61fc6afe | ||
|
|
dbeeb32ab6 | ||
|
|
ab99a7c1c7 | ||
|
|
dd3e594dd7 | ||
|
|
9c246ba301 | ||
|
|
2142323da9 | ||
|
|
17d3970673 | ||
|
|
ef99ff0ad7 | ||
|
|
8a1c35e1c2 | ||
|
|
de21be30d2 | ||
|
|
eeb998d712 | ||
|
|
593b2ef866 | ||
|
|
b867921b3b | ||
|
|
0156a94a49 | ||
|
|
aff6aa081c | ||
|
|
d2f3d7d138 | ||
|
|
78f4bd2de9 | ||
|
|
752b42798a | ||
|
|
232513bb4e | ||
|
|
20ac8bf83e | ||
|
|
8eb112d119 | ||
|
|
e80494390a | ||
|
|
b3df1aa9bd | ||
|
|
d2bf2e86ed | ||
|
|
09cec3118f | ||
|
|
d12dc2bfa7 | ||
|
|
07466b6725 | ||
|
|
a109049de4 | ||
|
|
89a7c2c686 | ||
|
|
83e0f69cde | ||
|
|
9099119f62 | ||
|
|
9bdcc4ec5f | ||
|
|
e0640487df | ||
|
|
3ca3c96226 | ||
|
|
f42202e665 | ||
|
|
70bca219e3 | ||
|
|
d553498a33 | ||
|
|
0384eecf5c | ||
|
|
2877ad1a7d | ||
|
|
362860f687 | ||
|
|
997da1b266 | ||
|
|
337b3295bd | ||
|
|
21ae987bcd | ||
|
|
41171f8a5c | ||
|
|
32d34aed7a | ||
|
|
efca9e904d | ||
|
|
1cd632cc43 | ||
|
|
26804d630f | ||
|
|
3b47efe70e | ||
|
|
7ec6e84fe8 | ||
|
|
7e14797b10 | ||
|
|
e6cc5df9d9 | ||
|
|
c219498aab | ||
|
|
f5f0d94ad4 | ||
|
|
a79102b42d | ||
|
|
2b81bfe9bf | ||
|
|
308d46e4ef | ||
|
|
48c4e549f5 | ||
|
|
dd800fd14d | ||
|
|
95e0010a5b | ||
|
|
4a2efb1007 | ||
|
|
ecd404335e | ||
|
|
f77f8ebfc6 | ||
|
|
3ed1600b90 | ||
|
|
39e45004cd | ||
|
|
4445c9ce60 | ||
|
|
5af81b974e | ||
|
|
a7babfb7cf | ||
|
|
bd3f825a6e | ||
|
|
e5a5bef200 | ||
|
|
b18ed0b98f | ||
|
|
d6d2080f11 | ||
|
|
cb136c07b8 | ||
|
|
af0ecd440f | ||
|
|
554f972a25 | ||
|
|
9ddfeaa9c2 | ||
|
|
bd4f073425 | ||
|
|
998f04e1e8 | ||
|
|
3170f0d84a | ||
|
|
34d92b0e79 | ||
|
|
114431beed | ||
|
|
6e304e6e42 | ||
|
|
080d2a2054 | ||
|
|
aada5181fa | ||
|
|
00fcaaf171 | ||
|
|
8f90c6115d | ||
|
|
1ecdf34938 | ||
|
|
c33fa27ed8 | ||
|
|
6965064ea9 | ||
|
|
91c184d3e0 | ||
|
|
3b235612fd | ||
|
|
5702c57452 | ||
|
|
84b15fc74c | ||
|
|
085c4c56b8 | ||
|
|
65a829b64d | ||
|
|
7c5b9f8c5b | ||
|
|
319b8d8fca | ||
|
|
ac39ed4218 | ||
|
|
7770c38e30 | ||
|
|
72e313a3dd | ||
|
|
98554e9fbe | ||
|
|
ac347fa06a | ||
|
|
ece6fd73a1 | ||
|
|
24d4e50343 | ||
|
|
e91a078105 | ||
|
|
dde8583db8 | ||
|
|
c9801595e5 | ||
|
|
09ec8cdebe | ||
|
|
54883e09d5 | ||
|
|
0a56db7745 | ||
|
|
0023657701 | ||
|
|
96e91b5a0f | ||
|
|
68f5e75eba | ||
|
|
44c9ba2edf | ||
|
|
08984448d0 | ||
|
|
77ca62b1bc | ||
|
|
f45d637025 | ||
|
|
5773499dba | ||
|
|
beb85f413a | ||
|
|
79cef75fed | ||
|
|
83d864e7e4 | ||
|
|
6828d35480 | ||
|
|
887867165c | ||
|
|
7864828e75 | ||
|
|
68e6700663 | ||
|
|
8aa00f9227 | ||
|
|
b404f32a09 | ||
|
|
01f646c191 | ||
|
|
7dd09d4185 | ||
|
|
578ba9bbd5 | ||
|
|
362a349d9f | ||
|
|
e99137598e | ||
|
|
5ed7d65b0e | ||
|
|
b21ad3c376 | ||
|
|
a510d85480 | ||
|
|
182a30e22c | ||
|
|
d4f2f41088 | ||
|
|
69bec98962 | ||
|
|
b9940e618c | ||
|
|
0c372f0b85 | ||
|
|
99064603a4 | ||
|
|
5ecc8a171f | ||
|
|
3d3357ee41 | ||
|
|
94498d533b | ||
|
|
65910db991 | ||
|
|
c1c241698a | ||
|
|
adf7645bf5 | ||
|
|
e527aebbf1 | ||
|
|
f78a28395d | ||
|
|
be5c4f47a6 | ||
|
|
3f76d76be6 | ||
|
|
122b4695e7 | ||
|
|
f2e4269242 | ||
|
|
711081950e | ||
|
|
dce63ec1d8 | ||
|
|
54c6699c2b | ||
|
|
970619ed52 | ||
|
|
6f324cd794 | ||
|
|
4d4e165be7 | ||
|
|
a67497e679 | ||
|
|
5785bfe0cc | ||
|
|
87027b0f77 | ||
|
|
50718b592c | ||
|
|
51bdb60296 | ||
|
|
737c29ec8c | ||
|
|
aaf013b360 | ||
|
|
19516ebcce | ||
|
|
5cb51631db | ||
|
|
76fa363613 | ||
|
|
f3cce7efc9 | ||
|
|
38cab50a0c | ||
|
|
7856e2f16b | ||
|
|
32f89f65da | ||
|
|
e9ad71abed | ||
|
|
0b73369c4b | ||
|
|
b05fca4fd7 | ||
|
|
23954f775b | ||
|
|
f42ef5fe17 | ||
|
|
69ff97305f | ||
|
|
967cdd73e1 | ||
|
|
9e27b8ee47 | ||
|
|
98b65641c3 | ||
|
|
0bb8a920ca | ||
|
|
b471e7e448 | ||
|
|
e189400f7c | ||
|
|
b93a2887a8 | ||
|
|
84ef6b9d48 | ||
|
|
891df21969 | ||
|
|
77921c4dcd | ||
|
|
8637207b55 | ||
|
|
2580b61088 | ||
|
|
6799b766a4 | ||
|
|
25318f5848 | ||
|
|
e19b48840f | ||
|
|
28cf229707 | ||
|
|
22553b154a | ||
|
|
9b806bc209 | ||
|
|
58afb1c7d6 | ||
|
|
74c795b294 | ||
|
|
c176de89c9 | ||
|
|
a30cf204d7 | ||
|
|
835d420294 | ||
|
|
952cc1d883 | ||
|
|
2f5814d51c | ||
|
|
7f8a3a0a2d | ||
|
|
aee8f0b75e | ||
|
|
b272f5144a | ||
|
|
073dec8ba8 | ||
|
|
bb2eb00b0e | ||
|
|
be123a07c5 | ||
|
|
04d90d7139 | ||
|
|
b8a82827b9 | ||
|
|
588955c752 | ||
|
|
bd348a47c7 | ||
|
|
4f06202e9a | ||
|
|
61844cb0da | ||
|
|
5037dae959 | ||
|
|
dc6d55a59f | ||
|
|
1cf569ac8e | ||
|
|
555acacd6d | ||
|
|
9efb6e76e9 | ||
|
|
08b2edf98c | ||
|
|
140a0982e8 | ||
|
|
8e3f22d307 | ||
|
|
4ee262fe65 | ||
|
|
70c2586c80 | ||
|
|
a37a2259b3 | ||
|
|
a24ac012c4 | ||
|
|
3735a1ace7 | ||
|
|
125ee865b6 | ||
|
|
b387a8759e | ||
|
|
6ab90425c4 | ||
|
|
c3202d3f99 | ||
|
|
ebdd35d799 | ||
|
|
9f1c6a73f0 | ||
|
|
31866b5e57 | ||
|
|
6af62abd41 | ||
|
|
0264fcc66c | ||
|
|
e71b13d9fa | ||
|
|
c3eb9da160 | ||
|
|
f577dd0f38 | ||
|
|
7ace2463a4 | ||
|
|
fe970f6629 | ||
|
|
26bb9ad399 | ||
|
|
f185c2c953 | ||
|
|
55e0df7896 | ||
|
|
ee190d57eb | ||
|
|
412b8998a8 | ||
|
|
473513aa2f | ||
|
|
c09cd4ba29 | ||
|
|
824357ed3b | ||
|
|
06146b801c | ||
|
|
573bcdde12 | ||
|
|
62eb19a186 | ||
|
|
6b1dd1c7fc | ||
|
|
9b6571fab1 | ||
|
|
1631c8de95 | ||
|
|
3ef077c180 | ||
|
|
1422655e97 | ||
|
|
7d897c0980 | ||
|
|
86789c0b69 | ||
|
|
a763285daa | ||
|
|
d2dac02a28 | ||
|
|
8087af9c89 | ||
|
|
ffe0ecfaaa | ||
|
|
05952688c5 | ||
|
|
03354bc49a | ||
|
|
e73b306e0c | ||
|
|
46ac8c098f | ||
|
|
5d3da99806 | ||
|
|
785cecac26 | ||
|
|
bef216b6f4 | ||
|
|
67b8b9743b | ||
|
|
3ef1a60647 | ||
|
|
d6eaaf3add | ||
|
|
68bb417db9 | ||
|
|
d88286ab81 | ||
|
|
988ed06970 | ||
|
|
73830a44fe | ||
|
|
fe223cbc96 | ||
|
|
fdb06c7c10 | ||
|
|
dea2e5d743 | ||
|
|
607ee635d1 | ||
|
|
b4fd6f2d45 | ||
|
|
c1d69358ba | ||
|
|
9ed1d12cc0 | ||
|
|
c5a76fba87 | ||
|
|
e828f3a97b | ||
|
|
5a30b08b14 | ||
|
|
e3b71ed95e | ||
|
|
9c84b9f944 | ||
|
|
e5f5c1724a | ||
|
|
00dddca26a | ||
|
|
96a3ed0ac3 | ||
|
|
d5245fd19a | ||
|
|
4039e5edbc | ||
|
|
70b36a02af | ||
|
|
99f1c30071 | ||
|
|
b01fd3d0b5 | ||
|
|
1d9b3871fa | ||
|
|
bc9165bdfc | ||
|
|
072c1559ba | ||
|
|
b176f36889 | ||
|
|
38126bc595 | ||
|
|
492b2bd42f | ||
|
|
a4318e41f8 | ||
|
|
48649951e4 | ||
|
|
d2444cbed0 | ||
|
|
400bd8d2d3 | ||
|
|
24474ba41a | ||
|
|
6115941df0 | ||
|
|
5174d050f2 | ||
|
|
ac0d09c419 | ||
|
|
12f1ea71fd | ||
|
|
76f617b862 | ||
|
|
774c1de892 | ||
|
|
5fb4540358 | ||
|
|
79daa71350 | ||
|
|
defa81e4c1 | ||
|
|
cf871b1284 | ||
|
|
52566376b2 | ||
|
|
a32b7dfb9d | ||
|
|
c924510deb | ||
|
|
a747d33373 | ||
|
|
d72011589e | ||
|
|
927b39fa63 | ||
|
|
17d02a7065 | ||
|
|
3c0f61511d | ||
|
|
9b4d95ff25 | ||
|
|
4fcd5eab29 | ||
|
|
902cf5f889 | ||
|
|
bd010289b2 | ||
|
|
f14e25612e | ||
|
|
c8c3021987 | ||
|
|
6dfdcd7ca5 | ||
|
|
8144b73544 | ||
|
|
5fca4c7304 | ||
|
|
8b25ba6a7c | ||
|
|
e573006283 | ||
|
|
79cd48f64c | ||
|
|
6a9247500a | ||
|
|
7520b4f404 | ||
|
|
796957c8c6 | ||
|
|
66445faeb5 | ||
|
|
90cbfacacf | ||
|
|
7dc6b69c8b | ||
|
|
c9d4654592 | ||
|
|
423e8686ef | ||
|
|
e97cab9964 | ||
|
|
5304e7b220 | ||
|
|
76f82b00d7 | ||
|
|
73bec813fc | ||
|
|
6861c6033c | ||
|
|
0c9f664ea0 | ||
|
|
9f80e8c03d | ||
|
|
6761661e10 | ||
|
|
0523830716 | ||
|
|
1c8509ea58 | ||
|
|
7867a24d87 | ||
|
|
05a6cb3f76 | ||
|
|
a1e071d3c5 | ||
|
|
2749dd8711 | ||
|
|
b46fac34d9 | ||
|
|
fc0de84701 | ||
|
|
2ad2b96133 | ||
|
|
2c68c071c0 | ||
|
|
c7560edba5 | ||
|
|
89fdcc84de | ||
|
|
193d468ed3 | ||
|
|
f069aae576 | ||
|
|
e80f673264 | ||
|
|
7f4f38e773 | ||
|
|
143cbe921f | ||
|
|
f147ac053d | ||
|
|
5b7b3fef64 | ||
|
|
28d93b574d | ||
|
|
3c7cf3f728 | ||
|
|
1294b203e6 | ||
|
|
900230890f | ||
|
|
8083079eea | ||
|
|
1e26a8e68a | ||
|
|
0d8cdf0ebe | ||
|
|
dcf097a8b9 | ||
|
|
3d4c3ff00d | ||
|
|
7bf570532f | ||
|
|
6eda5604d2 | ||
|
|
38c29d2209 | ||
|
|
73d441450b | ||
|
|
5dd961c0f5 | ||
|
|
b22881c717 | ||
|
|
c7febca447 | ||
|
|
aa7292fac6 | ||
|
|
c05c6ee7a4 | ||
|
|
bccb650010 | ||
|
|
2b2368b189 | ||
|
|
fbc3c3dd32 | ||
|
|
10508d0238 | ||
|
|
e8f191ef32 | ||
|
|
00549f393c | ||
|
|
0a17217d59 | ||
|
|
8aa5b62d6d | ||
|
|
cbd1455c42 | ||
|
|
53942f7987 | ||
|
|
5bba0c2a94 | ||
|
|
10e100b080 | ||
|
|
b3db5aae4b | ||
|
|
7d205ae2b8 | ||
|
|
8ca4afaf22 | ||
|
|
689f5cb686 | ||
|
|
d1a5d9c15c | ||
|
|
9ece10ef24 | ||
|
|
b386920abb | ||
|
|
a1e835884b | ||
|
|
5e9653f935 | ||
|
|
285918caf6 | ||
|
|
8a92861133 | ||
|
|
abd9233f86 | ||
|
|
3398c28ab2 | ||
|
|
25be602dce | ||
|
|
5a7abe365c | ||
|
|
57d36b3d42 | ||
|
|
80b92335bb | ||
|
|
69566a23fc | ||
|
|
3827c0a69c | ||
|
|
982dc276d3 | ||
|
|
9e7df648b5 | ||
|
|
a36b1d9dce | ||
|
|
c05bc0cb17 | ||
|
|
a3019a9789 | ||
|
|
220b65afd2 | ||
|
|
d9b5628126 | ||
|
|
282b1bc73a | ||
|
|
032ecad3b7 | ||
|
|
457d6c8f81 | ||
|
|
65cf0d0e5c | ||
|
|
3e62b1b2d7 | ||
|
|
a580113de4 | ||
|
|
63aa436997 | ||
|
|
3cbca80d3c | ||
|
|
30c334a2b8 | ||
|
|
aef4195493 | ||
|
|
ea6d996abc | ||
|
|
74c5c5368c | ||
|
|
afd135944a | ||
|
|
18f20a3357 | ||
|
|
01f1c1b8dc | ||
|
|
b600e1c50b | ||
|
|
91999851cb | ||
|
|
4f5dc6104f | ||
|
|
0c46def1a0 | ||
|
|
0e892e9f86 | ||
|
|
513fcdeeb8 | ||
|
|
f602752bdc | ||
|
|
d72f257f27 | ||
|
|
fce2e341d2 | ||
|
|
8a95c563bb | ||
|
|
2594041eed | ||
|
|
9ba1ea0179 | ||
|
|
0c5abc1615 | ||
|
|
5fc5971145 | ||
|
|
436e35c845 | ||
|
|
9a61d43dc6 | ||
|
|
c400b5cf63 | ||
|
|
1a9aaa4138 | ||
|
|
830491fa66 | ||
|
|
3e741315b4 | ||
|
|
bd4eadf69c | ||
|
|
3c304b9b88 | ||
|
|
cefb4103a7 | ||
|
|
dd982ac9a2 | ||
|
|
ac6b5ea796 | ||
|
|
163036591d | ||
|
|
2de8cdb85c | ||
|
|
7307e6345b | ||
|
|
6de13e081b | ||
|
|
91513f0bc0 | ||
|
|
b191638f41 | ||
|
|
2a09d4a5a6 | ||
|
|
edba465a75 | ||
|
|
5b699dbf0d | ||
|
|
cddc9ac0a7 | ||
|
|
1fee26925f | ||
|
|
4b6aaec880 | ||
|
|
a634bd0ce8 | ||
|
|
feed804a0e | ||
|
|
0cc21669f4 | ||
|
|
46e4a54a6e | ||
|
|
1df9c2cab3 | ||
|
|
b3847a3738 | ||
|
|
de7edb40f5 | ||
|
|
2f4da15264 | ||
|
|
a656d01bf5 | ||
|
|
9b8760bad7 | ||
|
|
7c5ef2c75a | ||
|
|
28f890e42f | ||
|
|
23eab81cbe | ||
|
|
e073d20731 | ||
|
|
f196ffa07d | ||
|
|
40d39f8a3e | ||
|
|
fee4846429 | ||
|
|
4e30aa9da2 | ||
|
|
4e1d8c9ced | ||
|
|
b6305a6577 | ||
|
|
d5e753adbc | ||
|
|
3d6698389b | ||
|
|
f7993db73c | ||
|
|
66fa12835a | ||
|
|
6b70fb2729 | ||
|
|
5f0033f3eb | ||
|
|
ac111bc238 | ||
|
|
5be00191ec | ||
|
|
e504e5aaf6 | ||
|
|
1339ce80f5 | ||
|
|
b1888fb8eb | ||
|
|
9b57005540 | ||
|
|
3d5efd3350 | ||
|
|
3d3958e694 | ||
|
|
697d0867fa | ||
|
|
03eb98e94d | ||
|
|
8eae09e5e6 | ||
|
|
cf9790fc4c | ||
|
|
a0c8380baf | ||
|
|
9151b4034a | ||
|
|
9862c9ff40 | ||
|
|
4b8f2aeb36 | ||
|
|
138a79c2fb | ||
|
|
ee58a6ee2b | ||
|
|
a2e6408be1 | ||
|
|
57099f0273 | ||
|
|
09b61caa65 | ||
|
|
f5d8a75381 | ||
|
|
376d2d56bf | ||
|
|
e1b82e72eb | ||
|
|
94e901793a | ||
|
|
96fbe404f8 | ||
|
|
55af92eba1 | ||
|
|
2dd1eb81cd | ||
|
|
4ea4e0436a | ||
|
|
276916cd5d | ||
|
|
ed9595a20d | ||
|
|
e78da57e4d | ||
|
|
0683742e83 | ||
|
|
6f87f88690 | ||
|
|
710d07d7a5 | ||
|
|
c5955bacd2 | ||
|
|
09cec8535e | ||
|
|
d683b0379b | ||
|
|
f29f83ca75 | ||
|
|
3c9357a2e9 | ||
|
|
01c6658a7a | ||
|
|
bfa3c590e7 | ||
|
|
22601fa736 | ||
|
|
76c9f62265 | ||
|
|
06440ef57b | ||
|
|
d4a96b9741 | ||
|
|
dd84fb563a | ||
|
|
51bca7d84b | ||
|
|
839eb97061 | ||
|
|
873a8bc520 | ||
|
|
ee1c15b9cc | ||
|
|
99f18f9d69 | ||
|
|
480a58d377 | ||
|
|
8a8de91a8b | ||
|
|
2fdb47ae97 | ||
|
|
2696d6cd3f | ||
|
|
c73e86e557 | ||
|
|
ae08386ce3 | ||
|
|
92f0a22fd7 | ||
|
|
bd414c1793 | ||
|
|
20bdc48f13 | ||
|
|
f4713956f0 | ||
|
|
eb8d1dfa34 | ||
|
|
62eaa683c0 | ||
|
|
6edbc4604c | ||
|
|
1bc55a2d38 | ||
|
|
e5a6c523d7 | ||
|
|
49fe74228b | ||
|
|
c43bb7fb99 | ||
|
|
2d441bfb37 | ||
|
|
1efeaafdbf | ||
|
|
deff24d2c1 | ||
|
|
d354f3a8af | ||
|
|
0873d493c2 | ||
|
|
bccdd7cad1 | ||
|
|
54c456ec5b | ||
|
|
1672ca4edb | ||
|
|
3df119002d | ||
|
|
13178d99d4 | ||
|
|
9449e93e1e | ||
|
|
80c67267e8 | ||
|
|
92a0b402c5 | ||
|
|
2b932492c2 | ||
|
|
60a2041065 | ||
|
|
915b1efab9 | ||
|
|
9a35d82e51 | ||
|
|
35db025b0a | ||
|
|
821876a85b | ||
|
|
b8b517cd3f | ||
|
|
4b567e35d5 | ||
|
|
f045fbf267 | ||
|
|
9c0f7f547b | ||
|
|
db2718a699 | ||
|
|
1571072c18 | ||
|
|
5ccbe6d40b | ||
|
|
0b48e48e3d | ||
|
|
269d16301a | ||
|
|
0fee7c863a | ||
|
|
61214899bd | ||
|
|
bd8899b37d | ||
|
|
edae622d8f | ||
|
|
7e4c101d02 | ||
|
|
2e796da441 | ||
|
|
64f5146a62 | ||
|
|
cdc7da3ae1 | ||
|
|
b48273d1cf | ||
|
|
149dd78298 | ||
|
|
b475f91387 | ||
|
|
5e14f4a16e | ||
|
|
8574f100aa | ||
|
|
44b7a26119 | ||
|
|
8c39cd35f0 | ||
|
|
f4e9bd507b | ||
|
|
7e3ccdf983 | ||
|
|
d9cbb994b8 | ||
|
|
6518a0f765 | ||
|
|
50b937dcb1 | ||
|
|
4d0b5ca14a | ||
|
|
381f8d4475 | ||
|
|
d03977ac0e | ||
|
|
edf868d46b | ||
|
|
afda9cbb2d | ||
|
|
4f216f22e9 | ||
|
|
e218837380 | ||
|
|
bcfe048aae | ||
|
|
1aa1f7b12c | ||
|
|
5bfe0ab237 | ||
|
|
7c376f2bda | ||
|
|
e57c764410 | ||
|
|
333aeb43c4 | ||
|
|
af798092b7 | ||
|
|
53fbb8b074 | ||
|
|
31bd725559 | ||
|
|
eca918c0e7 | ||
|
|
69d31c560d | ||
|
|
dfaefe34a4 | ||
|
|
b8f559aecb | ||
|
|
d6a2431767 | ||
|
|
870c5f8cef | ||
|
|
e32a653cb6 | ||
|
|
cdfb24ab85 | ||
|
|
96f3ee9e4c | ||
|
|
27ead53382 | ||
|
|
b8572b69f0 | ||
|
|
fad07f0d15 | ||
|
|
8bccbdafd2 | ||
|
|
b7827962dc | ||
|
|
e81e4ad06f | ||
|
|
0c857e0ed8 | ||
|
|
ba848cffb4 | ||
|
|
d018d2a23f | ||
|
|
b65642564a | ||
|
|
157435a61c | ||
|
|
bdf68b2183 | ||
|
|
6586cc4029 | ||
|
|
ef623846c1 | ||
|
|
29b9d17faa | ||
|
|
1e4eb01059 | ||
|
|
8bf4d3fb7f |
@@ -3,7 +3,7 @@ root = true
|
||||
|
||||
[*.go]
|
||||
indent_style = tab
|
||||
indent_size = 2
|
||||
indent_size = 4
|
||||
charset = utf-8
|
||||
trim_trailing_whitespace = true
|
||||
insert_final_newline = true
|
||||
|
||||
12
.flooignore
12
.flooignore
@@ -1,12 +0,0 @@
|
||||
#*
|
||||
*.o
|
||||
*.pyc
|
||||
*.pyo
|
||||
*~
|
||||
extern/
|
||||
node_modules/
|
||||
tmp/
|
||||
data/
|
||||
vendor/
|
||||
public_gen/
|
||||
dist/
|
||||
20
.github/ISSUE_TEMPLATE.md
vendored
20
.github/ISSUE_TEMPLATE.md
vendored
@@ -1,5 +1,10 @@
|
||||
Please prefix your title with [Bug] or [Feature request]
|
||||
For question please check [Support Options](http://grafana.org/support/). **Do not** open a github issue
|
||||
Read before posting:
|
||||
|
||||
- Questions should be posted to https://community.grafana.com. Please search there and here on GitHub for similar issues before creating a new issue.
|
||||
- Checkout FAQ: https://community.grafana.com/c/howto/faq
|
||||
- Checkout How to troubleshoot metric query issues: https://community.grafana.com/t/how-to-troubleshoot-metric-query-issues/50
|
||||
|
||||
Please prefix your title with [Bug] or [Feature request].
|
||||
|
||||
Please include this information:
|
||||
- What Grafana version are you using?
|
||||
@@ -8,11 +13,6 @@ Please include this information:
|
||||
- What did you do?
|
||||
- What was the expected result?
|
||||
- What happened instead?
|
||||
|
||||
**IMPORTANT**
|
||||
If it relates to *metric data viz*:
|
||||
- An image or text representation of your metric query
|
||||
- The raw query and response for the network request (check this in chrome dev tools network tab, here you can see metric requests and other request, please include the request body and request response)
|
||||
|
||||
If it relates to *alerting*
|
||||
- An image of the test execution data fully expanded.
|
||||
- If related to metric query / data viz:
|
||||
- Include raw network request & response: get by opening Chrome Dev Tools (F12, Ctrl+Shift+I on windows, Cmd+Opt+I on Mac), go the network tab.
|
||||
|
||||
|
||||
6
.gitignore
vendored
6
.gitignore
vendored
@@ -9,13 +9,12 @@ awsconfig
|
||||
/public/vendor/npm
|
||||
/tmp
|
||||
vendor/phantomjs/phantomjs
|
||||
vendor/phantomjs/phantomjs.exe
|
||||
|
||||
docs/AWS_S3_BUCKET
|
||||
docs/GIT_BRANCH
|
||||
docs/VERSION
|
||||
docs/GITCOMMIT
|
||||
docs/changed-files
|
||||
docs/changed-files
|
||||
|
||||
# locally required config files
|
||||
public/css/*.min.css
|
||||
@@ -25,6 +24,7 @@ public/css/*.min.css
|
||||
*.swp
|
||||
.idea/
|
||||
*.iml
|
||||
*.tmp
|
||||
.vscode/
|
||||
|
||||
/data/*
|
||||
@@ -39,3 +39,5 @@ profile.cov
|
||||
/pkg/cmd/grafana-cli/grafana-cli
|
||||
/pkg/cmd/grafana-server/grafana-server
|
||||
/examples/*/dist
|
||||
/packaging/**/*.rpm
|
||||
/packaging/**/*.deb
|
||||
|
||||
304
CHANGELOG.md
304
CHANGELOG.md
@@ -1,12 +1,305 @@
|
||||
# 4.2.0 (unreleased)
|
||||
# 5.0.0 (unreleased)
|
||||
|
||||
# 4.0.0 (unreleased)
|
||||
### WIP (in develop branch currently as its unstable or unfinished)
|
||||
- Dashboard folders
|
||||
- User groups
|
||||
- Dashboard permissions (on folder & dashboard level), permissions can be assigned to groups or individual users
|
||||
- UX changes to nav & side menu
|
||||
- New dashboard grid layout system
|
||||
|
||||
# 4.5.0 (2017-09-14)
|
||||
|
||||
## Fixes & Enhancements since beta1
|
||||
* **Security**: Security fix for api vulnerability (in multiple org setups).
|
||||
* **Shortcuts**: Adds shortcut for creating new dashboard [#8876](https://github.com/grafana/grafana/pull/8876) thx [@mtanda](https://github.com/mtanda)
|
||||
* **Graph**: Right Y-Axis label position fixed [#9172](https://github.com/grafana/grafana/pull/9172)
|
||||
* **General**: Improve rounding of time intervals [#9197](https://github.com/grafana/grafana/pull/9197), thx [@alin-amana](https://github.com/alin-amana)
|
||||
|
||||
# 4.5.0-beta1 (2017-09-05)
|
||||
|
||||
## New Features
|
||||
|
||||
* **Table panel**: Render cell values as links that can have an url template that uses variables from current table row. [#3754](https://github.com/grafana/grafana/issues/3754)
|
||||
* **Elasticsearch**: Add ad hoc filters directly by clicking values in table panel [#8052](https://github.com/grafana/grafana/issues/8052).
|
||||
* **MySQL**: New rich query editor with syntax highlighting
|
||||
* **Prometheus**: New rich query editor with syntax highlighting, metric & range auto complete and integrated function docs. [#5117](https://github.com/grafana/grafana/issues/5117)
|
||||
|
||||
## Enhancements
|
||||
|
||||
* **GitHub OAuth**: Support for GitHub organizations with 100+ teams. [#8846](https://github.com/grafana/grafana/issues/8846), thx [@skwashd](https://github.com/skwashd)
|
||||
* **Graphite**: Calls to Graphite api /metrics/find now include panel or dashboad time range (from & until) in most cases, [#8055](https://github.com/grafana/grafana/issues/8055)
|
||||
* **Graphite**: Added new graphite 1.0 functions, available if you set version to 1.0.x in data source settings. New Functions: mapSeries, reduceSeries, isNonNull, groupByNodes, offsetToZero, grep, weightedAverage, removeEmptySeries, aggregateLine, averageOutsidePercentile, delay, exponentialMovingAverage, fallbackSeries, integralByInterval, interpolate, invert, linearRegression, movingMin, movingMax, movingSum, multiplySeriesWithWildcards, pow, powSeries, removeBetweenPercentile, squareRoot, timeSlice, closes [#8261](https://github.com/grafana/grafana/issues/8261)
|
||||
- **Elasticsearch**: Ad-hoc filters now use query phrase match filters instead of term filters, works on non keyword/raw fields [#9095](https://github.com/grafana/grafana/issues/9095).
|
||||
|
||||
### Breaking change
|
||||
|
||||
* **InfluxDB/Elasticsearch**: The panel & data source option named "Group by time interval" is now named "Min time interval" and does now always define a lower limit for the auto group by time. Without having to use `>` prefix (that prefix still works). This should in theory have close to zero actual impact on existing dashboards. It does mean that if you used this setting to define a hard group by time interval of, say "1d", if you zoomed to a time range wide enough the time range could increase above the "1d" range as the setting is now always considered a lower limit.
|
||||
|
||||
## Changes
|
||||
|
||||
* **InfluxDB**: Change time range filter for absolute time ranges to be inclusive instead of exclusive [#8319](https://github.com/grafana/grafana/issues/8319), thx [@Oxydros](https://github.com/Oxydros)
|
||||
* **InfluxDB**: Added paranthesis around tag filters in queries [#9131](https://github.com/grafana/grafana/pull/9131)
|
||||
|
||||
## Bug Fixes
|
||||
|
||||
* **Modals**: Maintain scroll position after opening/leaving modal [#8800](https://github.com/grafana/grafana/issues/8800)
|
||||
* **Templating**: You cannot select data source variables as data source for other template variables [#7510](https://github.com/grafana/grafana/issues/7510)
|
||||
* **MySQL/Postgres**: Fix for max_idle_conn option default which was wrongly set to zero which does not mean unlimited but means zero, which in practice kind of disables connection pooling, which is not good. Fixes [#8513](https://github.com/grafana/grafana/issues/8513)
|
||||
|
||||
# 4.4.3 (2017-08-07)
|
||||
|
||||
## Bug Fixes
|
||||
|
||||
* **Search**: Fix for issue that casued search view to hide when you clicked starred or tags filters, fixes [#8981](https://github.com/grafana/grafana/issues/8981)
|
||||
* **Modals**: ESC key now closes modal again, fixes [#8981](https://github.com/grafana/grafana/issues/8988), thx [@j-white](https://github.com/j-white)
|
||||
|
||||
# 4.4.2 (2017-08-01)
|
||||
|
||||
## Bug Fixes
|
||||
|
||||
* **GrafanaDB(mysql)**: Fix for dashboard_version.data column type, now changed to MEDIUMTEXT, fixes [#8813](https://github.com/grafana/grafana/issues/8813)
|
||||
* **Dashboard(settings)**: Closing setting views using ESC key did not update url correctly, fixes [#8869](https://github.com/grafana/grafana/issues/8869)
|
||||
* **InfluxDB**: Wrong username/password parameter name when using direct access, fixes [#8789](https://github.com/grafana/grafana/issues/8789)
|
||||
* **Forms(TextArea)**: Bug fix for no scroll in text areas [#8797](https://github.com/grafana/grafana/issues/8797)
|
||||
* **Png Render API**: Bug fix for timeout url parameter. It now works as it should. Default value was also increased from 30 to 60 seconds [#8710](https://github.com/grafana/grafana/issues/8710)
|
||||
* **Search**: Fix for not being able to close search by clicking on right side of search result container, [8848](https://github.com/grafana/grafana/issues/8848)
|
||||
* **Cloudwatch**: Fix for using variables in templating metrics() query, [8965](https://github.com/grafana/grafana/issues/8965)
|
||||
|
||||
## Changes
|
||||
|
||||
* **Settings(defaults)**: allow_sign_up default changed from true to false [#8743](https://github.com/grafana/grafana/issues/8743)
|
||||
* **Settings(defaults)**: allow_org_create default changed from true to false
|
||||
|
||||
# 4.4.1 (2017-07-05)
|
||||
|
||||
## Bug Fixes
|
||||
|
||||
* **Migrations**: migration fails where dashboard.created_by is null [#8783](https://github.com/grafana/grafana/issues/8783)
|
||||
|
||||
# 4.4.0 (2017-07-04)
|
||||
|
||||
## New Features
|
||||
**Dashboard History**: View dashboard version history, compare any two versions (summary & json diffs), restore to old version. This big feature
|
||||
was contributed by **Walmart Labs**. Big thanks to them for this massive contribution!
|
||||
Initial feature request: [#4638](https://github.com/grafana/grafana/issues/4638)
|
||||
Pull Request: [#8472](https://github.com/grafana/grafana/pull/8472)
|
||||
|
||||
## Enhancements
|
||||
* **Elasticsearch**: Added filter aggregation label [#8420](https://github.com/grafana/grafana/pull/8420), thx [@tianzk](github.com/tianzk)
|
||||
* **Sensu**: Added option for source and handler [#8405](https://github.com/grafana/grafana/pull/8405), thx [@joemiller](github.com/joemiller)
|
||||
* **CSV**: Configurable csv export datetime format [#8058](https://github.com/grafana/grafana/issues/8058), thx [@cederigo](github.com/cederigo)
|
||||
* **Table Panel**: Column style that preserves formatting/indentation (like pre tag) [#6617](https://github.com/grafana/grafana/issues/6617)
|
||||
* **DingDing**: Add DingDing Alert Notifier [#8473](https://github.com/grafana/grafana/pull/8473) thx [@jiamliang](https://github.com/jiamliang)
|
||||
|
||||
## Minor Enhancements
|
||||
|
||||
* **Elasticsearch**: Add option for result set size in raw_document [#3426](https://github.com/grafana/grafana/issues/3426) [#8527](https://github.com/grafana/grafana/pull/8527), thx [@mk-dhia](github.com/mk-dhia)
|
||||
|
||||
## Bug Fixes
|
||||
|
||||
* **Graph**: Bug fix for negative values in histogram mode [#8628](https://github.com/grafana/grafana/issues/8628)
|
||||
|
||||
# 4.3.2 (2017-05-31)
|
||||
|
||||
## Bug fixes
|
||||
|
||||
* **InfluxDB**: Fixed issue with query editor not showing ALIAS BY input field when in text editor mode [#8459](https://github.com/grafana/grafana/issues/8459)
|
||||
* **Graph Log Scale**: Fixed issue with log scale going below x-axis [#8244](https://github.com/grafana/grafana/issues/8244)
|
||||
* **Playlist**: Fixed dashboard play order issue [#7688](https://github.com/grafana/grafana/issues/7688)
|
||||
* **Elasticsearch**: Fixed table query issue with ES 2.x [#8467](https://github.com/grafana/grafana/issues/8467), thx [@goldeelox](https://github.com/goldeelox)
|
||||
|
||||
## Changes
|
||||
* **Lazy Loading Of Panels**: Panels are no longer loaded as they are scrolled into view, this was reverted due to Chrome bug, might be reintroduced when Chrome fixes it's JS blocking behavior on scroll. [#8500](https://github.com/grafana/grafana/issues/8500)
|
||||
|
||||
# 4.3.1 (2017-05-23)
|
||||
|
||||
## Bug fixes
|
||||
|
||||
* **S3 image upload**: Fixed image url issue for us-east-1 (us standard) region. If you were missing slack images for alert notifications this should fix it. [#8444](https://github.com/grafana/grafana/issues/8444)
|
||||
|
||||
# 4.3.0-stable (2017-05-23)
|
||||
|
||||
## Bug fixes
|
||||
|
||||
* **Gzip**: Fixed crash when gzip was enabled [#8380](https://github.com/grafana/grafana/issues/8380)
|
||||
* **Graphite**: Fixed issue with Toggle edit mode did in query editor [#8377](https://github.com/grafana/grafana/issues/8377)
|
||||
* **Alerting**: Fixed issue with state history not showing query execution errors [#8412](https://github.com/grafana/grafana/issues/8412)
|
||||
* **Alerting**: Fixed issue with missing state history events/annotations when using sqlite3 database [#7992](https://github.com/grafana/grafana/issues/7992)
|
||||
* **Sqlite**: Fixed with database table locked and using sqlite3 database [#7992](https://github.com/grafana/grafana/issues/7992)
|
||||
* **Alerting**: Fixed issue with annotations showing up in unsaved dashboards, new graph & alert panel. [#8361](https://github.com/grafana/grafana/issues/8361)
|
||||
* **webdav**: Fixed http proxy env variable support for webdav image upload [#7922](https://github.com/grafana/grafana/issues/79222), thx [@berghauz](https://github.com/berghauz)
|
||||
* **Prometheus**: Fixed issue with hiding query [#8413](https://github.com/grafana/grafana/issues/8413)
|
||||
|
||||
## Enhancements
|
||||
|
||||
* **VictorOps**: Now supports panel image & auto resolve [#8431](https://github.com/grafana/grafana/pull/8431), thx [@davidmscott](https://github.com/davidmscott)
|
||||
* **Alerting**: Alert annotations now provide more info [#8421](https://github.com/grafana/grafana/pull/8421)
|
||||
|
||||
# 4.3.0-beta1 (2017-05-12)
|
||||
|
||||
## Enhancements
|
||||
|
||||
* **InfluxDB**: influxdb query builder support for ORDER BY and LIMIT (allows TOPN queries) [#6065](https://github.com/grafana/grafana/issues/6065) Support influxdb's SLIMIT Feature [#7232](https://github.com/grafana/grafana/issues/7232) thx [@thuck](https://github.com/thuck)
|
||||
* **Panels**: Delay loading & Lazy load panels as they become visible (scrolled into view) [#5216](https://github.com/grafana/grafana/issues/5216) thx [@jifwin](https://github.com/jifwin)
|
||||
* **Graph**: Support auto grid min/max when using log scale [#3090](https://github.com/grafana/grafana/issues/3090), thx [@bigbenhur](https://github.com/bigbenhur)
|
||||
* **Graph**: Support for histograms [#600](https://github.com/grafana/grafana/issues/600)
|
||||
* **Prometheus**: Support table response formats (column per label) [#6140](https://github.com/grafana/grafana/issues/6140), thx [@mtanda](https://github.com/mtanda)
|
||||
* **Single Stat Panel**: support for non time series data [#6564](https://github.com/grafana/grafana/issues/6564)
|
||||
* **Server**: Monitoring Grafana (health check endpoint) [#3302](https://github.com/grafana/grafana/issues/3302)
|
||||
* **Heatmap**: Heatmap Panel [#7934](https://github.com/grafana/grafana/pull/7934)
|
||||
* **Elasticsearch**: histogram aggregation [#3164](https://github.com/grafana/grafana/issues/3164)
|
||||
|
||||
## Minor Enhancements
|
||||
|
||||
* **InfluxDB**: Small fix for the "glow" when focus the field for LIMIT and SLIMIT [#7799](https://github.com/grafana/grafana/pull/7799) thx [@thuck](https://github.com/thuck)
|
||||
* **Prometheus**: Make Prometheus query field a textarea [#7663](https://github.com/grafana/grafana/issues/7663), thx [@hagen1778](https://github.com/hagen1778)
|
||||
* **Prometheus**: Step parameter changed semantics to min step to reduce the load on Prometheus and rendering in browser [#8073](https://github.com/grafana/grafana/pull/8073), thx [@bobrik](https://github.com/bobrik)
|
||||
* **Templating**: Should not be possible to create self-referencing (recursive) template variable definitions [#7614](https://github.com/grafana/grafana/issues/7614) thx [@thuck](https://github.com/thuck)
|
||||
* **Cloudwatch**: Correctly obtain IAM roles within ECS container tasks [#7892](https://github.com/grafana/grafana/issues/7892) thx [@gomlgs](https://github.com/gomlgs)
|
||||
* **Units**: New number format: Scientific notation [#7781](https://github.com/grafana/grafana/issues/7781) thx [@cadnce](https://github.com/cadnce)
|
||||
* **Oauth**: Add common type for oauth authorization errors [#6428](https://github.com/grafana/grafana/issues/6428) thx [@amenzhinsky](https://github.com/amenzhinsky)
|
||||
* **Templating**: Data source variable now supports multi value and panel repeats [#7030](https://github.com/grafana/grafana/issues/7030) thx [@mtanda](https://github.com/mtanda)
|
||||
* **Telegram**: Telegram alert is not sending metric and legend. [#8110](https://github.com/grafana/grafana/issues/8110), thx [@bashgeek](https://github.com/bashgeek)
|
||||
* **Graph**: Support dashed lines [#514](https://github.com/grafana/grafana/issues/514), thx [@smalik03](https://github.com/smalik03)
|
||||
* **Table**: Support to change column header text [#3551](https://github.com/grafana/grafana/issues/3551)
|
||||
* **Alerting**: Better error when SMTP is not configured [#8093](https://github.com/grafana/grafana/issues/8093)
|
||||
* **Pushover**: Add an option to attach graph image link in Pushover notification [#8043](https://github.com/grafana/grafana/issues/8043) thx [@devkid](https://github.com/devkid)
|
||||
* **WebDAV**: Allow to set different ImageBaseUrl for WebDAV upload and image link [#7914](https://github.com/grafana/grafana/issues/7914)
|
||||
* **Panels**: type-ahead mixed datasource selection [#7697](https://github.com/grafana/grafana/issues/7697) thx [@mtanda](https://github.com/mtanda)
|
||||
* **Security**:User enumeration problem [#7619](https://github.com/grafana/grafana/issues/7619)
|
||||
* **InfluxDB**: Register new queries available in InfluxDB - Holt Winters [#5619](https://github.com/grafana/grafana/issues/5619) thx [@rikkuness](https://github.com/rikkuness)
|
||||
* **Server**: Support listening on a UNIX socket [#4030](https://github.com/grafana/grafana/issues/4030), thx [@mitjaziv](https://github.com/mitjaziv)
|
||||
* **Graph**: Support log scaling for values smaller 1 [#5278](https://github.com/grafana/grafana/issues/5278)
|
||||
* **InfluxDB**: Slow 'select measurement' rendering for InfluxDB [#2524](https://github.com/grafana/grafana/issues/2524), thx [@sbhenderson](https://github.com/sbhenderson)
|
||||
* **Config**: Configurable signout menu activation [#7968](https://github.com/grafana/grafana/pull/7968), thx [@seuf](https://github.com/seuf)
|
||||
|
||||
## Fixes
|
||||
* **Table Panel**: Fixed annotation display in table panel, [#8023](https://github.com/grafana/grafana/issues/8023)
|
||||
* **Dashboard**: If refresh is blocked due to tab not visible, then refresh when it becomes visible [#8076](https://github.com/grafana/grafana/issues/8076) thanks [@SimenB](https://github.com/SimenB)
|
||||
* **Snapshots**: Fixed problem with annotations & snapshots [#7659](https://github.com/grafana/grafana/issues/7659)
|
||||
* **Graph**: MetricSegment loses type when value is an asterisk [#8277](https://github.com/grafana/grafana/issues/8277), thx [@Gordiychuk](https://github.com/Gordiychuk)
|
||||
* **Alerting**: Alert notifications do not show charts when using a non public S3 bucket [#8250](https://github.com/grafana/grafana/issues/8250) thx [@rogerswingle](https://github.com/rogerswingle)
|
||||
* **Graph**: 100% client CPU usage on red alert glow animation [#8222](https://github.com/grafana/grafana/issues/8222)
|
||||
* **InfluxDB**: Templating: "All" query does match too much [#8165](https://github.com/grafana/grafana/issues/8165)
|
||||
* **Dashboard**: Description tooltip is not fully displayed [#7970](https://github.com/grafana/grafana/issues/7970)
|
||||
* **Proxy**: Redirect after switching Org does not obey sub path in root_url (using reverse proxy) [#8089](https://github.com/grafana/grafana/issues/8089)
|
||||
* **Templating**: Restoration of ad-hoc variable from URL does not work correctly [#8056](https://github.com/grafana/grafana/issues/8056) thx [@tamayika](https://github.com/tamayika)
|
||||
* **InfluxDB**: timeFilter cannot be used twice in alerts [#7969](https://github.com/grafana/grafana/issues/7969)
|
||||
* **MySQL**: 4-byte UTF8 not supported when using MySQL database (allows Emojis) [#7958](https://github.com/grafana/grafana/issues/7958)
|
||||
* **Alerting**: api/alerts and api/alert/:id hold previous data for "message" and "Message" field when field value is changed from "some string" to empty string. [#7927](https://github.com/grafana/grafana/issues/7927)
|
||||
* **Graph**: Cannot add fill below to series override [#7916](https://github.com/grafana/grafana/issues/7916)
|
||||
* **InfluxDB**: Influxb Datasource test passes even if the Database doesn't exist [#7864](https://github.com/grafana/grafana/issues/7864)
|
||||
* **Prometheus**: Displaying Prometheus annotations is incredibly slow [#7750](https://github.com/grafana/grafana/issues/7750), thx [@mtanda](https://github.com/mtanda)
|
||||
* **Graphite**: grafana generates empty find query to graphite -> 422 Unprocessable Entity [#7740](https://github.com/grafana/grafana/issues/7740)
|
||||
* **Admin**: make organisation filter case insensitive [#8194](https://github.com/grafana/grafana/issues/8194), thx [@Alexander-N](https://github.com/Alexander-N)
|
||||
|
||||
## Changes
|
||||
* **Elasticsearch**: Changed elasticsearch Terms aggregation to default to Min Doc Count to 1, and sort order to Top [#8321](https://github.com/grafana/grafana/issues/8321)
|
||||
|
||||
## Tech
|
||||
|
||||
* **Library Upgrade**: inconshreveable/log15 outdated - no support for solaris [#8262](https://github.com/grafana/grafana/issues/8262)
|
||||
* **Library Upgrade**: Upgrade Macaron [#7600](https://github.com/grafana/grafana/issues/7600)
|
||||
|
||||
# 4.2.0 (2017-03-22)
|
||||
## Minor Enhancements
|
||||
* **Templates**: Prevent use of the prefix `__` for templates in web UI [#7678](https://github.com/grafana/grafana/issues/7678)
|
||||
* **Threema**: Add emoji to Threema alert notifications [#7676](https://github.com/grafana/grafana/pull/7676) thx [@dbrgn](https://github.com/dbrgn)
|
||||
* **Panels**: Support dm3 unit [#7695](https://github.com/grafana/grafana/issues/7695) thx [@mitjaziv](https://github.com/mitjaziv)
|
||||
* **Docs**: Added some details about Sessions in Postgres [#7694](https://github.com/grafana/grafana/pull/7694) thx [@rickard-von-essen](https://github.com/rickard-von-essen)
|
||||
* **Influxdb**: Allow commas in template variables [#7681](https://github.com/grafana/grafana/issues/7681) thx [@thuck](https://github.com/thuck)
|
||||
* **Cloudwatch**: stop using deprecated session.New() [#7736](https://github.com/grafana/grafana/issues/7736) thx [@mtanda](https://github.com/mtanda)
|
||||
* **OpenTSDB**: Pass dropcounter rate option if no max counter and no reset value or reset value as 0 is specified [#7743](https://github.com/grafana/grafana/pull/7743) thx [@r4um](https://github.com/r4um)
|
||||
* **Templating**: support full resolution for $interval variable [#7696](https://github.com/grafana/grafana/pull/7696) thx [@mtanda](https://github.com/mtanda)
|
||||
* **Elasticsearch**: Unique Count on string fields in ElasticSearch [#3536](https://github.com/grafana/grafana/issues/3536), thx [@pyro2927](https://github.com/pyro2927)
|
||||
* **Templating**: Data source template variable that refers to other variable in regex filter [#6365](https://github.com/grafana/grafana/issues/6365) thx [@rlodge](https://github.com/rlodge)
|
||||
* **Admin**: Global User List: add search and pagination [#7469](https://github.com/grafana/grafana/issues/7469)
|
||||
* **User Management**: Invite UI is now disabled when login form is disabled [#7875](https://github.com/grafana/grafana/issues/7875)
|
||||
|
||||
## Bugfixes
|
||||
* **Webhook**: Use proxy settings from environment variables [#7710](https://github.com/grafana/grafana/issues/7710)
|
||||
* **Panels**: Deleting a dashboard with unsaved changes raises an error message [#7591](https://github.com/grafana/grafana/issues/7591) thx [@thuck](https://github.com/thuck)
|
||||
* **Influxdb**: Query builder detects regex to easily for measurement [#7276](https://github.com/grafana/grafana/issues/7276) thx [@thuck](https://github.com/thuck)
|
||||
* **Docs**: router_logging not documented [#7723](https://github.com/grafana/grafana/issues/7723)
|
||||
* **Alerting**: Spelling mistake [#7739](https://github.com/grafana/grafana/pull/7739) thx [@woutersmit](https://github.com/woutersmit)
|
||||
* **Alerting**: Graph legend scrolls to top when an alias is toggled/clicked [#7680](https://github.com/grafana/grafana/issues/7680) thx [@p4ddy1](https://github.com/p4ddy1)
|
||||
* **Panels**: Fixed panel tooltip description after scrolling down [#7708](https://github.com/grafana/grafana/issues/7708) thx [@askomorokhov](https://github.com/askomorokhov)
|
||||
|
||||
# 4.2.0-beta1 (2017-02-27)
|
||||
|
||||
## Enhancements
|
||||
* **Telegram**: Added Telegram alert notifier [#7098](https://github.com/grafana/grafana/pull/7098), thx [@leonoff](https://github.com/leonoff)
|
||||
* **Templating**: Make $__interval and $__interval_ms global built in variables that can be used in by any datasource (in panel queries), closes [#7190](https://github.com/grafana/grafana/issues/7190), closes [#6582](https://github.com/grafana/grafana/issues/6582)
|
||||
* **S3 Image Store**: External s3 image store (used in alert notifications) now support AWS IAM Roles, closes [#6985](https://github.com/grafana/grafana/issues/6985), [#7058](https://github.com/grafana/grafana/issues/7058) thx [@mtanda](https://github.com/mtanda)
|
||||
* **SingleStat**: Implements diff aggregation method for singlestat [#7234](https://github.com/grafana/grafana/issues/7234), thx [@oliverpool](https://github.com/oliverpool)
|
||||
* **Dataproxy**: Added setting to enable more verbose logging in dataproxy [#7209](https://github.com/grafana/grafana/pull/7209), thx [@Ricky-N](https://github.com/Ricky-N)
|
||||
* **Alerting**: Better information about why an alert triggered [#7035](https://github.com/grafana/grafana/issues/7035)
|
||||
* **LINE**: Add LINE as alerting notification channel [#7301](https://github.com/grafana/grafana/pull/7301), thx [@huydx](https://github.com/huydx)
|
||||
* **LINE**: Adds image to notification message [#7417](https://github.com/grafana/grafana/pull/7417), thx [@Erliz](https://github.com/Erliz)
|
||||
* **Hipchat**: Adds support for sending alert notifications to hipchat [#6451](https://github.com/grafana/grafana/issues/6451), thx [@jregovic](https://github.com/jregovic)
|
||||
* **Alerting**: Uploading images for alert notifications is now optional [#7419](https://github.com/grafana/grafana/issues/7419)
|
||||
* **Dashboard**: Adds shortcut for collapsing/expanding all rows [#552](https://github.com/grafana/grafana/issues/552), thx [@mtanda](https://github.com/mtanda)
|
||||
* **Alerting**: Adds de duping of alert notifications [#7632](https://github.com/grafana/grafana/pull/7632)
|
||||
* **Orgs**: Sharing dashboards using Grafana share feature will now redirect to correct org. [#1613](https://github.com/grafana/grafana/issues/1613)
|
||||
* **Pushover**: Add Pushover alert notifications [#7526](https://github.com/grafana/grafana/pull/7526) thx [@devkid](https://github.com/devkid)
|
||||
* **Threema**: Add Threema Gateway alert notification integration [#7482](https://github.com/grafana/grafana/pull/7482) thx [@dbrgn](https://github.com/dbrgn)
|
||||
|
||||
## Minor Enhancements
|
||||
* **Optimzation**: Never issue refresh event when Grafana tab is not visible [#7218](https://github.com/grafana/grafana/issues/7218), thx [@mtanda](https://github.com/mtanda)
|
||||
* **Browser History**: Browser back/forward now works time ranges / zoom, [#7259](https://github.com/grafana/grafana/issues/7259)
|
||||
* **Elasticsearch**: Support for Min Doc Count options in Terms aggregation [#7324](https://github.com/grafana/grafana/pull/7324), thx [@lpic10](https://github.com/lpic10)
|
||||
* **Elasticsearch**: Term aggregation limit can now be changed in template queries [#7112](https://github.com/grafana/grafana/issues/7112), thx [@FFalcon](https://github.com/FFalcon)
|
||||
* **Elasticsearch**: Ad-hoc filters now support all operators [#7612](https://github.com/grafana/grafana/issues/7612), thx [@tamayika](https://github.com/tamayika)
|
||||
* **Graph**: Add full series name as title for legends. [#7493](https://github.com/grafana/grafana/pull/7493), thx [@kolobaev](https://github.com/kolobaev)
|
||||
* **Table**: Add a message when queries returns no data. [#6109](https://github.com/grafana/grafana/issues/6109), thx [@xginn8](https://github.com/xginn8)
|
||||
* **Graph**: Set max width for series names in legend tables. [#2385](https://github.com/grafana/grafana/issues/2385), thx [@kolobaev](https://github.com/kolobaev)
|
||||
* **Database**: Allow max db connection pool configuration [#7427](https://github.com/grafana/grafana/issues/7427), thx [@huydx](https://github.com/huydx)
|
||||
* **Datasources** Delete datsource by name [#7476](https://github.com/grafana/grafana/issues/7476), thx [@huydx](https://github.com/huydx)
|
||||
* **Dataproxy**: Only allow get that begins with api/ to access Prometheus [#7459](https://github.com/grafana/grafana/pull/7459), thx [@mtanda](https://github.com/mtanda)
|
||||
* **Snapshot**: Make timeout for snapshot creation configurable [#7449](https://github.com/grafana/grafana/pull/7449) thx [@ryu1-sakai](https://github.com/ryu1-sakai)
|
||||
* **Panels**: Add more physics units [#7554](https://github.com/grafana/grafana/pull/7554) thx [@ryantxu](https://github.com/ryantxu)
|
||||
* **Email**: Add sender's name on email [#2131](https://github.com/grafana/grafana/issues/2131) thx [@jacobbednarz](https://github.com/jacobbednarz)
|
||||
* **HTTPS**: Set tls 1.2 as lowest tls version. [#7347](https://github.com/grafana/grafana/pull/7347) thx [@roman-vynar](https://github.com/roman-vynar)
|
||||
* **Table**: Added suppressing of empty results to table plugin. [#7602](https://github.com/grafana/grafana/pull/7602) thx [@LLIyRiK](https://github.com/LLIyRiK)
|
||||
|
||||
## Tech
|
||||
|
||||
* **Library Upgrade**: Upgraded angularjs from 1.5.8 to 1.6.1 [#7274](https://github.com/grafana/grafana/issues/7274)
|
||||
* **Backend**: Grafana is now built using golang 1.8
|
||||
|
||||
## Bugfixes
|
||||
* **Alerting**: Fixes missing support for no_data and execution error when testing alerts [#7149](https://github.com/grafana/grafana/issues/7149)
|
||||
* **Dashboard**: Avoid duplicate data in dashboard json for panels with alerts [#7256](https://github.com/grafana/grafana/pull/7256)
|
||||
* **Alertlist**: Only show scrollbar when required [#7269](https://github.com/grafana/grafana/issues/7269)
|
||||
* **SMTP**: Set LocalName to hostname [#7223](https://github.com/grafana/grafana/issues/7223)
|
||||
* **Sidemenu**: Disable sign out in sidemenu for AuthProxyEnabled [#7377](https://github.com/grafana/grafana/pull/7377), thx [@solugebefola](https://github.com/solugebefola)
|
||||
* **Prometheus**: Add support for basic auth in Prometheus tsdb package [#6799](https://github.com/grafana/grafana/issues/6799), thx [@hagen1778](https://github.com/hagen1778)
|
||||
* **OAuth**: Redirect to original page when logging in with OAuth [#7513](https://github.com/grafana/grafana/issues/7513)
|
||||
* **Annotations**: Wrap text in annotations tooltip [#7542](https://github.com/grafana/grafana/pull/7542), thx [@xginn8](https://github.com/xginn8)
|
||||
* **Templating**: Fixes error when using numeric sort on empty strings [#7382](https://github.com/grafana/grafana/issues/7382)
|
||||
* **Templating**: Fixed issue detecting template variable dependency [#7354](https://github.com/grafana/grafana/issues/7354)
|
||||
|
||||
# 4.1.2 (2017-02-13)
|
||||
|
||||
### Bugfixes
|
||||
* **Table**: Fixes broken annotation rendering mode in the table panel [#7268](https://github.com/grafana/grafana/issues/7268)
|
||||
* **Data Sources**: Sorting for lists of data sources in UI is now case insensitive [#7491](https://github.com/grafana/grafana/issues/7491)
|
||||
* **Admin**: Support more then 1000 users in global users list [#7469](https://github.com/grafana/grafana/issues/7469)
|
||||
|
||||
# 4.1.1 (2017-01-11)
|
||||
|
||||
### Bugfixes
|
||||
* **Graph Panel**: Fixed issue with legend height in table mode [#7221](https://github.com/grafana/grafana/issues/7221)
|
||||
|
||||
# 4.1.0 (2017-01-11)
|
||||
|
||||
### Bugfixes
|
||||
* **Server side PNG rendering**: Fixed issue with y-axis label rotation in phantomjs rendered images [#6924](https://github.com/grafana/grafana/issues/6924)
|
||||
* **Graph**: Fixed centering of y-axis label [#7099](https://github.com/grafana/grafana/issues/7099)
|
||||
* **Graph**: Fixed graph legend table mode and always visible scrollbar [#6828](https://github.com/grafana/grafana/issues/6828)
|
||||
* **Templating**: Fixed template variable value groups/tags feature [#6752](https://github.com/grafana/grafana/issues/6752)
|
||||
* **Webhook**: Fixed webhook username mismatch [#7195](https://github.com/grafana/grafana/pull/7195), thx [@theisenmark](https://github.com/theisenmark)
|
||||
* **Influxdb**: Handles time(auto) the same way as time($interval) [#6997](https://github.com/grafana/grafana/issues/6997)
|
||||
|
||||
## Enhancements
|
||||
* **Elasticsearch**: Added support for all moving average options [#7154](https://github.com/grafana/grafana/pull/7154), thx [@vaibhavinbayarea](https://github.com/vaibhavinbayarea)
|
||||
@@ -39,11 +332,6 @@
|
||||
* **Notifications**: Remove html escaping the email subject. [#6905](https://github.com/grafana/grafana/issues/6905)
|
||||
* **Influxdb**: Fixes broken field dropdown when using template vars as measurement. [#6473](https://github.com/grafana/grafana/issues/6473)
|
||||
|
||||
# 4.0.3 (unreleased)
|
||||
|
||||
### Bugfixes
|
||||
* **Influxdb**: Handles time(auto) the same way as time($interval) [#6997](https://github.com/grafana/grafana/issues/6997)
|
||||
|
||||
# 4.0.2 (2016-12-08)
|
||||
|
||||
### Enhancements
|
||||
@@ -699,7 +987,7 @@ Grafana 2.x is fundamentally different from 1.x; it now ships with an integrated
|
||||
|
||||
# 1.8.0 (2014-09-22)
|
||||
|
||||
Read this [blog post](http://grafana.org/blog/2014/09/11/grafana-1-8-0-rc1-released.html) for an overview of all improvements.
|
||||
Read this [blog post](https://grafana.com/blog/2014/09/11/grafana-1.8.0-rc1-released) for an overview of all improvements.
|
||||
|
||||
**Fixes**
|
||||
- [Issue #802](https://github.com/grafana/grafana/issues/802). Annotations: Fix when using InfluxDB datasource
|
||||
|
||||
46
CODE_OF_CONDUCT.md
Normal file
46
CODE_OF_CONDUCT.md
Normal file
@@ -0,0 +1,46 @@
|
||||
# Contributor Covenant Code of Conduct
|
||||
|
||||
## Our Pledge
|
||||
|
||||
In the interest of fostering an open and welcoming environment, we as contributors and maintainers pledge to making participation in our project and our community a harassment-free experience for everyone, regardless of age, body size, disability, ethnicity, gender identity and expression, level of experience, nationality, personal appearance, race, religion, or sexual identity and orientation.
|
||||
|
||||
## Our Standards
|
||||
|
||||
Examples of behavior that contributes to creating a positive environment include:
|
||||
|
||||
* Using welcoming and inclusive language
|
||||
* Being respectful of differing viewpoints and experiences
|
||||
* Gracefully accepting constructive criticism
|
||||
* Focusing on what is best for the community
|
||||
* Showing empathy towards other community members
|
||||
|
||||
Examples of unacceptable behavior by participants include:
|
||||
|
||||
* The use of sexualized language or imagery and unwelcome sexual attention or advances
|
||||
* Trolling, insulting/derogatory comments, and personal or political attacks
|
||||
* Public or private harassment
|
||||
* Publishing others' private information, such as a physical or electronic address, without explicit permission
|
||||
* Other conduct which could reasonably be considered inappropriate in a professional setting
|
||||
|
||||
## Our Responsibilities
|
||||
|
||||
Project maintainers are responsible for clarifying the standards of acceptable behavior and are expected to take appropriate and fair corrective action in response to any instances of unacceptable behavior.
|
||||
|
||||
Project maintainers have the right and responsibility to remove, edit, or reject comments, commits, code, wiki edits, issues, and other contributions that are not aligned to this Code of Conduct, or to ban temporarily or permanently any contributor for other behaviors that they deem inappropriate, threatening, offensive, or harmful.
|
||||
|
||||
## Scope
|
||||
|
||||
This Code of Conduct applies both within project spaces and in public spaces when an individual is representing the project or its community. Examples of representing a project or community include using an official project e-mail address, posting via an official social media account, or acting as an appointed representative at an online or offline event. Representation of a project may be further defined and clarified by project maintainers.
|
||||
|
||||
## Enforcement
|
||||
|
||||
Instances of abusive, harassing, or otherwise unacceptable behavior may be reported by contacting the project team at contact@grafana.com. The project team will review and investigate all complaints, and will respond in a way that it deems appropriate to the circumstances. The project team is obligated to maintain confidentiality with regard to the reporter of an incident. Further details of specific enforcement policies may be posted separately.
|
||||
|
||||
Project maintainers who do not follow or enforce the Code of Conduct in good faith may face temporary or permanent repercussions as determined by other members of the project's leadership.
|
||||
|
||||
## Attribution
|
||||
|
||||
This Code of Conduct is adapted from the [Contributor Covenant][homepage], version 1.4, available at [http://contributor-covenant.org/version/1/4][version]
|
||||
|
||||
[homepage]: http://contributor-covenant.org
|
||||
[version]: http://contributor-covenant.org/version/1/4/
|
||||
@@ -1,4 +1,4 @@
|
||||
Copyright 2014-2016 Torkel Ödegaard, Raintank Inc.
|
||||
Copyright 2014-2017 Torkel Ödegaard, Raintank Inc.
|
||||
|
||||
Licensed under the Apache License, Version 2.0 (the "License"); you
|
||||
may not use this file except in compliance with the License. You may
|
||||
|
||||
4
Makefile
4
Makefile
@@ -4,9 +4,9 @@ deps-go:
|
||||
go run build.go setup
|
||||
|
||||
deps-js:
|
||||
yarn install
|
||||
yarn install --pure-lockfile --no-progress
|
||||
|
||||
deps: deps-go deps-js
|
||||
deps: deps-js
|
||||
|
||||
build-go:
|
||||
go run build.go build
|
||||
|
||||
111
README.md
111
README.md
@@ -1,72 +1,16 @@
|
||||
[Grafana](http://grafana.org) [](https://circleci.com/gh/grafana/grafana) [](https://coveralls.io/r/grafana/grafana)
|
||||
[Grafana](https://grafana.com) [](https://circleci.com/gh/grafana/grafana) [](https://goreportcard.com/report/github.com/grafana/grafana)
|
||||
================
|
||||
[Website](http://grafana.org) |
|
||||
[Website](https://grafana.com) |
|
||||
[Twitter](https://twitter.com/grafana) |
|
||||
[IRC](https://webchat.freenode.net/?channels=grafana) |
|
||||
[](http://slack.raintank.io)
|
||||
[Slack](http://slack.raintank.io) |
|
||||
[Email](mailto:contact@grafana.org)
|
||||
[Community & Forum](https://community.grafana.com)
|
||||
|
||||
Grafana is an open source, feature rich metrics dashboard and graph editor for
|
||||
Graphite, Elasticsearch, OpenTSDB, Prometheus and InfluxDB.
|
||||
|
||||
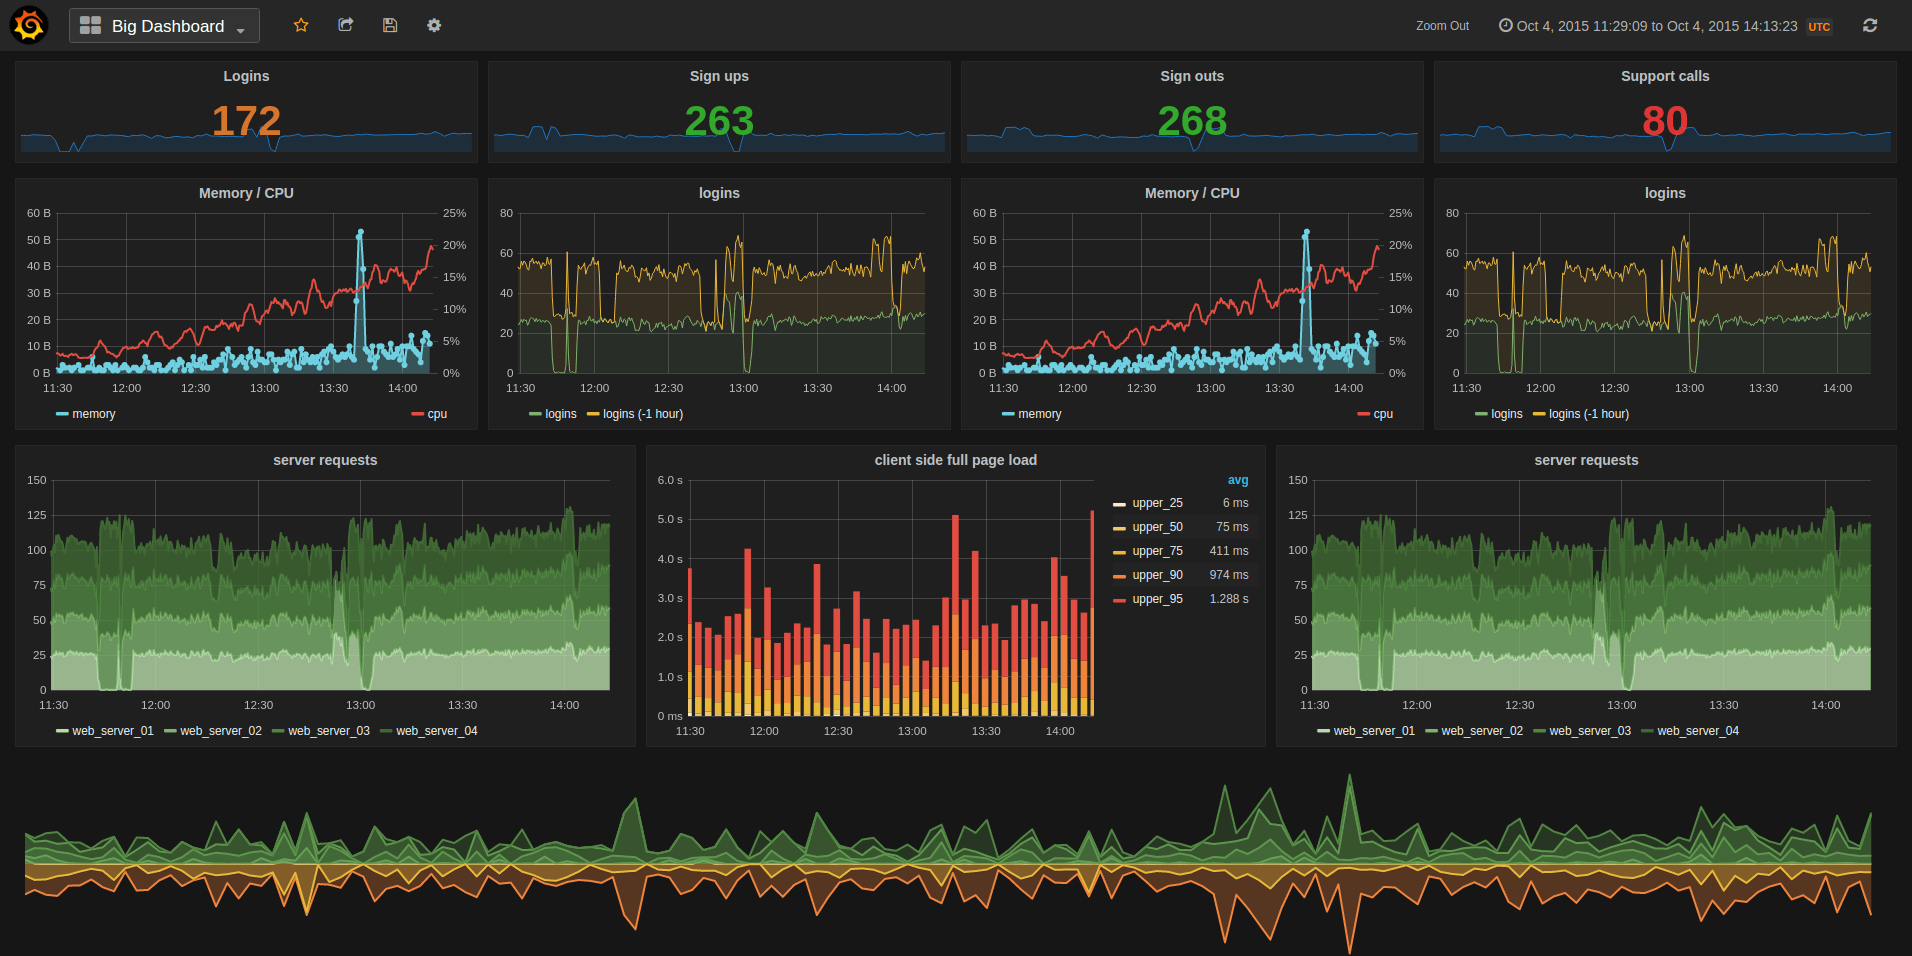
|
||||
|
||||
- [Install instructions](http://docs.grafana.org/installation/)
|
||||
- [What's New in Grafana 2.0](http://docs.grafana.org/guides/whats-new-in-v2/)
|
||||
- [What's New in Grafana 2.1](http://docs.grafana.org/guides/whats-new-in-v2-1/)
|
||||
- [What's New in Grafana 2.5](http://docs.grafana.org/guides/whats-new-in-v2-5/)
|
||||
- [What's New in Grafana 3.0](http://docs.grafana.org/guides/whats-new-in-v3/)
|
||||
- [What's New in Grafana 4.0](http://docs.grafana.org/guides/whats-new-in-v4/)
|
||||
- [What's New in Grafana 4.1 beta](http://docs.grafana.org/guides/whats-new-in-v4-1/)
|
||||
|
||||
## Features
|
||||
### Graphite Target Editor
|
||||
- Graphite target expression parser
|
||||
- Feature rich query composer
|
||||
- Quickly add and edit functions & parameters
|
||||
- Templated queries
|
||||
- [See it in action](http://docs.grafana.org/datasources/graphite/)
|
||||
|
||||
### Graphing
|
||||
- Fast rendering, even over large timespans
|
||||
- Click and drag to zoom
|
||||
- Multiple Y-axis, logarithmic scales
|
||||
- Bars, Lines, Points
|
||||
- Smart Y-axis formatting
|
||||
- Series toggles & color selector
|
||||
- Legend values, and formatting options
|
||||
- Grid thresholds, axis labels
|
||||
- [Annotations](http://docs.grafana.org/reference/annotations/)
|
||||
- Any panel can be rendered to PNG (server side using phantomjs)
|
||||
|
||||
### Dashboards
|
||||
- Create, edit, save & search dashboards
|
||||
- Change column spans and row heights
|
||||
- Drag and drop panels to rearrange
|
||||
- [Templating](http://docs.grafana.org/reference/templating/)
|
||||
- [Scripted dashboards](http://docs.grafana.org/reference/scripting/)
|
||||
- [Dashboard playlists](http://docs.grafana.org/reference/playlist/)
|
||||
- [Time range controls](http://docs.grafana.org/reference/timerange/)
|
||||
- [Share snapshots publicly](http://docs.grafana.org/v2.0/reference/sharing/)
|
||||
|
||||
### Elasticsearch
|
||||
- Feature rich query editor UI
|
||||
|
||||
### InfluxDB
|
||||
- Use InfluxDB as a metric data source, annotation source
|
||||
- Query editor with series and column typeahead, easy group by and function selection
|
||||
|
||||
### OpenTSDB
|
||||
- Use as metric data source
|
||||
- Query editor with metric name typeahead and tag filtering
|
||||
|
||||
## Requirements
|
||||
There are no dependencies except an external time series data store. For dashboards and user accounts Grafana can use an embedded
|
||||
database (sqlite3) or you can use an external SQL data base like MySQL or Postgres.
|
||||

|
||||
|
||||
## Installation
|
||||
Head to [grafana.org](http://docs.grafana.org/installation/) and [download](http://grafana.org/download/)
|
||||
Head to [docs.grafana.org](http://docs.grafana.org/installation/) and [download](https://grafana.com/get)
|
||||
the latest release.
|
||||
|
||||
If you have any problems please read the [troubleshooting guide](http://docs.grafana.org/installation/troubleshooting/).
|
||||
@@ -76,54 +20,36 @@ Be sure to read the [getting started guide](http://docs.grafana.org/guides/getti
|
||||
|
||||
## Run from master
|
||||
If you want to build a package yourself, or contribute. Here is a guide for how to do that. You can always find
|
||||
the latest master builds [here](http://grafana.org/builds)
|
||||
the latest master builds [here](https://grafana.com/grafana/download)
|
||||
|
||||
### Dependencies
|
||||
|
||||
- Go 1.7.3
|
||||
- NodeJS v4+
|
||||
|
||||
### Get Code
|
||||
|
||||
```bash
|
||||
go get github.com/grafana/grafana
|
||||
```
|
||||
|
||||
Since imports of dependencies use the absolute path `github.com/grafana/grafana` within the `$GOPATH`,
|
||||
you will need to put your version of the code in `$GOPATH/src/github.com/grafana/grafana` to be able
|
||||
to develop and build grafana on a cloned repository. To do so, you can clone your forked repository
|
||||
directly to `$GOPATH/src/github.com/grafana` or you can create a symbolic link from your version
|
||||
of the code to `$GOPATH/src/github.com/grafana/grafana`. The last options makes it possible to change
|
||||
easily the grafana repository you want to build.
|
||||
```bash
|
||||
go get github.com/*your_account*/grafana
|
||||
mkdir $GOPATH/src/github.com/grafana
|
||||
ln -s $GOPATH/src/github.com/*your_account*/grafana $GOPATH/src/github.com/grafana/grafana
|
||||
```
|
||||
- Go 1.8.1
|
||||
- NodeJS LTS
|
||||
|
||||
### Building the backend
|
||||
```bash
|
||||
cd $GOPATH/src/github.com/grafana/grafana
|
||||
go get github.com/grafana/grafana
|
||||
cd ~/go/src/github.com/grafana/grafana
|
||||
go run build.go setup
|
||||
go run build.go build
|
||||
```
|
||||
|
||||
### Building frontend assets
|
||||
|
||||
To build less to css for the frontend you will need a recent version of **node (v4+)**,
|
||||
To build less to css for the frontend you will need a recent version of **node (v6+)**,
|
||||
npm (v2.5.0) and grunt (v0.4.5). Run the following:
|
||||
|
||||
```bash
|
||||
npm install -g yarn
|
||||
yarn install
|
||||
yarn install --pure-lockfile
|
||||
npm run build
|
||||
```
|
||||
|
||||
To build the frontend assets only on changes:
|
||||
|
||||
```bash
|
||||
sudo npm install -g grunt-cli # to do only once to install grunt command line interface
|
||||
grunt watch
|
||||
npm run dev
|
||||
```
|
||||
|
||||
### Recompile backend on source change
|
||||
@@ -133,11 +59,6 @@ go get github.com/Unknwon/bra
|
||||
bra run
|
||||
```
|
||||
|
||||
### Running
|
||||
```bash
|
||||
./bin/grafana-server
|
||||
```
|
||||
|
||||
Open grafana in your browser (default: `http://localhost:3000`) and login with admin user (default: `user/pass = admin/admin`).
|
||||
|
||||
### Dev config
|
||||
@@ -146,11 +67,7 @@ Create a custom.ini in the conf directory to override default configuration opti
|
||||
You only need to add the options you want to override. Config files are applied in the order of:
|
||||
|
||||
1. grafana.ini
|
||||
2. dev.ini (if found)
|
||||
3. custom.ini
|
||||
|
||||
## Create a pull request
|
||||
Before or after you create a pull request, sign the [contributor license agreement](http://docs.grafana.org/project/cla/).
|
||||
1. custom.ini
|
||||
|
||||
## Contribute
|
||||
If you have any idea for an improvement or found a bug do not hesitate to open an issue.
|
||||
|
||||
29
ROADMAP.md
Normal file
29
ROADMAP.md
Normal file
@@ -0,0 +1,29 @@
|
||||
# Roadmap (2017-08-29)
|
||||
|
||||
This roadmap is a tentative plan for the core development team. Things change constantly as PRs come in and priorities change.
|
||||
But it will give you an idea of our current vision and plan.
|
||||
|
||||
### Short term (1-4 months)
|
||||
|
||||
- Release Grafana v4.5 with fixes and minor enhancements
|
||||
- Release Grafana v5
|
||||
- User groups
|
||||
- Dashboard folders
|
||||
- Dashboard permissions (on folders as well), permissions on groups or users
|
||||
- New Dashboard layout engine
|
||||
- New sidemenu & nav UX
|
||||
- Elasticsearch alerting
|
||||
|
||||
### Long term
|
||||
|
||||
- Backend plugins to support more Auth options, Alerting data sources & notifications
|
||||
- Universial time series transformations for any data source (meta queries)
|
||||
- Reporting
|
||||
- Web socket & live data streams
|
||||
- Migrate to Angular2 or react
|
||||
|
||||
|
||||
### Outside contributions
|
||||
We know this is being worked on right now by contributors (and we hope to merge it when it's ready).
|
||||
|
||||
- Clustering for alert engine (load distribution)
|
||||
25
appveyor.yml
25
appveyor.yml
@@ -7,13 +7,17 @@ clone_folder: c:\gopath\src\github.com\grafana\grafana
|
||||
environment:
|
||||
nodejs_version: "6"
|
||||
GOPATH: c:\gopath
|
||||
GOVERSION: 1.8
|
||||
|
||||
install:
|
||||
- rmdir c:\go /s /q
|
||||
# install nodejs and npm
|
||||
- ps: Install-Product node $env:nodejs_version
|
||||
- npm install -g yarn
|
||||
- yarn install
|
||||
- npm install -g yarn --silent
|
||||
- yarn install --pure-lockfile --no-progress
|
||||
- npm install -g grunt-cli
|
||||
- appveyor DownloadFile https://storage.googleapis.com/golang/go%GOVERSION%.windows-amd64.zip
|
||||
- 7z x go%GOVERSION%.windows-amd64.zip -y -oC:\ > NUL
|
||||
# install gcc (needed for sqlite3)
|
||||
- choco install -y --limit-output mingw
|
||||
- set PATH=C:\tools\mingw64\bin;%PATH%
|
||||
@@ -21,18 +25,29 @@ install:
|
||||
- echo %GOPATH%
|
||||
- go version
|
||||
- go env
|
||||
- go run build.go setup
|
||||
# - go run build.go setup
|
||||
|
||||
build_script:
|
||||
- go run build.go build
|
||||
- grunt release
|
||||
- go run build.go sha1-dist
|
||||
- go run build.go sha-dist
|
||||
- cp dist/* .
|
||||
- go test -v ./pkg/...
|
||||
|
||||
artifacts:
|
||||
- path: grafana-*windows-*.*
|
||||
name: binzip
|
||||
type: zip
|
||||
|
||||
deploy:
|
||||
- provider: Environment
|
||||
name: GrafanaBuildsS3
|
||||
name: GrafanaReleaseMaster
|
||||
on:
|
||||
buildType: master
|
||||
|
||||
- provider: Environment
|
||||
name: GrafanaReleaseRelease
|
||||
on:
|
||||
buildType: release
|
||||
|
||||
|
||||
|
||||
11
bower.json
11
bower.json
@@ -15,11 +15,12 @@
|
||||
"dependencies": {
|
||||
"jquery": "3.1.0",
|
||||
"lodash": "4.15.0",
|
||||
"angular": "1.5.8",
|
||||
"angular-route": "1.5.8",
|
||||
"angular-mocks": "1.5.8",
|
||||
"angular-sanitize": "1.5.8",
|
||||
"angular": "1.6.1",
|
||||
"angular-route": "1.6.1",
|
||||
"angular-mocks": "1.6.1",
|
||||
"angular-sanitize": "1.6.1",
|
||||
"angular-native-dragdrop": "1.2.2",
|
||||
"angular-bindonce": "0.3.3"
|
||||
"angular-bindonce": "0.3.3",
|
||||
"clipboard": "^1.5.16"
|
||||
}
|
||||
}
|
||||
|
||||
127
build.go
127
build.go
@@ -5,7 +5,7 @@ package main
|
||||
import (
|
||||
"bytes"
|
||||
"crypto/md5"
|
||||
"crypto/sha1"
|
||||
"crypto/sha256"
|
||||
"encoding/json"
|
||||
"flag"
|
||||
"fmt"
|
||||
@@ -14,6 +14,7 @@ import (
|
||||
"log"
|
||||
"os"
|
||||
"os/exec"
|
||||
"path"
|
||||
"path/filepath"
|
||||
"regexp"
|
||||
"runtime"
|
||||
@@ -37,19 +38,18 @@ var (
|
||||
race bool
|
||||
phjsToRelease string
|
||||
workingDir string
|
||||
includeBuildNumber bool = true
|
||||
buildNumber int = 0
|
||||
binaries []string = []string{"grafana-server", "grafana-cli"}
|
||||
)
|
||||
|
||||
const minGoVersion = 1.7
|
||||
const minGoVersion = 1.8
|
||||
|
||||
func main() {
|
||||
log.SetOutput(os.Stdout)
|
||||
log.SetFlags(0)
|
||||
|
||||
ensureGoPath()
|
||||
readVersionFromPackageJson()
|
||||
|
||||
log.Printf("Version: %s, Linux Version: %s, Package Iteration: %s\n", version, linuxPackageVersion, linuxPackageIteration)
|
||||
|
||||
flag.StringVar(&goarch, "goarch", runtime.GOARCH, "GOARCH")
|
||||
flag.StringVar(&goos, "goos", runtime.GOOS, "GOOS")
|
||||
@@ -59,8 +59,14 @@ func main() {
|
||||
flag.StringVar(&pkgArch, "pkg-arch", "", "PKG ARCH")
|
||||
flag.StringVar(&phjsToRelease, "phjs", "", "PhantomJS binary")
|
||||
flag.BoolVar(&race, "race", race, "Use race detector")
|
||||
flag.BoolVar(&includeBuildNumber, "includeBuildNumber", includeBuildNumber, "IncludeBuildNumber in package name")
|
||||
flag.IntVar(&buildNumber, "buildNumber", 0, "Build number from CI system")
|
||||
flag.Parse()
|
||||
|
||||
readVersionFromPackageJson()
|
||||
|
||||
log.Printf("Version: %s, Linux Version: %s, Package Iteration: %s\n", version, linuxPackageVersion, linuxPackageIteration)
|
||||
|
||||
if flag.NArg() == 0 {
|
||||
log.Println("Usage: go run build.go build")
|
||||
return
|
||||
@@ -73,9 +79,9 @@ func main() {
|
||||
case "setup":
|
||||
setup()
|
||||
|
||||
case "build-cli":
|
||||
clean()
|
||||
build("grafana-cli", "./pkg/cmd/grafana-cli", []string{})
|
||||
case "build-cli":
|
||||
clean()
|
||||
build("grafana-cli", "./pkg/cmd/grafana-cli", []string{})
|
||||
|
||||
case "build":
|
||||
clean()
|
||||
@@ -89,25 +95,23 @@ func main() {
|
||||
|
||||
case "package":
|
||||
grunt(gruntBuildArg("release")...)
|
||||
createLinuxPackages()
|
||||
sha1FilesInDist()
|
||||
if runtime.GOOS != "windows" {
|
||||
createLinuxPackages()
|
||||
}
|
||||
|
||||
case "pkg-rpm":
|
||||
grunt(gruntBuildArg("release")...)
|
||||
createRpmPackages()
|
||||
sha1FilesInDist()
|
||||
|
||||
case "pkg-deb":
|
||||
grunt(gruntBuildArg("release")...)
|
||||
createDebPackages()
|
||||
sha1FilesInDist()
|
||||
|
||||
case "sha1-dist":
|
||||
sha1FilesInDist()
|
||||
case "sha-dist":
|
||||
shaFilesInDist()
|
||||
|
||||
case "latest":
|
||||
makeLatestDistCopies()
|
||||
sha1FilesInDist()
|
||||
|
||||
case "clean":
|
||||
clean()
|
||||
@@ -119,14 +123,24 @@ func main() {
|
||||
}
|
||||
|
||||
func makeLatestDistCopies() {
|
||||
rpmIteration := "-1"
|
||||
if linuxPackageIteration != "" {
|
||||
rpmIteration = linuxPackageIteration
|
||||
files, err := ioutil.ReadDir("dist")
|
||||
if err != nil {
|
||||
log.Fatalf("failed to create latest copies. Cannot read from /dist")
|
||||
}
|
||||
|
||||
runError("cp", fmt.Sprintf("dist/grafana_%v-%v_amd64.deb", linuxPackageVersion, linuxPackageIteration), "dist/grafana_latest_amd64.deb")
|
||||
runError("cp", fmt.Sprintf("dist/grafana-%v-%v.x86_64.rpm", linuxPackageVersion, rpmIteration), "dist/grafana-latest-1.x86_64.rpm")
|
||||
runError("cp", fmt.Sprintf("dist/grafana-%v-%v.linux-x64.tar.gz", linuxPackageVersion, linuxPackageIteration), "dist/grafana-latest.linux-x64.tar.gz")
|
||||
latestMapping := map[string]string{
|
||||
".deb": "dist/grafana_latest_amd64.deb",
|
||||
".rpm": "dist/grafana-latest-1.x86_64.rpm",
|
||||
".tar.gz": "dist/grafana-latest.linux-x64.tar.gz",
|
||||
}
|
||||
|
||||
for _, file := range files {
|
||||
for extension, fullName := range latestMapping {
|
||||
if strings.HasSuffix(file.Name(), extension) {
|
||||
runError("cp", path.Join("dist", file.Name()), fullName)
|
||||
}
|
||||
}
|
||||
}
|
||||
}
|
||||
|
||||
func readVersionFromPackageJson() {
|
||||
@@ -157,7 +171,13 @@ func readVersionFromPackageJson() {
|
||||
}
|
||||
|
||||
// add timestamp to iteration
|
||||
linuxPackageIteration = fmt.Sprintf("%d%s", time.Now().Unix(), linuxPackageIteration)
|
||||
if includeBuildNumber {
|
||||
if buildNumber != 0 {
|
||||
linuxPackageIteration = fmt.Sprintf("%d%s", buildNumber, linuxPackageIteration)
|
||||
} else {
|
||||
linuxPackageIteration = fmt.Sprintf("%d%s", time.Now().Unix(), linuxPackageIteration)
|
||||
}
|
||||
}
|
||||
}
|
||||
|
||||
type linuxPackageOptions struct {
|
||||
@@ -167,7 +187,6 @@ type linuxPackageOptions struct {
|
||||
serverBinPath string
|
||||
cliBinPath string
|
||||
configDir string
|
||||
configFilePath string
|
||||
ldapFilePath string
|
||||
etcDefaultPath string
|
||||
etcDefaultFilePath string
|
||||
@@ -188,8 +207,6 @@ func createDebPackages() {
|
||||
homeDir: "/usr/share/grafana",
|
||||
binPath: "/usr/sbin",
|
||||
configDir: "/etc/grafana",
|
||||
configFilePath: "/etc/grafana/grafana.ini",
|
||||
ldapFilePath: "/etc/grafana/ldap.toml",
|
||||
etcDefaultPath: "/etc/default",
|
||||
etcDefaultFilePath: "/etc/default/grafana-server",
|
||||
initdScriptFilePath: "/etc/init.d/grafana-server",
|
||||
@@ -210,8 +227,6 @@ func createRpmPackages() {
|
||||
homeDir: "/usr/share/grafana",
|
||||
binPath: "/usr/sbin",
|
||||
configDir: "/etc/grafana",
|
||||
configFilePath: "/etc/grafana/grafana.ini",
|
||||
ldapFilePath: "/etc/grafana/ldap.toml",
|
||||
etcDefaultPath: "/etc/sysconfig",
|
||||
etcDefaultFilePath: "/etc/sysconfig/grafana-server",
|
||||
initdScriptFilePath: "/etc/init.d/grafana-server",
|
||||
@@ -222,7 +237,7 @@ func createRpmPackages() {
|
||||
defaultFileSrc: "packaging/rpm/sysconfig/grafana-server",
|
||||
systemdFileSrc: "packaging/rpm/systemd/grafana-server.service",
|
||||
|
||||
depends: []string{"initscripts", "fontconfig"},
|
||||
depends: []string{"/sbin/service", "fontconfig", "freetype", "urw-fonts"},
|
||||
})
|
||||
}
|
||||
|
||||
@@ -256,21 +271,15 @@ func createPackage(options linuxPackageOptions) {
|
||||
runPrint("cp", "-a", filepath.Join(workingDir, "tmp")+"/.", filepath.Join(packageRoot, options.homeDir))
|
||||
// remove bin path
|
||||
runPrint("rm", "-rf", filepath.Join(packageRoot, options.homeDir, "bin"))
|
||||
// copy sample ini file to /etc/grafana
|
||||
runPrint("cp", "conf/sample.ini", filepath.Join(packageRoot, options.configFilePath))
|
||||
// copy sample ldap toml config file to /etc/grafana/ldap.toml
|
||||
runPrint("cp", "conf/ldap.toml", filepath.Join(packageRoot, options.ldapFilePath))
|
||||
|
||||
args := []string{
|
||||
"-s", "dir",
|
||||
"--description", "Grafana",
|
||||
"-C", packageRoot,
|
||||
"--vendor", "Grafana",
|
||||
"--url", "http://grafana.org",
|
||||
"--url", "https://grafana.com",
|
||||
"--license", "\"Apache 2.0\"",
|
||||
"--maintainer", "contact@grafana.org",
|
||||
"--config-files", options.configFilePath,
|
||||
"--config-files", options.ldapFilePath,
|
||||
"--maintainer", "contact@grafana.com",
|
||||
"--config-files", options.initdScriptFilePath,
|
||||
"--config-files", options.etcDefaultFilePath,
|
||||
"--config-files", options.systemdServiceFilePath,
|
||||
@@ -280,6 +289,14 @@ func createPackage(options linuxPackageOptions) {
|
||||
"-p", "./dist",
|
||||
}
|
||||
|
||||
if options.packageType == "rpm" {
|
||||
args = append(args, "--rpm-posttrans", "packaging/rpm/control/posttrans")
|
||||
}
|
||||
|
||||
if options.packageType == "deb" {
|
||||
args = append(args, "--deb-no-default-config-files")
|
||||
}
|
||||
|
||||
if pkgArch != "" {
|
||||
args = append(args, "-a", pkgArch)
|
||||
}
|
||||
@@ -330,11 +347,20 @@ func ChangeWorkingDir(dir string) {
|
||||
}
|
||||
|
||||
func grunt(params ...string) {
|
||||
runPrint("./node_modules/.bin/grunt", params...)
|
||||
if runtime.GOOS == "windows" {
|
||||
runPrint(`.\node_modules\.bin\grunt`, params...)
|
||||
} else {
|
||||
runPrint("./node_modules/.bin/grunt", params...)
|
||||
}
|
||||
}
|
||||
|
||||
func gruntBuildArg(task string) []string {
|
||||
args := []string{task, fmt.Sprintf("--pkgVer=%v-%v", linuxPackageVersion, linuxPackageIteration)}
|
||||
args := []string{task}
|
||||
if includeBuildNumber {
|
||||
args = append(args, fmt.Sprintf("--pkgVer=%v-%v", linuxPackageVersion, linuxPackageIteration))
|
||||
} else {
|
||||
args = append(args, fmt.Sprintf("--pkgVer=%v", version))
|
||||
}
|
||||
if pkgArch != "" {
|
||||
args = append(args, fmt.Sprintf("--arch=%v", pkgArch))
|
||||
}
|
||||
@@ -429,14 +455,10 @@ func setBuildEnv() {
|
||||
}
|
||||
|
||||
func getGitSha() string {
|
||||
v, err := runError("git", "describe", "--always", "--dirty")
|
||||
v, err := runError("git", "rev-parse", "--short", "HEAD")
|
||||
if err != nil {
|
||||
return "unknown-dev"
|
||||
}
|
||||
v = versionRe.ReplaceAllFunc(v, func(s []byte) []byte {
|
||||
s[0] = '+'
|
||||
return s
|
||||
})
|
||||
return string(v)
|
||||
}
|
||||
|
||||
@@ -514,29 +536,36 @@ func md5File(file string) error {
|
||||
return out.Close()
|
||||
}
|
||||
|
||||
func sha1FilesInDist() {
|
||||
func shaFilesInDist() {
|
||||
filepath.Walk("./dist", func(path string, f os.FileInfo, err error) error {
|
||||
if strings.Contains(path, ".sha1") == false {
|
||||
sha1File(path)
|
||||
if path == "./dist" {
|
||||
return nil
|
||||
}
|
||||
|
||||
if strings.Contains(path, ".sha256") == false {
|
||||
err := shaFile(path)
|
||||
if err != nil {
|
||||
log.Printf("Failed to create sha file. error: %v\n", err)
|
||||
}
|
||||
}
|
||||
return nil
|
||||
})
|
||||
}
|
||||
|
||||
func sha1File(file string) error {
|
||||
func shaFile(file string) error {
|
||||
fd, err := os.Open(file)
|
||||
if err != nil {
|
||||
return err
|
||||
}
|
||||
defer fd.Close()
|
||||
|
||||
h := sha1.New()
|
||||
h := sha256.New()
|
||||
_, err = io.Copy(h, fd)
|
||||
if err != nil {
|
||||
return err
|
||||
}
|
||||
|
||||
out, err := os.Create(file + ".sha1")
|
||||
out, err := os.Create(file + ".sha256")
|
||||
if err != nil {
|
||||
return err
|
||||
}
|
||||
|
||||
46
circle.yml
46
circle.yml
@@ -1,31 +1,57 @@
|
||||
machine:
|
||||
node:
|
||||
version: 6.9.2
|
||||
python:
|
||||
version: 2.7.3
|
||||
services:
|
||||
- docker
|
||||
environment:
|
||||
GOPATH: "/home/ubuntu/.go_workspace"
|
||||
ORG_PATH: "github.com/grafana"
|
||||
REPO_PATH: "${ORG_PATH}/grafana"
|
||||
GODIST: "go1.7.4.linux-amd64.tar.gz"
|
||||
GODIST: "go1.8.linux-amd64.tar.gz"
|
||||
post:
|
||||
- mkdir -p download
|
||||
- mkdir -p ~/download
|
||||
- mkdir -p ~/docker
|
||||
- test -e download/$GODIST || curl -o download/$GODIST https://storage.googleapis.com/golang/$GODIST
|
||||
- sudo rm -rf /usr/local/go
|
||||
- sudo tar -C /usr/local -xzf download/$GODIST
|
||||
|
||||
dependencies:
|
||||
cache_directories:
|
||||
- "~/docker"
|
||||
- "~/download"
|
||||
override:
|
||||
- rm -rf ${GOPATH}/src/${REPO_PATH}
|
||||
- mkdir -p ${GOPATH}/src/${ORG_PATH}
|
||||
- cp -r ~/grafana ${GOPATH}/src/${ORG_PATH}
|
||||
pre:
|
||||
- pip install awscli
|
||||
- sudo apt-get update; sudo apt-get install rpm; sudo apt-get install expect
|
||||
- ./scripts/build/build_container.sh
|
||||
|
||||
|
||||
test:
|
||||
override:
|
||||
- bash scripts/circle-test.sh
|
||||
- bash scripts/circle-test.sh
|
||||
|
||||
# deployment:
|
||||
# master:
|
||||
# branch: master
|
||||
# owner: grafana
|
||||
# commands:
|
||||
# - ./scripts/trigger_grafana_packer.sh ${TRIGGER_GRAFANA_PACKER_CIRCLECI_TOKEN}
|
||||
# - ./scripts/trigger_windows_build.sh ${APPVEYOR_TOKEN}
|
||||
deployment:
|
||||
gh_branch:
|
||||
branch: master
|
||||
commands:
|
||||
- ./scripts/build/deploy.sh
|
||||
- ./scripts/build/sign_packages.sh
|
||||
- go run build.go sha-dist
|
||||
- aws s3 sync ./dist s3://$BUCKET_NAME/master
|
||||
- ./scripts/trigger_windows_build.sh ${APPVEYOR_TOKEN} ${CIRCLE_SHA1} master
|
||||
- ./scripts/trigger_docker_build.sh ${TRIGGER_GRAFANA_PACKER_CIRCLECI_TOKEN}
|
||||
- go run ./scripts/build/publish.go -apiKey ${GRAFANA_COM_API_KEY}
|
||||
gh_tag:
|
||||
tag: /^v[0-9]+(\.[0-9]+){2}(-.+|[^-.]*)$/
|
||||
commands:
|
||||
- ./scripts/build/deploy.sh
|
||||
- ./scripts/build/sign_packages.sh
|
||||
- go run build.go sha-dist
|
||||
- aws s3 sync ./dist s3://$BUCKET_NAME/release
|
||||
- ./scripts/trigger_windows_build.sh ${APPVEYOR_TOKEN} ${CIRCLE_SHA1} release
|
||||
- ./scripts/trigger_docker_build.sh ${TRIGGER_GRAFANA_PACKER_CIRCLECI_TOKEN} ${CIRCLE_TAG}
|
||||
|
||||
@@ -25,7 +25,7 @@ plugins = data/plugins
|
||||
|
||||
#################################### Server ##############################
|
||||
[server]
|
||||
# Protocol (http or https)
|
||||
# Protocol (http, https, socket)
|
||||
protocol = http
|
||||
|
||||
# The ip address to bind to, empty will bind to all interfaces
|
||||
@@ -57,22 +57,31 @@ enable_gzip = false
|
||||
cert_file =
|
||||
cert_key =
|
||||
|
||||
# Unix socket path
|
||||
socket = /tmp/grafana.sock
|
||||
|
||||
#################################### Database ############################
|
||||
[database]
|
||||
# You can configure the database connection by specifying type, host, name, user and password
|
||||
# as seperate properties or as on string using the url propertie.
|
||||
# as separate properties or as on string using the url property.
|
||||
|
||||
# Either "mysql", "postgres" or "sqlite3", it's your choice
|
||||
type = sqlite3
|
||||
host = 127.0.0.1:3306
|
||||
name = grafana
|
||||
user = root
|
||||
# If the password contains # or ; you have to wrap it with trippel quotes. Ex """#password;"""
|
||||
# If the password contains # or ; you have to wrap it with triple quotes. Ex """#password;"""
|
||||
password =
|
||||
# Use either URL or the previous fields to configure the database
|
||||
# Example: mysql://user:secret@host:port/database
|
||||
url =
|
||||
|
||||
# Max idle conn setting default is 2
|
||||
max_idle_conn = 2
|
||||
|
||||
# Max conn setting default is 0 (mean not set)
|
||||
max_open_conn =
|
||||
|
||||
# For "postgres", use either "disable", "require" or "verify-full"
|
||||
# For "mysql", use either "true", "false", or "skip-verify".
|
||||
ssl_mode = disable
|
||||
@@ -113,6 +122,12 @@ cookie_secure = false
|
||||
session_life_time = 86400
|
||||
gc_interval_time = 86400
|
||||
|
||||
#################################### Data proxy ###########################
|
||||
[dataproxy]
|
||||
|
||||
# This enables data proxy logging, default is false
|
||||
logging = false
|
||||
|
||||
#################################### Analytics ###########################
|
||||
[analytics]
|
||||
# Server reporting, sends usage counters to stats.grafana.org every 24 hours.
|
||||
@@ -121,11 +136,11 @@ gc_interval_time = 86400
|
||||
# Change this option to false to disable reporting.
|
||||
reporting_enabled = true
|
||||
|
||||
# Set to false to disable all checks to https://grafana.net
|
||||
# for new vesions (grafana itself and plugins), check is used
|
||||
# Set to false to disable all checks to https://grafana.com
|
||||
# for new versions (grafana itself and plugins), check is used
|
||||
# in some UI views to notify that grafana or plugin update exists
|
||||
# This option does not cause any auto updates, nor send any information
|
||||
# only a GET request to http://grafana.net to get latest versions
|
||||
# only a GET request to https://grafana.com to get latest versions
|
||||
check_for_updates = true
|
||||
|
||||
# Google Analytics universal tracking code, only enabled if you specify an id here
|
||||
@@ -171,10 +186,10 @@ snapshot_TTL_days = 90
|
||||
#################################### Users ####################################
|
||||
[users]
|
||||
# disable user signup / registration
|
||||
allow_sign_up = true
|
||||
allow_sign_up = false
|
||||
|
||||
# Allow non admin users to create organizations
|
||||
allow_org_create = true
|
||||
allow_org_create = false
|
||||
|
||||
# Set to true to automatically assign new users to the default organization (id 1)
|
||||
auto_assign_org = true
|
||||
@@ -191,10 +206,18 @@ login_hint = email or username
|
||||
# Default UI theme ("dark" or "light")
|
||||
default_theme = dark
|
||||
|
||||
# External user management
|
||||
external_manage_link_url =
|
||||
external_manage_link_name =
|
||||
external_manage_info =
|
||||
|
||||
[auth]
|
||||
# Set to true to disable (hide) the login form, useful if you use OAuth
|
||||
disable_login_form = false
|
||||
|
||||
# Set to true to disable the signout link in the side menu. useful if you use auth.proxy
|
||||
disable_signout_menu = false
|
||||
|
||||
#################################### Anonymous Auth ######################
|
||||
[auth.anonymous]
|
||||
# enable anonymous access
|
||||
@@ -232,7 +255,8 @@ api_url = https://www.googleapis.com/oauth2/v1/userinfo
|
||||
allowed_domains =
|
||||
hosted_domain =
|
||||
|
||||
#################################### Grafana.net Auth ####################
|
||||
#################################### Grafana.com Auth ####################
|
||||
# legacy key names (so they work in env variables)
|
||||
[auth.grafananet]
|
||||
enabled = false
|
||||
allow_sign_up = true
|
||||
@@ -241,6 +265,14 @@ client_secret = some_secret
|
||||
scopes = user:email
|
||||
allowed_organizations =
|
||||
|
||||
[auth.grafana_com]
|
||||
enabled = false
|
||||
allow_sign_up = true
|
||||
client_id = some_id
|
||||
client_secret = some_secret
|
||||
scopes = user:email
|
||||
allowed_organizations =
|
||||
|
||||
#################################### Generic OAuth #######################
|
||||
[auth.generic_oauth]
|
||||
name = OAuth
|
||||
@@ -279,11 +311,13 @@ allow_sign_up = true
|
||||
enabled = false
|
||||
host = localhost:25
|
||||
user =
|
||||
# If the password contains # or ; you have to wrap it with trippel quotes. Ex """#password;"""
|
||||
password =
|
||||
cert_file =
|
||||
key_file =
|
||||
skip_verify = false
|
||||
from_address = admin@grafana.localhost
|
||||
from_name = Grafana
|
||||
|
||||
[emails]
|
||||
welcome_email_on_sign_up = false
|
||||
@@ -395,7 +429,9 @@ global_session = -1
|
||||
|
||||
#################################### Alerting ############################
|
||||
[alerting]
|
||||
# Makes it possible to turn off alert rule execution.
|
||||
# Disable alerting engine & UI features
|
||||
enabled = true
|
||||
# Makes it possible to turn off alert rule execution but alerting UI is visible
|
||||
execute_alerts = true
|
||||
|
||||
#################################### Internal Grafana Metrics ############
|
||||
@@ -411,7 +447,10 @@ address =
|
||||
prefix = prod.grafana.%(instance_name)s.
|
||||
|
||||
[grafana_net]
|
||||
url = https://grafana.net
|
||||
url = https://grafana.com
|
||||
|
||||
[grafana_com]
|
||||
url = https://grafana.com
|
||||
|
||||
#################################### External Image Storage ##############
|
||||
[external_image_storage]
|
||||
@@ -427,3 +466,4 @@ secret_key =
|
||||
url =
|
||||
username =
|
||||
password =
|
||||
public_url =
|
||||
|
||||
@@ -14,7 +14,7 @@ start_tls = false
|
||||
# set to true if you want to skip ssl cert validation
|
||||
ssl_skip_verify = false
|
||||
# set to the path to your root CA certificate or leave unset to use system defaults
|
||||
# root_ca_cert = /path/to/certificate.crt
|
||||
# root_ca_cert = "/path/to/certificate.crt"
|
||||
|
||||
# Search user bind dn
|
||||
bind_dn = "cn=admin,dc=grafana,dc=org"
|
||||
|
||||
@@ -26,7 +26,7 @@
|
||||
#
|
||||
#################################### Server ####################################
|
||||
[server]
|
||||
# Protocol (http or https)
|
||||
# Protocol (http, https, socket)
|
||||
;protocol = http
|
||||
|
||||
# The ip address to bind to, empty will bind to all interfaces
|
||||
@@ -59,6 +59,9 @@
|
||||
;cert_file =
|
||||
;cert_key =
|
||||
|
||||
# Unix socket path
|
||||
;socket =
|
||||
|
||||
#################################### Database ####################################
|
||||
[database]
|
||||
# You can configure the database connection by specifying type, host, name, user and password
|
||||
@@ -82,6 +85,13 @@
|
||||
# For "sqlite3" only, path relative to data_path setting
|
||||
;path = grafana.db
|
||||
|
||||
# Max idle conn setting default is 2
|
||||
;max_idle_conn = 2
|
||||
|
||||
# Max conn setting default is 0 (mean not set)
|
||||
;max_open_conn =
|
||||
|
||||
|
||||
#################################### Session ####################################
|
||||
[session]
|
||||
# Either "memory", "file", "redis", "mysql", "postgres", default is "file"
|
||||
@@ -104,6 +114,13 @@
|
||||
# Session life time, default is 86400
|
||||
;session_life_time = 86400
|
||||
|
||||
#################################### Data proxy ###########################
|
||||
[dataproxy]
|
||||
|
||||
# This enables data proxy logging, default is false
|
||||
;logging = false
|
||||
|
||||
|
||||
#################################### Analytics ####################################
|
||||
[analytics]
|
||||
# Server reporting, sends usage counters to stats.grafana.org every 24 hours.
|
||||
@@ -116,7 +133,7 @@
|
||||
# for new vesions (grafana itself and plugins), check is used
|
||||
# in some UI views to notify that grafana or plugin update exists
|
||||
# This option does not cause any auto updates, nor send any information
|
||||
# only a GET request to http://grafana.net to get latest versions
|
||||
# only a GET request to http://grafana.com to get latest versions
|
||||
;check_for_updates = true
|
||||
|
||||
# Google Analytics universal tracking code, only enabled if you specify an id here
|
||||
@@ -176,10 +193,18 @@
|
||||
# Default UI theme ("dark" or "light")
|
||||
;default_theme = dark
|
||||
|
||||
# External user management, these options affect the organization users view
|
||||
;external_manage_link_url =
|
||||
;external_manage_link_name =
|
||||
;external_manage_info =
|
||||
|
||||
[auth]
|
||||
# Set to true to disable (hide) the login form, useful if you use OAuth, defaults to false
|
||||
;disable_login_form = false
|
||||
|
||||
# Set to true to disable the signout link in the side menu. useful if you use auth.proxy, defaults to false
|
||||
;disable_signout_menu = false
|
||||
|
||||
#################################### Anonymous Auth ##########################
|
||||
[auth.anonymous]
|
||||
# enable anonymous access
|
||||
@@ -230,8 +255,8 @@
|
||||
;team_ids =
|
||||
;allowed_organizations =
|
||||
|
||||
#################################### Grafana.net Auth ####################
|
||||
[auth.grafananet]
|
||||
#################################### Grafana.com Auth ####################
|
||||
[auth.grafana_com]
|
||||
;enabled = false
|
||||
;allow_sign_up = true
|
||||
;client_id = some_id
|
||||
@@ -263,11 +288,13 @@
|
||||
;enabled = false
|
||||
;host = localhost:25
|
||||
;user =
|
||||
# If the password contains # or ; you have to wrap it with trippel quotes. Ex """#password;"""
|
||||
;password =
|
||||
;cert_file =
|
||||
;key_file =
|
||||
;skip_verify = false
|
||||
;from_address = admin@grafana.localhost
|
||||
;from_name = Grafana
|
||||
|
||||
[emails]
|
||||
;welcome_email_on_sign_up = false
|
||||
@@ -278,7 +305,7 @@
|
||||
# Use space to separate multiple modes, e.g. "console file"
|
||||
;mode = console file
|
||||
|
||||
# Either "trace", "debug", "info", "warn", "error", "critical", default is "info"
|
||||
# Either "debug", "info", "warn", "error", "critical", default is "info"
|
||||
;level = info
|
||||
|
||||
# optional settings to set different levels for specific loggers. Ex filters = sqlstore:debug
|
||||
@@ -342,9 +369,11 @@
|
||||
;enabled = false
|
||||
;path = /var/lib/grafana/dashboards
|
||||
|
||||
#################################### Alerting ######################################
|
||||
#################################### Alerting ############################
|
||||
[alerting]
|
||||
# Makes it possible to turn off alert rule execution.
|
||||
# Disable alerting engine & UI features
|
||||
;enabled = true
|
||||
# Makes it possible to turn off alert rule execution but alerting UI is visible
|
||||
;execute_alerts = true
|
||||
|
||||
#################################### Internal Grafana Metrics ##########################
|
||||
@@ -362,10 +391,10 @@
|
||||
;address =
|
||||
;prefix = prod.grafana.%(instance_name)s.
|
||||
|
||||
#################################### Internal Grafana Metrics ##########################
|
||||
# Url used to to import dashboards directly from Grafana.net
|
||||
[grafana_net]
|
||||
;url = https://grafana.net
|
||||
#################################### Grafana.com integration ##########################
|
||||
# Url used to to import dashboards directly from Grafana.com
|
||||
[grafana_com]
|
||||
;url = https://grafana.com
|
||||
|
||||
#################################### External image storage ##########################
|
||||
[external_image_storage]
|
||||
@@ -380,5 +409,6 @@
|
||||
|
||||
[external_image_storage.webdav]
|
||||
;url =
|
||||
;public_url =
|
||||
;username =
|
||||
;password =
|
||||
|
||||
@@ -32,6 +32,7 @@ add ./files/my_htpasswd /etc/nginx/.htpasswd
|
||||
# Add system service config
|
||||
add ./files/nginx.conf /etc/nginx/nginx.conf
|
||||
add ./files/supervisord.conf /etc/supervisor/conf.d/supervisord.conf
|
||||
|
||||
# Nginx
|
||||
#
|
||||
# graphite
|
||||
@@ -39,6 +40,7 @@ expose 80
|
||||
|
||||
# Carbon line receiver port
|
||||
expose 2003
|
||||
|
||||
# Carbon cache query port
|
||||
expose 7002
|
||||
|
||||
|
||||
@@ -4,7 +4,6 @@ graphite:
|
||||
- "8080:80"
|
||||
- "2003:2003"
|
||||
volumes:
|
||||
- /var/docker/gfdev/graphite:/opt/graphite/storage/whisper
|
||||
- /etc/localtime:/etc/localtime:ro
|
||||
- /etc/timezone:/etc/timezone:ro
|
||||
|
||||
|
||||
93
docker/blocks/graphite1/Dockerfile
Normal file
93
docker/blocks/graphite1/Dockerfile
Normal file
@@ -0,0 +1,93 @@
|
||||
FROM phusion/baseimage:0.9.22
|
||||
MAINTAINER Denys Zhdanov <denis.zhdanov@gmail.com>
|
||||
|
||||
RUN apt-get -y update \
|
||||
&& apt-get -y upgrade \
|
||||
&& apt-get -y --force-yes install vim \
|
||||
nginx \
|
||||
python-dev \
|
||||
python-flup \
|
||||
python-pip \
|
||||
python-ldap \
|
||||
expect \
|
||||
git \
|
||||
memcached \
|
||||
sqlite3 \
|
||||
libffi-dev \
|
||||
libcairo2 \
|
||||
libcairo2-dev \
|
||||
python-cairo \
|
||||
python-rrdtool \
|
||||
pkg-config \
|
||||
nodejs \
|
||||
&& rm -rf /var/lib/apt/lists/*
|
||||
|
||||
# fix python dependencies (LTS Django and newer memcached/txAMQP)
|
||||
RUN pip install django==1.8.18 \
|
||||
python-memcached==1.53 \
|
||||
txAMQP==0.6.2 \
|
||||
&& pip install --upgrade pip
|
||||
|
||||
# install whisper
|
||||
RUN git clone -b 1.0.2 --depth 1 https://github.com/graphite-project/whisper.git /usr/local/src/whisper
|
||||
WORKDIR /usr/local/src/whisper
|
||||
RUN python ./setup.py install
|
||||
|
||||
# install carbon
|
||||
RUN git clone -b 1.0.2 --depth 1 https://github.com/graphite-project/carbon.git /usr/local/src/carbon
|
||||
WORKDIR /usr/local/src/carbon
|
||||
RUN pip install -r requirements.txt \
|
||||
&& python ./setup.py install
|
||||
|
||||
# install graphite
|
||||
RUN git clone -b 1.0.2 --depth 1 https://github.com/graphite-project/graphite-web.git /usr/local/src/graphite-web
|
||||
WORKDIR /usr/local/src/graphite-web
|
||||
RUN pip install -r requirements.txt \
|
||||
&& python ./setup.py install
|
||||
ADD conf/opt/graphite/conf/*.conf /opt/graphite/conf/
|
||||
ADD conf/opt/graphite/webapp/graphite/local_settings.py /opt/graphite/webapp/graphite/local_settings.py
|
||||
ADD conf/opt/graphite/webapp/graphite/app_settings.py /opt/graphite/webapp/graphite/app_settings.py
|
||||
WORKDIR /opt/graphite/webapp
|
||||
RUN mkdir -p /var/log/graphite/ \
|
||||
&& PYTHONPATH=/opt/graphite/webapp django-admin.py collectstatic --noinput --settings=graphite.settings
|
||||
|
||||
# install statsd
|
||||
RUN git clone -b v0.7.2 https://github.com/etsy/statsd.git /opt/statsd
|
||||
ADD conf/opt/statsd/config.js /opt/statsd/config.js
|
||||
|
||||
# config nginx
|
||||
RUN rm /etc/nginx/sites-enabled/default
|
||||
ADD conf/etc/nginx/nginx.conf /etc/nginx/nginx.conf
|
||||
ADD conf/etc/nginx/sites-enabled/graphite-statsd.conf /etc/nginx/sites-enabled/graphite-statsd.conf
|
||||
|
||||
# init django admin
|
||||
ADD conf/usr/local/bin/django_admin_init.exp /usr/local/bin/django_admin_init.exp
|
||||
ADD conf/usr/local/bin/manage.sh /usr/local/bin/manage.sh
|
||||
RUN chmod +x /usr/local/bin/manage.sh \
|
||||
&& /usr/local/bin/django_admin_init.exp
|
||||
|
||||
# logging support
|
||||
RUN mkdir -p /var/log/carbon /var/log/graphite /var/log/nginx
|
||||
ADD conf/etc/logrotate.d/graphite-statsd /etc/logrotate.d/graphite-statsd
|
||||
|
||||
# daemons
|
||||
ADD conf/etc/service/carbon/run /etc/service/carbon/run
|
||||
ADD conf/etc/service/carbon-aggregator/run /etc/service/carbon-aggregator/run
|
||||
ADD conf/etc/service/graphite/run /etc/service/graphite/run
|
||||
ADD conf/etc/service/statsd/run /etc/service/statsd/run
|
||||
ADD conf/etc/service/nginx/run /etc/service/nginx/run
|
||||
|
||||
# default conf setup
|
||||
ADD conf /etc/graphite-statsd/conf
|
||||
ADD conf/etc/my_init.d/01_conf_init.sh /etc/my_init.d/01_conf_init.sh
|
||||
|
||||
# cleanup
|
||||
RUN apt-get clean\
|
||||
&& rm -rf /var/lib/apt/lists/* /tmp/* /var/tmp/*
|
||||
|
||||
# defaults
|
||||
EXPOSE 80 2003-2004 2023-2024 8125/udp 8126
|
||||
VOLUME ["/opt/graphite/conf", "/opt/graphite/storage", "/etc/nginx", "/opt/statsd", "/etc/logrotate.d", "/var/log"]
|
||||
WORKDIR /
|
||||
ENV HOME /root
|
||||
CMD ["/sbin/my_init"]
|
||||
11
docker/blocks/graphite1/conf/etc/logrotate.d/graphite-statsd
Normal file
11
docker/blocks/graphite1/conf/etc/logrotate.d/graphite-statsd
Normal file
@@ -0,0 +1,11 @@
|
||||
/var/log/*.log /var/log/*/*.log {
|
||||
weekly
|
||||
size 50M
|
||||
missingok
|
||||
rotate 10
|
||||
compress
|
||||
delaycompress
|
||||
notifempty
|
||||
copytruncate
|
||||
su root syslog
|
||||
}
|
||||
36
docker/blocks/graphite1/conf/etc/my_init.d/01_conf_init.sh
Executable file
36
docker/blocks/graphite1/conf/etc/my_init.d/01_conf_init.sh
Executable file
@@ -0,0 +1,36 @@
|
||||
#!/bin/bash
|
||||
|
||||
conf_dir=/etc/graphite-statsd/conf
|
||||
|
||||
# auto setup graphite with default configs if /opt/graphite is missing
|
||||
# needed for the use case when a docker host volume is mounted at an of the following:
|
||||
# - /opt/graphite
|
||||
# - /opt/graphite/conf
|
||||
# - /opt/graphite/webapp/graphite
|
||||
graphite_dir_contents=$(find /opt/graphite -mindepth 1 -print -quit)
|
||||
graphite_conf_dir_contents=$(find /opt/graphite/conf -mindepth 1 -print -quit)
|
||||
graphite_webapp_dir_contents=$(find /opt/graphite/webapp/graphite -mindepth 1 -print -quit)
|
||||
graphite_storage_dir_contents=$(find /opt/graphite/storage -mindepth 1 -print -quit)
|
||||
if [[ -z $graphite_dir_contents ]]; then
|
||||
git clone -b 1.0.2 --depth 1 https://github.com/graphite-project/graphite-web.git /usr/local/src/graphite-web
|
||||
cd /usr/local/src/graphite-web && python ./setup.py install
|
||||
fi
|
||||
if [[ -z $graphite_storage_dir_contents ]]; then
|
||||
/usr/local/bin/django_admin_init.exp
|
||||
fi
|
||||
if [[ -z $graphite_conf_dir_contents ]]; then
|
||||
cp -R $conf_dir/opt/graphite/conf/*.conf /opt/graphite/conf/
|
||||
fi
|
||||
if [[ -z $graphite_webapp_dir_contents ]]; then
|
||||
cp $conf_dir/opt/graphite/webapp/graphite/local_settings.py /opt/graphite/webapp/graphite/local_settings.py
|
||||
fi
|
||||
|
||||
# auto setup statsd with default config if /opt/statsd is missing
|
||||
# needed for the use case when a docker host volume is mounted at an of the following:
|
||||
# - /opt/statsd
|
||||
statsd_dir_contents=$(find /opt/statsd -mindepth 1 -print -quit)
|
||||
if [[ -z $statsd_dir_contents ]]; then
|
||||
git clone -b v0.7.2 https://github.com/etsy/statsd.git /opt/statsd
|
||||
cp $conf_dir/opt/statsd/config.js /opt/statsd/config.js
|
||||
fi
|
||||
|
||||
96
docker/blocks/graphite1/conf/etc/nginx/nginx.conf
Normal file
96
docker/blocks/graphite1/conf/etc/nginx/nginx.conf
Normal file
@@ -0,0 +1,96 @@
|
||||
user www-data;
|
||||
worker_processes 4;
|
||||
pid /run/nginx.pid;
|
||||
daemon off;
|
||||
|
||||
events {
|
||||
worker_connections 768;
|
||||
# multi_accept on;
|
||||
}
|
||||
|
||||
http {
|
||||
|
||||
##
|
||||
# Basic Settings
|
||||
##
|
||||
|
||||
sendfile on;
|
||||
tcp_nopush on;
|
||||
tcp_nodelay on;
|
||||
keepalive_timeout 65;
|
||||
types_hash_max_size 2048;
|
||||
# server_tokens off;
|
||||
|
||||
# server_names_hash_bucket_size 64;
|
||||
# server_name_in_redirect off;
|
||||
|
||||
include /etc/nginx/mime.types;
|
||||
default_type application/octet-stream;
|
||||
|
||||
##
|
||||
# Logging Settings
|
||||
##
|
||||
|
||||
access_log /var/log/nginx/access.log;
|
||||
error_log /var/log/nginx/error.log;
|
||||
|
||||
##
|
||||
# Gzip Settings
|
||||
##
|
||||
|
||||
gzip on;
|
||||
gzip_disable "msie6";
|
||||
|
||||
# gzip_vary on;
|
||||
# gzip_proxied any;
|
||||
# gzip_comp_level 6;
|
||||
# gzip_buffers 16 8k;
|
||||
# gzip_http_version 1.1;
|
||||
# gzip_types text/plain text/css application/json application/x-javascript text/xml application/xml application/xml+rss text/javascript;
|
||||
|
||||
##
|
||||
# nginx-naxsi config
|
||||
##
|
||||
# Uncomment it if you installed nginx-naxsi
|
||||
##
|
||||
|
||||
#include /etc/nginx/naxsi_core.rules;
|
||||
|
||||
##
|
||||
# nginx-passenger config
|
||||
##
|
||||
# Uncomment it if you installed nginx-passenger
|
||||
##
|
||||
|
||||
#passenger_root /usr;
|
||||
#passenger_ruby /usr/bin/ruby;
|
||||
|
||||
##
|
||||
# Virtual Host Configs
|
||||
##
|
||||
|
||||
include /etc/nginx/conf.d/*.conf;
|
||||
include /etc/nginx/sites-enabled/*;
|
||||
}
|
||||
|
||||
|
||||
#mail {
|
||||
# # See sample authentication script at:
|
||||
# # http://wiki.nginx.org/ImapAuthenticateWithApachePhpScript
|
||||
#
|
||||
# # auth_http localhost/auth.php;
|
||||
# # pop3_capabilities "TOP" "USER";
|
||||
# # imap_capabilities "IMAP4rev1" "UIDPLUS";
|
||||
#
|
||||
# server {
|
||||
# listen localhost:110;
|
||||
# protocol pop3;
|
||||
# proxy on;
|
||||
# }
|
||||
#
|
||||
# server {
|
||||
# listen localhost:143;
|
||||
# protocol imap;
|
||||
# proxy on;
|
||||
# }
|
||||
#}
|
||||
@@ -0,0 +1,31 @@
|
||||
server {
|
||||
listen 80;
|
||||
root /opt/graphite/static;
|
||||
index index.html;
|
||||
|
||||
location /media {
|
||||
# django admin static files
|
||||
alias /usr/local/lib/python2.7/dist-packages/django/contrib/admin/media/;
|
||||
}
|
||||
|
||||
location /admin/auth/admin {
|
||||
alias /usr/local/lib/python2.7/dist-packages/django/contrib/admin/static/admin;
|
||||
}
|
||||
|
||||
location /admin/auth/user/admin {
|
||||
alias /usr/local/lib/python2.7/dist-packages/django/contrib/admin/static/admin;
|
||||
}
|
||||
|
||||
location / {
|
||||
proxy_pass http://localhost:8080;
|
||||
proxy_set_header Host $host;
|
||||
proxy_set_header X-Real-IP $remote_addr;
|
||||
proxy_set_header X-Forwarded-For $proxy_add_x_forwarded_for;
|
||||
|
||||
add_header 'Access-Control-Allow-Origin' '*';
|
||||
add_header 'Access-Control-Allow-Methods' 'GET, POST, OPTIONS';
|
||||
add_header 'Access-Control-Allow-Headers' 'Authorization, Content-Type';
|
||||
add_header 'Access-Control-Allow-Credentials' 'true';
|
||||
}
|
||||
|
||||
}
|
||||
4
docker/blocks/graphite1/conf/etc/service/carbon-aggregator/run
Executable file
4
docker/blocks/graphite1/conf/etc/service/carbon-aggregator/run
Executable file
@@ -0,0 +1,4 @@
|
||||
#!/bin/bash
|
||||
|
||||
rm -f /opt/graphite/storage/carbon-aggregator-a.pid
|
||||
exec /usr/bin/python /opt/graphite/bin/carbon-aggregator.py start --debug 2>&1 >> /var/log/carbon-aggregator.log
|
||||
4
docker/blocks/graphite1/conf/etc/service/carbon/run
Executable file
4
docker/blocks/graphite1/conf/etc/service/carbon/run
Executable file
@@ -0,0 +1,4 @@
|
||||
#!/bin/bash
|
||||
|
||||
rm -f /opt/graphite/storage/carbon-cache-a.pid
|
||||
exec /usr/bin/python /opt/graphite/bin/carbon-cache.py start --debug 2>&1 >> /var/log/carbon.log
|
||||
3
docker/blocks/graphite1/conf/etc/service/graphite/run
Executable file
3
docker/blocks/graphite1/conf/etc/service/graphite/run
Executable file
@@ -0,0 +1,3 @@
|
||||
#!/bin/bash
|
||||
|
||||
export PYTHONPATH=/opt/graphite/webapp && exec /usr/local/bin/gunicorn wsgi --workers=4 --bind=127.0.0.1:8080 --log-file=/var/log/gunicorn.log --preload --pythonpath=/opt/graphite/webapp/graphite
|
||||
4
docker/blocks/graphite1/conf/etc/service/nginx/run
Executable file
4
docker/blocks/graphite1/conf/etc/service/nginx/run
Executable file
@@ -0,0 +1,4 @@
|
||||
#!/bin/bash
|
||||
|
||||
mkdir -p /var/log/nginx
|
||||
exec /usr/sbin/nginx -c /etc/nginx/nginx.conf
|
||||
4
docker/blocks/graphite1/conf/etc/service/statsd/run
Executable file
4
docker/blocks/graphite1/conf/etc/service/statsd/run
Executable file
@@ -0,0 +1,4 @@
|
||||
#!/bin/bash
|
||||
|
||||
exec /usr/bin/nodejs /opt/statsd/stats.js /opt/statsd/config.js >> /var/log/statsd.log 2>&1
|
||||
|
||||
@@ -0,0 +1,35 @@
|
||||
# The form of each line in this file should be as follows:
|
||||
#
|
||||
# output_template (frequency) = method input_pattern
|
||||
#
|
||||
# This will capture any received metrics that match 'input_pattern'
|
||||
# for calculating an aggregate metric. The calculation will occur
|
||||
# every 'frequency' seconds and the 'method' can specify 'sum' or
|
||||
# 'avg'. The name of the aggregate metric will be derived from
|
||||
# 'output_template' filling in any captured fields from 'input_pattern'.
|
||||
#
|
||||
# For example, if you're metric naming scheme is:
|
||||
#
|
||||
# <env>.applications.<app>.<server>.<metric>
|
||||
#
|
||||
# You could configure some aggregations like so:
|
||||
#
|
||||
# <env>.applications.<app>.all.requests (60) = sum <env>.applications.<app>.*.requests
|
||||
# <env>.applications.<app>.all.latency (60) = avg <env>.applications.<app>.*.latency
|
||||
#
|
||||
# As an example, if the following metrics are received:
|
||||
#
|
||||
# prod.applications.apache.www01.requests
|
||||
# prod.applications.apache.www01.requests
|
||||
#
|
||||
# They would all go into the same aggregation buffer and after 60 seconds the
|
||||
# aggregate metric 'prod.applications.apache.all.requests' would be calculated
|
||||
# by summing their values.
|
||||
#
|
||||
# Template components such as <env> will match everything up to the next dot.
|
||||
# To match metric multiple components including the dots, use <<metric>> in the
|
||||
# input template:
|
||||
#
|
||||
# <env>.applications.<app>.all.<app_metric> (60) = sum <env>.applications.<app>.*.<<app_metric>>
|
||||
#
|
||||
# Note that any time this file is modified, it will be re-read automatically.
|
||||
@@ -0,0 +1,5 @@
|
||||
# This file takes a single regular expression per line
|
||||
# If USE_WHITELIST is set to True in carbon.conf, any metrics received which
|
||||
# match one of these expressions will be dropped
|
||||
# This file is reloaded automatically when changes are made
|
||||
^some\.noisy\.metric\.prefix\..*
|
||||
@@ -0,0 +1,75 @@
|
||||
# This is a configuration file with AMQP enabled
|
||||
|
||||
[cache]
|
||||
LOCAL_DATA_DIR =
|
||||
|
||||
# Specify the user to drop privileges to
|
||||
# If this is blank carbon runs as the user that invokes it
|
||||
# This user must have write access to the local data directory
|
||||
USER =
|
||||
|
||||
# Limit the size of the cache to avoid swapping or becoming CPU bound.
|
||||
# Sorts and serving cache queries gets more expensive as the cache grows.
|
||||
# Use the value "inf" (infinity) for an unlimited cache size.
|
||||
MAX_CACHE_SIZE = inf
|
||||
|
||||
# Limits the number of whisper update_many() calls per second, which effectively
|
||||
# means the number of write requests sent to the disk. This is intended to
|
||||
# prevent over-utilizing the disk and thus starving the rest of the system.
|
||||
# When the rate of required updates exceeds this, then carbon's caching will
|
||||
# take effect and increase the overall throughput accordingly.
|
||||
MAX_UPDATES_PER_SECOND = 1000
|
||||
|
||||
# Softly limits the number of whisper files that get created each minute.
|
||||
# Setting this value low (like at 50) is a good way to ensure your graphite
|
||||
# system will not be adversely impacted when a bunch of new metrics are
|
||||
# sent to it. The trade off is that it will take much longer for those metrics'
|
||||
# database files to all get created and thus longer until the data becomes usable.
|
||||
# Setting this value high (like "inf" for infinity) will cause graphite to create
|
||||
# the files quickly but at the risk of slowing I/O down considerably for a while.
|
||||
MAX_CREATES_PER_MINUTE = inf
|
||||
|
||||
LINE_RECEIVER_INTERFACE = 0.0.0.0
|
||||
LINE_RECEIVER_PORT = 2003
|
||||
|
||||
UDP_RECEIVER_INTERFACE = 0.0.0.0
|
||||
UDP_RECEIVER_PORT = 2003
|
||||
|
||||
PICKLE_RECEIVER_INTERFACE = 0.0.0.0
|
||||
PICKLE_RECEIVER_PORT = 2004
|
||||
|
||||
CACHE_QUERY_INTERFACE = 0.0.0.0
|
||||
CACHE_QUERY_PORT = 7002
|
||||
|
||||
# Enable AMQP if you want to receve metrics using you amqp broker
|
||||
ENABLE_AMQP = True
|
||||
|
||||
# Verbose means a line will be logged for every metric received
|
||||
# useful for testing
|
||||
AMQP_VERBOSE = True
|
||||
|
||||
# your credentials for the amqp server
|
||||
# AMQP_USER = guest
|
||||
# AMQP_PASSWORD = guest
|
||||
|
||||
# the network settings for the amqp server
|
||||
# AMQP_HOST = localhost
|
||||
# AMQP_PORT = 5672
|
||||
|
||||
# if you want to include the metric name as part of the message body
|
||||
# instead of as the routing key, set this to True
|
||||
# AMQP_METRIC_NAME_IN_BODY = False
|
||||
|
||||
# NOTE: you cannot run both a cache and a relay on the same server
|
||||
# with the default configuration, you have to specify a distinict
|
||||
# interfaces and ports for the listeners.
|
||||
|
||||
[relay]
|
||||
LINE_RECEIVER_INTERFACE = 0.0.0.0
|
||||
LINE_RECEIVER_PORT = 2003
|
||||
|
||||
PICKLE_RECEIVER_INTERFACE = 0.0.0.0
|
||||
PICKLE_RECEIVER_PORT = 2004
|
||||
|
||||
CACHE_SERVERS = server1, server2, server3
|
||||
MAX_QUEUE_SIZE = 10000
|
||||
359
docker/blocks/graphite1/conf/opt/graphite/conf/carbon.conf
Normal file
359
docker/blocks/graphite1/conf/opt/graphite/conf/carbon.conf
Normal file
@@ -0,0 +1,359 @@
|
||||
[cache]
|
||||
# Configure carbon directories.
|
||||
#
|
||||
# OS environment variables can be used to tell carbon where graphite is
|
||||
# installed, where to read configuration from and where to write data.
|
||||
#
|
||||
# GRAPHITE_ROOT - Root directory of the graphite installation.
|
||||
# Defaults to ../
|
||||
# GRAPHITE_CONF_DIR - Configuration directory (where this file lives).
|
||||
# Defaults to $GRAPHITE_ROOT/conf/
|
||||
# GRAPHITE_STORAGE_DIR - Storage directory for whipser/rrd/log/pid files.
|
||||
# Defaults to $GRAPHITE_ROOT/storage/
|
||||
#
|
||||
# To change other directory paths, add settings to this file. The following
|
||||
# configuration variables are available with these default values:
|
||||
#
|
||||
# STORAGE_DIR = $GRAPHITE_STORAGE_DIR
|
||||
# LOCAL_DATA_DIR = STORAGE_DIR/whisper/
|
||||
# WHITELISTS_DIR = STORAGE_DIR/lists/
|
||||
# CONF_DIR = STORAGE_DIR/conf/
|
||||
# LOG_DIR = STORAGE_DIR/log/
|
||||
# PID_DIR = STORAGE_DIR/
|
||||
#
|
||||
# For FHS style directory structures, use:
|
||||
#
|
||||
# STORAGE_DIR = /var/lib/carbon/
|
||||
# CONF_DIR = /etc/carbon/
|
||||
# LOG_DIR = /var/log/carbon/
|
||||
# PID_DIR = /var/run/
|
||||
#
|
||||
#LOCAL_DATA_DIR = /opt/graphite/storage/whisper/
|
||||
|
||||
# Enable daily log rotation. If disabled, a kill -HUP can be used after a manual rotate
|
||||
ENABLE_LOGROTATION = True
|
||||
|
||||
# Specify the user to drop privileges to
|
||||
# If this is blank carbon runs as the user that invokes it
|
||||
# This user must have write access to the local data directory
|
||||
USER =
|
||||
#
|
||||
# NOTE: The above settings must be set under [relay] and [aggregator]
|
||||
# to take effect for those daemons as well
|
||||
|
||||
# Limit the size of the cache to avoid swapping or becoming CPU bound.
|
||||
# Sorts and serving cache queries gets more expensive as the cache grows.
|
||||
# Use the value "inf" (infinity) for an unlimited cache size.
|
||||
MAX_CACHE_SIZE = inf
|
||||
|
||||
# Limits the number of whisper update_many() calls per second, which effectively
|
||||
# means the number of write requests sent to the disk. This is intended to
|
||||
# prevent over-utilizing the disk and thus starving the rest of the system.
|
||||
# When the rate of required updates exceeds this, then carbon's caching will
|
||||
# take effect and increase the overall throughput accordingly.
|
||||
MAX_UPDATES_PER_SECOND = 500
|
||||
|
||||
# If defined, this changes the MAX_UPDATES_PER_SECOND in Carbon when a
|
||||
# stop/shutdown is initiated. This helps when MAX_UPDATES_PER_SECOND is
|
||||
# relatively low and carbon has cached a lot of updates; it enables the carbon
|
||||
# daemon to shutdown more quickly.
|
||||
# MAX_UPDATES_PER_SECOND_ON_SHUTDOWN = 1000
|
||||
|
||||
# Softly limits the number of whisper files that get created each minute.
|
||||
# Setting this value low (like at 50) is a good way to ensure your graphite
|
||||
# system will not be adversely impacted when a bunch of new metrics are
|
||||
# sent to it. The trade off is that it will take much longer for those metrics'
|
||||
# database files to all get created and thus longer until the data becomes usable.
|
||||
# Setting this value high (like "inf" for infinity) will cause graphite to create
|
||||
# the files quickly but at the risk of slowing I/O down considerably for a while.
|
||||
MAX_CREATES_PER_MINUTE = 50
|
||||
|
||||
LINE_RECEIVER_INTERFACE = 0.0.0.0
|
||||
LINE_RECEIVER_PORT = 2003
|
||||
|
||||
# Set this to True to enable the UDP listener. By default this is off
|
||||
# because it is very common to run multiple carbon daemons and managing
|
||||
# another (rarely used) port for every carbon instance is not fun.
|
||||
ENABLE_UDP_LISTENER = False
|
||||
UDP_RECEIVER_INTERFACE = 0.0.0.0
|
||||
UDP_RECEIVER_PORT = 2003
|
||||
|
||||
PICKLE_RECEIVER_INTERFACE = 0.0.0.0
|
||||
PICKLE_RECEIVER_PORT = 2004
|
||||
|
||||
# Set to false to disable logging of successful connections
|
||||
LOG_LISTENER_CONNECTIONS = True
|
||||
|
||||
# Per security concerns outlined in Bug #817247 the pickle receiver
|
||||
# will use a more secure and slightly less efficient unpickler.
|
||||
# Set this to True to revert to the old-fashioned insecure unpickler.
|
||||
USE_INSECURE_UNPICKLER = False
|
||||
|
||||
CACHE_QUERY_INTERFACE = 0.0.0.0
|
||||
CACHE_QUERY_PORT = 7002
|
||||
|
||||
# Set this to False to drop datapoints received after the cache
|
||||
# reaches MAX_CACHE_SIZE. If this is True (the default) then sockets
|
||||
# over which metrics are received will temporarily stop accepting
|
||||
# data until the cache size falls below 95% MAX_CACHE_SIZE.
|
||||
USE_FLOW_CONTROL = True
|
||||
|
||||
# By default, carbon-cache will log every whisper update and cache hit. This can be excessive and
|
||||
# degrade performance if logging on the same volume as the whisper data is stored.
|
||||
LOG_UPDATES = False
|
||||
LOG_CACHE_HITS = False
|
||||
LOG_CACHE_QUEUE_SORTS = True
|
||||
|
||||
# The thread that writes metrics to disk can use on of the following strategies
|
||||
# determining the order in which metrics are removed from cache and flushed to
|
||||
# disk. The default option preserves the same behavior as has been historically
|
||||
# available in version 0.9.10.
|
||||
#
|
||||
# sorted - All metrics in the cache will be counted and an ordered list of
|
||||
# them will be sorted according to the number of datapoints in the cache at the
|
||||
# moment of the list's creation. Metrics will then be flushed from the cache to
|
||||
# disk in that order.
|
||||
#
|
||||
# max - The writer thread will always pop and flush the metric from cache
|
||||
# that has the most datapoints. This will give a strong flush preference to
|
||||
# frequently updated metrics and will also reduce random file-io. Infrequently
|
||||
# updated metrics may only ever be persisted to disk at daemon shutdown if
|
||||
# there are a large number of metrics which receive very frequent updates OR if
|
||||
# disk i/o is very slow.
|
||||
#
|
||||
# naive - Metrics will be flushed from the cache to disk in an unordered
|
||||
# fashion. This strategy may be desirable in situations where the storage for
|
||||
# whisper files is solid state, CPU resources are very limited or deference to
|
||||
# the OS's i/o scheduler is expected to compensate for the random write
|
||||
# pattern.
|
||||
#
|
||||
CACHE_WRITE_STRATEGY = sorted
|
||||
|
||||
# On some systems it is desirable for whisper to write synchronously.
|
||||
# Set this option to True if you'd like to try this. Basically it will
|
||||
# shift the onus of buffering writes from the kernel into carbon's cache.
|
||||
WHISPER_AUTOFLUSH = False
|
||||
|
||||
# By default new Whisper files are created pre-allocated with the data region
|
||||
# filled with zeros to prevent fragmentation and speed up contiguous reads and
|
||||
# writes (which are common). Enabling this option will cause Whisper to create
|
||||
# the file sparsely instead. Enabling this option may allow a large increase of
|
||||
# MAX_CREATES_PER_MINUTE but may have longer term performance implications
|
||||
# depending on the underlying storage configuration.
|
||||
# WHISPER_SPARSE_CREATE = False
|
||||
|
||||
# Only beneficial on linux filesystems that support the fallocate system call.
|
||||
# It maintains the benefits of contiguous reads/writes, but with a potentially
|
||||
# much faster creation speed, by allowing the kernel to handle the block
|
||||
# allocation and zero-ing. Enabling this option may allow a large increase of
|
||||
# MAX_CREATES_PER_MINUTE. If enabled on an OS or filesystem that is unsupported
|
||||
# this option will gracefully fallback to standard POSIX file access methods.
|
||||
WHISPER_FALLOCATE_CREATE = True
|
||||
|
||||
# Enabling this option will cause Whisper to lock each Whisper file it writes
|
||||
# to with an exclusive lock (LOCK_EX, see: man 2 flock). This is useful when
|
||||
# multiple carbon-cache daemons are writing to the same files
|
||||
# WHISPER_LOCK_WRITES = False
|
||||
|
||||
# Set this to True to enable whitelisting and blacklisting of metrics in
|
||||
# CONF_DIR/whitelist and CONF_DIR/blacklist. If the whitelist is missing or
|
||||
# empty, all metrics will pass through
|
||||
# USE_WHITELIST = False
|
||||
|
||||
# By default, carbon itself will log statistics (such as a count,
|
||||
# metricsReceived) with the top level prefix of 'carbon' at an interval of 60
|
||||
# seconds. Set CARBON_METRIC_INTERVAL to 0 to disable instrumentation
|
||||
# CARBON_METRIC_PREFIX = carbon
|
||||
# CARBON_METRIC_INTERVAL = 60
|
||||
|
||||
# Enable AMQP if you want to receve metrics using an amqp broker
|
||||
# ENABLE_AMQP = False
|
||||
|
||||
# Verbose means a line will be logged for every metric received
|
||||
# useful for testing
|
||||
# AMQP_VERBOSE = False
|
||||
|
||||
# AMQP_HOST = localhost
|
||||
# AMQP_PORT = 5672
|
||||
# AMQP_VHOST = /
|
||||
# AMQP_USER = guest
|
||||
# AMQP_PASSWORD = guest
|
||||
# AMQP_EXCHANGE = graphite
|
||||
# AMQP_METRIC_NAME_IN_BODY = False
|
||||
|
||||
# The manhole interface allows you to SSH into the carbon daemon
|
||||
# and get a python interpreter. BE CAREFUL WITH THIS! If you do
|
||||
# something like time.sleep() in the interpreter, the whole process
|
||||
# will sleep! This is *extremely* helpful in debugging, assuming
|
||||
# you are familiar with the code. If you are not, please don't
|
||||
# mess with this, you are asking for trouble :)
|
||||
#
|
||||
# ENABLE_MANHOLE = False
|
||||
# MANHOLE_INTERFACE = 127.0.0.1
|
||||
# MANHOLE_PORT = 7222
|
||||
# MANHOLE_USER = admin
|
||||
# MANHOLE_PUBLIC_KEY = ssh-rsa AAAAB3NzaC1yc2EAAAABiwAaAIEAoxN0sv/e4eZCPpi3N3KYvyzRaBaMeS2RsOQ/cDuKv11dlNzVeiyc3RFmCv5Rjwn/lQ79y0zyHxw67qLyhQ/kDzINc4cY41ivuQXm2tPmgvexdrBv5nsfEpjs3gLZfJnyvlcVyWK/lId8WUvEWSWHTzsbtmXAF2raJMdgLTbQ8wE=
|
||||
|
||||
# Patterns for all of the metrics this machine will store. Read more at
|
||||
# http://en.wikipedia.org/wiki/Advanced_Message_Queuing_Protocol#Bindings
|
||||
#
|
||||
# Example: store all sales, linux servers, and utilization metrics
|
||||
# BIND_PATTERNS = sales.#, servers.linux.#, #.utilization
|
||||
#
|
||||
# Example: store everything
|
||||
# BIND_PATTERNS = #
|
||||
|
||||
# To configure special settings for the carbon-cache instance 'b', uncomment this:
|
||||
#[cache:b]
|
||||
#LINE_RECEIVER_PORT = 2103
|
||||
#PICKLE_RECEIVER_PORT = 2104
|
||||
#CACHE_QUERY_PORT = 7102
|
||||
# and any other settings you want to customize, defaults are inherited
|
||||
# from [carbon] section.
|
||||
# You can then specify the --instance=b option to manage this instance
|
||||
|
||||
|
||||
|
||||
[relay]
|
||||
LINE_RECEIVER_INTERFACE = 0.0.0.0
|
||||
LINE_RECEIVER_PORT = 2013
|
||||
PICKLE_RECEIVER_INTERFACE = 0.0.0.0
|
||||
PICKLE_RECEIVER_PORT = 2014
|
||||
|
||||
# Set to false to disable logging of successful connections
|
||||
LOG_LISTENER_CONNECTIONS = True
|
||||
|
||||
# Carbon-relay has several options for metric routing controlled by RELAY_METHOD
|
||||
#
|
||||
# Use relay-rules.conf to route metrics to destinations based on pattern rules
|
||||
#RELAY_METHOD = rules
|
||||
#
|
||||
# Use consistent-hashing for even distribution of metrics between destinations
|
||||
#RELAY_METHOD = consistent-hashing
|
||||
#
|
||||
# Use consistent-hashing but take into account an aggregation-rules.conf shared
|
||||
# by downstream carbon-aggregator daemons. This will ensure that all metrics
|
||||
# that map to a given aggregation rule are sent to the same carbon-aggregator
|
||||
# instance.
|
||||
# Enable this for carbon-relays that send to a group of carbon-aggregators
|
||||
#RELAY_METHOD = aggregated-consistent-hashing
|
||||
RELAY_METHOD = rules
|
||||
|
||||
# If you use consistent-hashing you can add redundancy by replicating every
|
||||
# datapoint to more than one machine.
|
||||
REPLICATION_FACTOR = 1
|
||||
|
||||
# This is a list of carbon daemons we will send any relayed or
|
||||
# generated metrics to. The default provided would send to a single
|
||||
# carbon-cache instance on the default port. However if you
|
||||
# use multiple carbon-cache instances then it would look like this:
|
||||
#
|
||||
# DESTINATIONS = 127.0.0.1:2004:a, 127.0.0.1:2104:b
|
||||
#
|
||||
# The general form is IP:PORT:INSTANCE where the :INSTANCE part is
|
||||
# optional and refers to the "None" instance if omitted.
|
||||
#
|
||||
# Note that if the destinations are all carbon-caches then this should
|
||||
# exactly match the webapp's CARBONLINK_HOSTS setting in terms of
|
||||
# instances listed (order matters!).
|
||||
#
|
||||
# If using RELAY_METHOD = rules, all destinations used in relay-rules.conf
|
||||
# must be defined in this list
|
||||
DESTINATIONS = 127.0.0.1:2004
|
||||
|
||||
# This defines the maximum "message size" between carbon daemons.
|
||||
# You shouldn't need to tune this unless you really know what you're doing.
|
||||
MAX_DATAPOINTS_PER_MESSAGE = 500
|
||||
MAX_QUEUE_SIZE = 10000
|
||||
|
||||
# Set this to False to drop datapoints when any send queue (sending datapoints
|
||||
# to a downstream carbon daemon) hits MAX_QUEUE_SIZE. If this is True (the
|
||||
# default) then sockets over which metrics are received will temporarily stop accepting
|
||||
# data until the send queues fall below 80% MAX_QUEUE_SIZE.
|
||||
USE_FLOW_CONTROL = True
|
||||
|
||||
# Set this to True to enable whitelisting and blacklisting of metrics in
|
||||
# CONF_DIR/whitelist and CONF_DIR/blacklist. If the whitelist is missing or
|
||||
# empty, all metrics will pass through
|
||||
# USE_WHITELIST = False
|
||||
|
||||
# By default, carbon itself will log statistics (such as a count,
|
||||
# metricsReceived) with the top level prefix of 'carbon' at an interval of 60
|
||||
# seconds. Set CARBON_METRIC_INTERVAL to 0 to disable instrumentation
|
||||
# CARBON_METRIC_PREFIX = carbon
|
||||
# CARBON_METRIC_INTERVAL = 60
|
||||
|
||||
|
||||
[aggregator]
|
||||
LINE_RECEIVER_INTERFACE = 0.0.0.0
|
||||
LINE_RECEIVER_PORT = 2023
|
||||
|
||||
PICKLE_RECEIVER_INTERFACE = 0.0.0.0
|
||||
PICKLE_RECEIVER_PORT = 2024
|
||||
|
||||
# Set to false to disable logging of successful connections
|
||||
LOG_LISTENER_CONNECTIONS = True
|
||||
|
||||
# If set true, metric received will be forwarded to DESTINATIONS in addition to
|
||||
# the output of the aggregation rules. If set false the carbon-aggregator will
|
||||
# only ever send the output of aggregation.
|
||||
FORWARD_ALL = True
|
||||
|
||||
# This is a list of carbon daemons we will send any relayed or
|
||||
# generated metrics to. The default provided would send to a single
|
||||
# carbon-cache instance on the default port. However if you
|
||||
# use multiple carbon-cache instances then it would look like this:
|
||||
#
|
||||
# DESTINATIONS = 127.0.0.1:2004:a, 127.0.0.1:2104:b
|
||||
#
|
||||
# The format is comma-delimited IP:PORT:INSTANCE where the :INSTANCE part is
|
||||
# optional and refers to the "None" instance if omitted.
|
||||
#
|
||||
# Note that if the destinations are all carbon-caches then this should
|
||||
# exactly match the webapp's CARBONLINK_HOSTS setting in terms of
|
||||
# instances listed (order matters!).
|
||||
DESTINATIONS = 127.0.0.1:2004
|
||||
|
||||
# If you want to add redundancy to your data by replicating every
|
||||
# datapoint to more than one machine, increase this.
|
||||
REPLICATION_FACTOR = 1
|
||||
|
||||
# This is the maximum number of datapoints that can be queued up
|
||||
# for a single destination. Once this limit is hit, we will
|
||||
# stop accepting new data if USE_FLOW_CONTROL is True, otherwise
|
||||
# we will drop any subsequently received datapoints.
|
||||
MAX_QUEUE_SIZE = 10000
|
||||
|
||||
# Set this to False to drop datapoints when any send queue (sending datapoints
|
||||
# to a downstream carbon daemon) hits MAX_QUEUE_SIZE. If this is True (the
|
||||
# default) then sockets over which metrics are received will temporarily stop accepting
|
||||
# data until the send queues fall below 80% MAX_QUEUE_SIZE.
|
||||
USE_FLOW_CONTROL = True
|
||||
|
||||
# This defines the maximum "message size" between carbon daemons.
|
||||
# You shouldn't need to tune this unless you really know what you're doing.
|
||||
MAX_DATAPOINTS_PER_MESSAGE = 500
|
||||
|
||||
# This defines how many datapoints the aggregator remembers for
|
||||
# each metric. Aggregation only happens for datapoints that fall in
|
||||
# the past MAX_AGGREGATION_INTERVALS * intervalSize seconds.
|
||||
MAX_AGGREGATION_INTERVALS = 5
|
||||
|
||||
# By default (WRITE_BACK_FREQUENCY = 0), carbon-aggregator will write back
|
||||
# aggregated data points once every rule.frequency seconds, on a per-rule basis.
|
||||
# Set this (WRITE_BACK_FREQUENCY = N) to write back all aggregated data points
|
||||
# every N seconds, independent of rule frequency. This is useful, for example,
|
||||
# to be able to query partially aggregated metrics from carbon-cache without
|
||||
# having to first wait rule.frequency seconds.
|
||||
# WRITE_BACK_FREQUENCY = 0
|
||||
|
||||
# Set this to True to enable whitelisting and blacklisting of metrics in
|
||||
# CONF_DIR/whitelist and CONF_DIR/blacklist. If the whitelist is missing or
|
||||
# empty, all metrics will pass through
|
||||
# USE_WHITELIST = False
|
||||
|
||||
# By default, carbon itself will log statistics (such as a count,
|
||||
# metricsReceived) with the top level prefix of 'carbon' at an interval of 60
|
||||
# seconds. Set CARBON_METRIC_INTERVAL to 0 to disable instrumentation
|
||||
# CARBON_METRIC_PREFIX = carbon
|
||||
# CARBON_METRIC_INTERVAL = 60
|
||||
@@ -0,0 +1,57 @@
|
||||
# This configuration file controls the behavior of the Dashboard UI, available
|
||||
# at http://my-graphite-server/dashboard/.
|
||||
#
|
||||
# This file must contain a [ui] section that defines values for all of the
|
||||
# following settings.
|
||||
[ui]
|
||||
default_graph_width = 400
|
||||
default_graph_height = 250
|
||||
automatic_variants = true
|
||||
refresh_interval = 60
|
||||
autocomplete_delay = 375
|
||||
merge_hover_delay = 750
|
||||
|
||||
# You can set this 'default', 'white', or a custom theme name.
|
||||
# To create a custom theme, copy the dashboard-default.css file
|
||||
# to dashboard-myThemeName.css in the content/css directory and
|
||||
# modify it to your liking.
|
||||
theme = default
|
||||
|
||||
[keyboard-shortcuts]
|
||||
toggle_toolbar = ctrl-z
|
||||
toggle_metrics_panel = ctrl-space
|
||||
erase_all_graphs = alt-x
|
||||
save_dashboard = alt-s
|
||||
completer_add_metrics = alt-enter
|
||||
completer_del_metrics = alt-backspace
|
||||
give_completer_focus = shift-space
|
||||
|
||||
# These settings apply to the UI as a whole, all other sections in this file
|
||||
# pertain only to specific metric types.
|
||||
#
|
||||
# The dashboard presents only metrics that fall into specified naming schemes
|
||||
# defined in this file. This creates a simpler, more targetted view of the
|
||||
# data. The general form for defining a naming scheme is as follows:
|
||||
#
|
||||
#[Metric Type]
|
||||
#scheme = basis.path.<field1>.<field2>.<fieldN>
|
||||
#field1.label = Foo
|
||||
#field2.label = Bar
|
||||
#
|
||||
#
|
||||
# Where each <field> will be displayed as a dropdown box
|
||||
# in the UI and the remaining portion of the namespace
|
||||
# shown in the Metric Selector panel. The .label options set the labels
|
||||
# displayed for each dropdown.
|
||||
#
|
||||
# For example:
|
||||
#
|
||||
#[Sales]
|
||||
#scheme = sales.<channel>.<type>.<brand>
|
||||
#channel.label = Channel
|
||||
#type.label = Product Type
|
||||
#brand.label = Brand
|
||||
#
|
||||
# This defines a 'Sales' metric type that uses 3 dropdowns in the Context Selector
|
||||
# (the upper-left panel) while any deeper metrics (per-product counts or revenue, etc)
|
||||
# will be available in the Metric Selector (upper-right panel).
|
||||
@@ -0,0 +1,38 @@
|
||||
[default]
|
||||
background = black
|
||||
foreground = white
|
||||
majorLine = white
|
||||
minorLine = grey
|
||||
lineColors = blue,green,red,purple,brown,yellow,aqua,grey,magenta,pink,gold,rose
|
||||
fontName = Sans
|
||||
fontSize = 10
|
||||
fontBold = False
|
||||
fontItalic = False
|
||||
|
||||
[noc]
|
||||
background = black
|
||||
foreground = white
|
||||
majorLine = white
|
||||
minorLine = grey
|
||||
lineColors = blue,green,red,yellow,purple,brown,aqua,grey,magenta,pink,gold,rose
|
||||
fontName = Sans
|
||||
fontSize = 10
|
||||
fontBold = False
|
||||
fontItalic = False
|
||||
|
||||
[plain]
|
||||
background = white
|
||||
foreground = black
|
||||
minorLine = grey
|
||||
majorLine = rose
|
||||
|
||||
[summary]
|
||||
background = black
|
||||
lineColors = #6666ff, #66ff66, #ff6666
|
||||
|
||||
[alphas]
|
||||
background = white
|
||||
foreground = black
|
||||
majorLine = grey
|
||||
minorLine = rose
|
||||
lineColors = 00ff00aa,ff000077,00337799
|
||||
@@ -0,0 +1,21 @@
|
||||
# Relay destination rules for carbon-relay. Entries are scanned in order,
|
||||
# and the first pattern a metric matches will cause processing to cease after sending
|
||||
# unless `continue` is set to true
|
||||
#
|
||||
# [name]
|
||||
# pattern = <regex>
|
||||
# destinations = <list of destination addresses>
|
||||
# continue = <boolean> # default: False
|
||||
#
|
||||
# name: Arbitrary unique name to identify the rule
|
||||
# pattern: Regex pattern to match against the metric name
|
||||
# destinations: Comma-separated list of destinations.
|
||||
# ex: 127.0.0.1, 10.1.2.3:2004, 10.1.2.4:2004:a, myserver.mydomain.com
|
||||
# continue: Continue processing rules if this rule matches (default: False)
|
||||
|
||||
# You must have exactly one section with 'default = true'
|
||||
# Note that all destinations listed must also exist in carbon.conf
|
||||
# in the DESTINATIONS setting in the [relay] section
|
||||
[default]
|
||||
default = true
|
||||
destinations = 127.0.0.1:2004:a, 127.0.0.1:2104:b
|
||||
@@ -0,0 +1,18 @@
|
||||
# This file defines regular expression patterns that can be used to
|
||||
# rewrite metric names in a search & replace fashion. It consists of two
|
||||
# sections, [pre] and [post]. The rules in the pre section are applied to
|
||||
# metric names as soon as they are received. The post rules are applied
|
||||
# after aggregation has taken place.
|
||||
#
|
||||
# The general form of each rule is as follows:
|
||||
#
|
||||
# regex-pattern = replacement-text
|
||||
#
|
||||
# For example:
|
||||
#
|
||||
# [post]
|
||||
# _sum$ =
|
||||
# _avg$ =
|
||||
#
|
||||
# These rules would strip off a suffix of _sum or _avg from any metric names
|
||||
# after aggregation.
|
||||
@@ -0,0 +1,43 @@
|
||||
# Aggregation methods for whisper files. Entries are scanned in order,
|
||||
# and first match wins. This file is scanned for changes every 60 seconds
|
||||
#
|
||||
# [name]
|
||||
# pattern = <regex>
|
||||
# xFilesFactor = <float between 0 and 1>
|
||||
# aggregationMethod = <average|sum|last|max|min>
|
||||
#
|
||||
# name: Arbitrary unique name for the rule
|
||||
# pattern: Regex pattern to match against the metric name
|
||||
# xFilesFactor: Ratio of valid data points required for aggregation to the next retention to occur
|
||||
# aggregationMethod: function to apply to data points for aggregation
|
||||
#
|
||||
[min]
|
||||
pattern = \.lower$
|
||||
xFilesFactor = 0.1
|
||||
aggregationMethod = min
|
||||
|
||||
[max]
|
||||
pattern = \.upper(_\d+)?$
|
||||
xFilesFactor = 0.1
|
||||
aggregationMethod = max
|
||||
|
||||
[sum]
|
||||
pattern = \.sum$
|
||||
xFilesFactor = 0
|
||||
aggregationMethod = sum
|
||||
|
||||
[count]
|
||||
pattern = \.count$
|
||||
xFilesFactor = 0
|
||||
aggregationMethod = sum
|
||||
|
||||
[count_legacy]
|
||||
pattern = ^stats_counts.*
|
||||
xFilesFactor = 0
|
||||
aggregationMethod = sum
|
||||
|
||||
[default_average]
|
||||
pattern = .*
|
||||
xFilesFactor = 0.3
|
||||
aggregationMethod = average
|
||||
|
||||
@@ -0,0 +1,17 @@
|
||||
# Schema definitions for Whisper files. Entries are scanned in order,
|
||||
[carbon]
|
||||
pattern = ^carbon\..*
|
||||
retentions = 1m:31d,10m:1y,1h:5y
|
||||
|
||||
[highres]
|
||||
pattern = ^highres.*
|
||||
retentions = 1s:1d,1m:7d
|
||||
|
||||
[statsd]
|
||||
pattern = ^statsd.*
|
||||
retentions = 1m:7d,10m:1y
|
||||
|
||||
[default]
|
||||
pattern = .*
|
||||
retentions = 10s:1d,1m:7d,10m:1y
|
||||
|
||||
@@ -0,0 +1,6 @@
|
||||
# This file takes a single regular expression per line
|
||||
# If USE_WHITELIST is set to True in carbon.conf, only metrics received which
|
||||
# match one of these expressions will be persisted. If this file is empty or
|
||||
# missing, all metrics will pass through.
|
||||
# This file is reloaded automatically when changes are made
|
||||
.*
|
||||
@@ -0,0 +1,94 @@
|
||||
"""Copyright 2008 Orbitz WorldWide
|
||||
|
||||
Licensed under the Apache License, Version 2.0 (the "License");
|
||||
you may not use this file except in compliance with the License.
|
||||
You may obtain a copy of the License at
|
||||
|
||||
http://www.apache.org/licenses/LICENSE-2.0
|
||||
|
||||
Unless required by applicable law or agreed to in writing, software
|
||||
distributed under the License is distributed on an "AS IS" BASIS,
|
||||
WITHOUT WARRANTIES OR CONDITIONS OF ANY KIND, either express or implied.
|
||||
See the License for the specific language governing permissions and
|
||||
limitations under the License."""
|
||||
|
||||
# Django settings for graphite project.
|
||||
# DO NOT MODIFY THIS FILE DIRECTLY - use local_settings.py instead
|
||||
from os.path import dirname, join, abspath
|
||||
|
||||
|
||||
#Django settings below, do not touch!
|
||||
APPEND_SLASH = False
|
||||
TEMPLATE_DEBUG = False
|
||||
|
||||
TEMPLATES = [
|
||||
{
|
||||
'BACKEND': 'django.template.backends.django.DjangoTemplates',
|
||||
'DIRS': [
|
||||
join(dirname( abspath(__file__) ), 'templates')
|
||||
],
|
||||
'APP_DIRS': True,
|
||||
'OPTIONS': {
|
||||
'context_processors': [
|
||||
# Insert your TEMPLATE_CONTEXT_PROCESSORS here or use this
|
||||
# list if you haven't customized them:
|
||||
'django.contrib.auth.context_processors.auth',
|
||||
'django.template.context_processors.debug',
|
||||
'django.template.context_processors.i18n',
|
||||
'django.template.context_processors.media',
|
||||
'django.template.context_processors.static',
|
||||
'django.template.context_processors.tz',
|
||||
'django.contrib.messages.context_processors.messages',
|
||||
],
|
||||
},
|
||||
},
|
||||
]
|
||||
|
||||
# Language code for this installation. All choices can be found here:
|
||||
# http://www.w3.org/TR/REC-html40/struct/dirlang.html#langcodes
|
||||
# http://blogs.law.harvard.edu/tech/stories/storyReader$15
|
||||
LANGUAGE_CODE = 'en-us'
|
||||
|
||||
# Absolute path to the directory that holds media.
|
||||
MEDIA_ROOT = ''
|
||||
|
||||
# URL that handles the media served from MEDIA_ROOT.
|
||||
# Example: "http://media.lawrence.com"
|
||||
MEDIA_URL = ''
|
||||
|
||||
MIDDLEWARE_CLASSES = (
|
||||
'graphite.middleware.LogExceptionsMiddleware',
|
||||
'django.middleware.common.CommonMiddleware',
|
||||
'django.middleware.gzip.GZipMiddleware',
|
||||
'django.contrib.sessions.middleware.SessionMiddleware',
|
||||
'django.contrib.auth.middleware.AuthenticationMiddleware',
|
||||
'django.contrib.messages.middleware.MessageMiddleware',
|
||||
)
|
||||
|
||||
ROOT_URLCONF = 'graphite.urls'
|
||||
|
||||
INSTALLED_APPS = (
|
||||
'graphite.metrics',
|
||||
'graphite.render',
|
||||
'graphite.browser',
|
||||
'graphite.composer',
|
||||
'graphite.account',
|
||||
'graphite.dashboard',
|
||||
'graphite.whitelist',
|
||||
'graphite.events',
|
||||
'graphite.url_shortener',
|
||||
'django.contrib.auth',
|
||||
'django.contrib.sessions',
|
||||
'django.contrib.admin',
|
||||
'django.contrib.contenttypes',
|
||||
'django.contrib.staticfiles',
|
||||
'tagging',
|
||||
)
|
||||
|
||||
AUTHENTICATION_BACKENDS = ['django.contrib.auth.backends.ModelBackend']
|
||||
|
||||
GRAPHITE_WEB_APP_SETTINGS_LOADED = True
|
||||
|
||||
STATIC_URL = '/static/'
|
||||
|
||||
STATIC_ROOT = '/opt/graphite/static/'
|
||||
@@ -0,0 +1,215 @@
|
||||
## Graphite local_settings.py
|
||||
# Edit this file to customize the default Graphite webapp settings
|
||||
#
|
||||
# Additional customizations to Django settings can be added to this file as well
|
||||
|
||||
#####################################
|
||||
# General Configuration #
|
||||
#####################################
|
||||
# Set this to a long, random unique string to use as a secret key for this
|
||||
# install. This key is used for salting of hashes used in auth tokens,
|
||||
# CRSF middleware, cookie storage, etc. This should be set identically among
|
||||
# instances if used behind a load balancer.
|
||||
#SECRET_KEY = 'UNSAFE_DEFAULT'
|
||||
|
||||
# In Django 1.5+ set this to the list of hosts your graphite instances is
|
||||
# accessible as. See:
|
||||
# https://docs.djangoproject.com/en/dev/ref/settings/#std:setting-ALLOWED_HOSTS
|
||||
#ALLOWED_HOSTS = [ '*' ]
|
||||
|
||||
# Set your local timezone (Django's default is America/Chicago)
|
||||
# If your graphs appear to be offset by a couple hours then this probably
|
||||
# needs to be explicitly set to your local timezone.
|
||||
#TIME_ZONE = 'America/Los_Angeles'
|
||||
|
||||
# Override this to provide documentation specific to your Graphite deployment
|
||||
#DOCUMENTATION_URL = "http://graphite.readthedocs.org/"
|
||||
|
||||
# Logging
|
||||
#LOG_RENDERING_PERFORMANCE = True
|
||||
#LOG_CACHE_PERFORMANCE = True
|
||||
#LOG_METRIC_ACCESS = True
|
||||
|
||||
# Enable full debug page display on exceptions (Internal Server Error pages)
|
||||
#DEBUG = True
|
||||
|
||||
# If using RRD files and rrdcached, set to the address or socket of the daemon
|
||||
#FLUSHRRDCACHED = 'unix:/var/run/rrdcached.sock'
|
||||
|
||||
# This lists the memcached servers that will be used by this webapp.
|
||||
# If you have a cluster of webapps you should ensure all of them
|
||||
# have the *exact* same value for this setting. That will maximize cache
|
||||
# efficiency. Setting MEMCACHE_HOSTS to be empty will turn off use of
|
||||
# memcached entirely.
|
||||
#
|
||||
# You should not use the loopback address (127.0.0.1) here if using clustering
|
||||
# as every webapp in the cluster should use the exact same values to prevent
|
||||
# unneeded cache misses. Set to [] to disable caching of images and fetched data
|
||||
#MEMCACHE_HOSTS = ['10.10.10.10:11211', '10.10.10.11:11211', '10.10.10.12:11211']
|
||||
#DEFAULT_CACHE_DURATION = 60 # Cache images and data for 1 minute
|
||||
|
||||
|
||||
#####################################
|
||||
# Filesystem Paths #
|
||||
#####################################
|
||||
# Change only GRAPHITE_ROOT if your install is merely shifted from /opt/graphite
|
||||
# to somewhere else
|
||||
#GRAPHITE_ROOT = '/opt/graphite'
|
||||
|
||||
# Most installs done outside of a separate tree such as /opt/graphite will only
|
||||
# need to change these three settings. Note that the default settings for each
|
||||
# of these is relative to GRAPHITE_ROOT
|
||||
#CONF_DIR = '/opt/graphite/conf'
|
||||
#STORAGE_DIR = '/opt/graphite/storage'
|
||||
#CONTENT_DIR = '/opt/graphite/webapp/content'
|
||||
|
||||
# To further or fully customize the paths, modify the following. Note that the
|
||||
# default settings for each of these are relative to CONF_DIR and STORAGE_DIR
|
||||
#
|
||||
## Webapp config files
|
||||
#DASHBOARD_CONF = '/opt/graphite/conf/dashboard.conf'
|
||||
#GRAPHTEMPLATES_CONF = '/opt/graphite/conf/graphTemplates.conf'
|
||||
|
||||
## Data directories
|
||||
# NOTE: If any directory is unreadable in DATA_DIRS it will break metric browsing
|
||||
#WHISPER_DIR = '/opt/graphite/storage/whisper'
|
||||
#RRD_DIR = '/opt/graphite/storage/rrd'
|
||||
#DATA_DIRS = [WHISPER_DIR, RRD_DIR] # Default: set from the above variables
|
||||
#LOG_DIR = '/opt/graphite/storage/log/webapp'
|
||||
#INDEX_FILE = '/opt/graphite/storage/index' # Search index file
|
||||
|
||||
|
||||
#####################################
|
||||
# Email Configuration #
|
||||
#####################################
|
||||
# This is used for emailing rendered Graphs
|
||||
# Default backend is SMTP
|
||||
#EMAIL_BACKEND = 'django.core.mail.backends.smtp.EmailBackend'
|
||||
#EMAIL_HOST = 'localhost'
|
||||
#EMAIL_PORT = 25
|
||||
#EMAIL_HOST_USER = ''
|
||||
#EMAIL_HOST_PASSWORD = ''
|
||||
#EMAIL_USE_TLS = False
|
||||
# To drop emails on the floor, enable the Dummy backend:
|
||||
#EMAIL_BACKEND = 'django.core.mail.backends.dummy.EmailBackend'
|
||||
|
||||
|
||||
#####################################
|
||||
# Authentication Configuration #
|
||||
#####################################
|
||||
## LDAP / ActiveDirectory authentication setup
|
||||
#USE_LDAP_AUTH = True
|
||||
#LDAP_SERVER = "ldap.mycompany.com"
|
||||
#LDAP_PORT = 389
|
||||
# OR
|
||||
#LDAP_URI = "ldaps://ldap.mycompany.com:636"
|
||||
#LDAP_SEARCH_BASE = "OU=users,DC=mycompany,DC=com"
|
||||
#LDAP_BASE_USER = "CN=some_readonly_account,DC=mycompany,DC=com"
|
||||
#LDAP_BASE_PASS = "readonly_account_password"
|
||||
#LDAP_USER_QUERY = "(username=%s)" #For Active Directory use "(sAMAccountName=%s)"
|
||||
#
|
||||
# If you want to further customize the ldap connection options you should
|
||||
# directly use ldap.set_option to set the ldap module's global options.
|
||||
# For example:
|
||||
#
|
||||
#import ldap
|
||||
#ldap.set_option(ldap.OPT_X_TLS_REQUIRE_CERT, ldap.OPT_X_TLS_ALLOW)
|
||||
#ldap.set_option(ldap.OPT_X_TLS_CACERTDIR, "/etc/ssl/ca")
|
||||
#ldap.set_option(ldap.OPT_X_TLS_CERTFILE, "/etc/ssl/mycert.pem")
|
||||
#ldap.set_option(ldap.OPT_X_TLS_KEYFILE, "/etc/ssl/mykey.pem")
|
||||
# See http://www.python-ldap.org/ for further details on these options.
|
||||
|
||||
## REMOTE_USER authentication. See: https://docs.djangoproject.com/en/dev/howto/auth-remote-user/
|
||||
#USE_REMOTE_USER_AUTHENTICATION = True
|
||||
|
||||
# Override the URL for the login link (e.g. for django_openid_auth)
|
||||
#LOGIN_URL = '/account/login'
|
||||
|
||||
|
||||
##########################
|
||||
# Database Configuration #
|
||||
##########################
|
||||
# By default sqlite is used. If you cluster multiple webapps you will need
|
||||
# to setup an external database (such as MySQL) and configure all of the webapp
|
||||
# instances to use the same database. Note that this database is only used to store
|
||||
# Django models such as saved graphs, dashboards, user preferences, etc.
|
||||
# Metric data is not stored here.
|
||||
#
|
||||
# DO NOT FORGET TO RUN 'manage.py syncdb' AFTER SETTING UP A NEW DATABASE
|
||||
#
|
||||
# The following built-in database engines are available:
|
||||
# django.db.backends.postgresql # Removed in Django 1.4
|
||||
# django.db.backends.postgresql_psycopg2
|
||||
# django.db.backends.mysql
|
||||
# django.db.backends.sqlite3
|
||||
# django.db.backends.oracle
|
||||
#
|
||||
# The default is 'django.db.backends.sqlite3' with file 'graphite.db'
|
||||
# located in STORAGE_DIR
|
||||
#
|
||||
#DATABASES = {
|
||||
# 'default': {
|
||||
# 'NAME': '/opt/graphite/storage/graphite.db',
|
||||
# 'ENGINE': 'django.db.backends.sqlite3',
|
||||
# 'USER': '',
|
||||
# 'PASSWORD': '',
|
||||
# 'HOST': '',
|
||||
# 'PORT': ''
|
||||
# }
|
||||
#}
|
||||
#
|
||||
|
||||
|
||||
#########################
|
||||
# Cluster Configuration #
|
||||
#########################
|
||||
# (To avoid excessive DNS lookups you want to stick to using IP addresses only in this entire section)
|
||||
#
|
||||
# This should list the IP address (and optionally port) of the webapp on each
|
||||
# remote server in the cluster. These servers must each have local access to
|
||||
# metric data. Note that the first server to return a match for a query will be
|
||||
# used.
|
||||
#CLUSTER_SERVERS = ["10.0.2.2:80", "10.0.2.3:80"]
|
||||
|
||||
## These are timeout values (in seconds) for requests to remote webapps
|
||||
#REMOTE_STORE_FETCH_TIMEOUT = 6 # Timeout to fetch series data
|
||||
#REMOTE_STORE_FIND_TIMEOUT = 2.5 # Timeout for metric find requests
|
||||
#REMOTE_STORE_RETRY_DELAY = 60 # Time before retrying a failed remote webapp
|
||||
#REMOTE_FIND_CACHE_DURATION = 300 # Time to cache remote metric find results
|
||||
|
||||
## Remote rendering settings
|
||||
# Set to True to enable rendering of Graphs on a remote webapp
|
||||
#REMOTE_RENDERING = True
|
||||
# List of IP (and optionally port) of the webapp on each remote server that
|
||||
# will be used for rendering. Note that each rendering host should have local
|
||||
# access to metric data or should have CLUSTER_SERVERS configured
|
||||
#RENDERING_HOSTS = []
|
||||
#REMOTE_RENDER_CONNECT_TIMEOUT = 1.0
|
||||
|
||||
# If you are running multiple carbon-caches on this machine (typically behind a relay using
|
||||
# consistent hashing), you'll need to list the ip address, cache query port, and instance name of each carbon-cache
|
||||
# instance on the local machine (NOT every carbon-cache in the entire cluster). The default cache query port is 7002
|
||||
# and a common scheme is to use 7102 for instance b, 7202 for instance c, etc.
|
||||
#
|
||||
# You *should* use 127.0.0.1 here in most cases
|
||||
#CARBONLINK_HOSTS = ["127.0.0.1:7002:a", "127.0.0.1:7102:b", "127.0.0.1:7202:c"]
|
||||
#CARBONLINK_TIMEOUT = 1.0
|
||||
|
||||
#####################################
|
||||
# Additional Django Settings #
|
||||
#####################################
|
||||
# Uncomment the following line for direct access to Django settings such as
|
||||
# MIDDLEWARE_CLASSES or APPS
|
||||
#from graphite.app_settings import *
|
||||
|
||||
import os
|
||||
|
||||
LOG_DIR = '/var/log/graphite'
|
||||
SECRET_KEY = '$(date +%s | sha256sum | base64 | head -c 64)'
|
||||
|
||||
if (os.getenv("MEMCACHE_HOST") is not None):
|
||||
MEMCACHE_HOSTS = os.getenv("MEMCACHE_HOST").split(",")
|
||||
|
||||
if (os.getenv("DEFAULT_CACHE_DURATION") is not None):
|
||||
DEFAULT_CACHE_DURATION = int(os.getenv("CACHE_DURATION"))
|
||||
|
||||
6
docker/blocks/graphite1/conf/opt/statsd/config.js
Normal file
6
docker/blocks/graphite1/conf/opt/statsd/config.js
Normal file
@@ -0,0 +1,6 @@
|
||||
{
|
||||
"graphiteHost": "127.0.0.1",
|
||||
"graphitePort": 2003,
|
||||
"port": 8125,
|
||||
"flushInterval": 10000
|
||||
}
|
||||
26
docker/blocks/graphite1/conf/usr/local/bin/django_admin_init.exp
Executable file
26
docker/blocks/graphite1/conf/usr/local/bin/django_admin_init.exp
Executable file
@@ -0,0 +1,26 @@
|
||||
#!/usr/bin/env expect
|
||||
|
||||
set timeout -1
|
||||
spawn /usr/local/bin/manage.sh
|
||||
|
||||
expect "Would you like to create one now" {
|
||||
send "yes\r"
|
||||
}
|
||||
|
||||
expect "Username" {
|
||||
send "root\r"
|
||||
}
|
||||
|
||||
expect "Email address:" {
|
||||
send "root.graphite@mailinator.com\r"
|
||||
}
|
||||
|
||||
expect "Password:" {
|
||||
send "root\r"
|
||||
}
|
||||
|
||||
expect "Password *:" {
|
||||
send "root\r"
|
||||
}
|
||||
|
||||
expect "Superuser created successfully"
|
||||
3
docker/blocks/graphite1/conf/usr/local/bin/manage.sh
Normal file
3
docker/blocks/graphite1/conf/usr/local/bin/manage.sh
Normal file
@@ -0,0 +1,3 @@
|
||||
#!/bin/bash
|
||||
PYTHONPATH=/opt/graphite/webapp django-admin.py syncdb --settings=graphite.settings
|
||||
PYTHONPATH=/opt/graphite/webapp django-admin.py update_users --settings=graphite.settings
|
||||
16
docker/blocks/graphite1/fig
Normal file
16
docker/blocks/graphite1/fig
Normal file
@@ -0,0 +1,16 @@
|
||||
graphite:
|
||||
build: blocks/graphite1
|
||||
ports:
|
||||
- "8080:80"
|
||||
- "2003:2003"
|
||||
volumes:
|
||||
- /etc/localtime:/etc/localtime:ro
|
||||
- /etc/timezone:/etc/timezone:ro
|
||||
|
||||
fake-graphite-data:
|
||||
image: grafana/fake-data-gen
|
||||
net: bridge
|
||||
environment:
|
||||
FD_DATASOURCE: graphite
|
||||
FD_PORT: 2003
|
||||
|
||||
76
docker/blocks/graphite1/files/carbon.conf
Normal file
76
docker/blocks/graphite1/files/carbon.conf
Normal file
@@ -0,0 +1,76 @@
|
||||
[cache]
|
||||
LOCAL_DATA_DIR = /opt/graphite/storage/whisper/
|
||||
|
||||
# Specify the user to drop privileges to
|
||||
# If this is blank carbon runs as the user that invokes it
|
||||
# This user must have write access to the local data directory
|
||||
USER =
|
||||
|
||||
# Limit the size of the cache to avoid swapping or becoming CPU bound.
|
||||
# Sorts and serving cache queries gets more expensive as the cache grows.
|
||||
# Use the value "inf" (infinity) for an unlimited cache size.
|
||||
MAX_CACHE_SIZE = inf
|
||||
|
||||
# Limits the number of whisper update_many() calls per second, which effectively
|
||||
# means the number of write requests sent to the disk. This is intended to
|
||||
# prevent over-utilizing the disk and thus starving the rest of the system.
|
||||
# When the rate of required updates exceeds this, then carbon's caching will
|
||||
# take effect and increase the overall throughput accordingly.
|
||||
MAX_UPDATES_PER_SECOND = 1000
|
||||
|
||||
# Softly limits the number of whisper files that get created each minute.
|
||||
# Setting this value low (like at 50) is a good way to ensure your graphite
|
||||
# system will not be adversely impacted when a bunch of new metrics are
|
||||
# sent to it. The trade off is that it will take much longer for those metrics'
|
||||
# database files to all get created and thus longer until the data becomes usable.
|
||||
# Setting this value high (like "inf" for infinity) will cause graphite to create
|
||||
# the files quickly but at the risk of slowing I/O down considerably for a while.
|
||||
MAX_CREATES_PER_MINUTE = inf
|
||||
|
||||
LINE_RECEIVER_INTERFACE = 0.0.0.0
|
||||
LINE_RECEIVER_PORT = 2003
|
||||
|
||||
PICKLE_RECEIVER_INTERFACE = 0.0.0.0
|
||||
PICKLE_RECEIVER_PORT = 2004
|
||||
|
||||
CACHE_QUERY_INTERFACE = 0.0.0.0
|
||||
CACHE_QUERY_PORT = 7002
|
||||
|
||||
LOG_UPDATES = False
|
||||
|
||||
# Enable AMQP if you want to receve metrics using an amqp broker
|
||||
# ENABLE_AMQP = False
|
||||
|
||||
# Verbose means a line will be logged for every metric received
|
||||
# useful for testing
|
||||
# AMQP_VERBOSE = False
|
||||
|
||||
# AMQP_HOST = localhost
|
||||
# AMQP_PORT = 5672
|
||||
# AMQP_VHOST = /
|
||||
# AMQP_USER = guest
|
||||
# AMQP_PASSWORD = guest
|
||||
# AMQP_EXCHANGE = graphite
|
||||
|
||||
# Patterns for all of the metrics this machine will store. Read more at
|
||||
# http://en.wikipedia.org/wiki/Advanced_Message_Queuing_Protocol#Bindings
|
||||
#
|
||||
# Example: store all sales, linux servers, and utilization metrics
|
||||
# BIND_PATTERNS = sales.#, servers.linux.#, #.utilization
|
||||
#
|
||||
# Example: store everything
|
||||
# BIND_PATTERNS = #
|
||||
|
||||
# NOTE: you cannot run both a cache and a relay on the same server
|
||||
# with the default configuration, you have to specify a distinict
|
||||
# interfaces and ports for the listeners.
|
||||
|
||||
[relay]
|
||||
LINE_RECEIVER_INTERFACE = 0.0.0.0
|
||||
LINE_RECEIVER_PORT = 2003
|
||||
|
||||
PICKLE_RECEIVER_INTERFACE = 0.0.0.0
|
||||
PICKLE_RECEIVER_PORT = 2004
|
||||
|
||||
CACHE_SERVERS = server1, server2, server3
|
||||
MAX_QUEUE_SIZE = 10000
|
||||
102
docker/blocks/graphite1/files/events_views.py
Normal file
102
docker/blocks/graphite1/files/events_views.py
Normal file
@@ -0,0 +1,102 @@
|
||||
import datetime
|
||||
import time
|
||||
|
||||
from django.utils.timezone import get_current_timezone
|
||||
from django.core.urlresolvers import get_script_prefix
|
||||
from django.http import HttpResponse
|
||||
from django.shortcuts import render_to_response, get_object_or_404
|
||||
from pytz import timezone
|
||||
|
||||
from graphite.util import json
|
||||
from graphite.events import models
|
||||
from graphite.render.attime import parseATTime
|
||||
|
||||
|
||||
def to_timestamp(dt):
|
||||
return time.mktime(dt.timetuple())
|
||||
|
||||
|
||||
class EventEncoder(json.JSONEncoder):
|
||||
def default(self, obj):
|
||||
if isinstance(obj, datetime.datetime):
|
||||
return to_timestamp(obj)
|
||||
return json.JSONEncoder.default(self, obj)
|
||||
|
||||
|
||||
def view_events(request):
|
||||
if request.method == "GET":
|
||||
context = { 'events' : fetch(request),
|
||||
'slash' : get_script_prefix()
|
||||
}
|
||||
return render_to_response("events.html", context)
|
||||
else:
|
||||
return post_event(request)
|
||||
|
||||
def detail(request, event_id):
|
||||
e = get_object_or_404(models.Event, pk=event_id)
|
||||
context = { 'event' : e,
|
||||
'slash' : get_script_prefix()
|
||||
}
|
||||
return render_to_response("event.html", context)
|
||||
|
||||
|
||||
def post_event(request):
|
||||
if request.method == 'POST':
|
||||
event = json.loads(request.body)
|
||||
assert isinstance(event, dict)
|
||||
|
||||
values = {}
|
||||
values["what"] = event["what"]
|
||||
values["tags"] = event.get("tags", None)
|
||||
values["when"] = datetime.datetime.fromtimestamp(
|
||||
event.get("when", time.time()))
|
||||
if "data" in event:
|
||||
values["data"] = event["data"]
|
||||
|
||||
e = models.Event(**values)
|
||||
e.save()
|
||||
|
||||
return HttpResponse(status=200)
|
||||
else:
|
||||
return HttpResponse(status=405)
|
||||
|
||||
def get_data(request):
|
||||
if 'jsonp' in request.REQUEST:
|
||||
response = HttpResponse(
|
||||
"%s(%s)" % (request.REQUEST.get('jsonp'),
|
||||
json.dumps(fetch(request), cls=EventEncoder)),
|
||||
mimetype='text/javascript')
|
||||
else:
|
||||
response = HttpResponse(
|
||||
json.dumps(fetch(request), cls=EventEncoder),
|
||||
mimetype="application/json")
|
||||
return response
|
||||
|
||||
def fetch(request):
|
||||
#XXX we need to move to USE_TZ=True to get rid of naive-time conversions
|
||||
def make_naive(dt):
|
||||
if 'tz' in request.GET:
|
||||
tz = timezone(request.GET['tz'])
|
||||
else:
|
||||
tz = get_current_timezone()
|
||||
local_dt = dt.astimezone(tz)
|
||||
if hasattr(local_dt, 'normalize'):
|
||||
local_dt = local_dt.normalize()
|
||||
return local_dt.replace(tzinfo=None)
|
||||
|
||||
if request.GET.get("from", None) is not None:
|
||||
time_from = make_naive(parseATTime(request.GET["from"]))
|
||||
else:
|
||||
time_from = datetime.datetime.fromtimestamp(0)
|
||||
|
||||
if request.GET.get("until", None) is not None:
|
||||
time_until = make_naive(parseATTime(request.GET["until"]))
|
||||
else:
|
||||
time_until = datetime.datetime.now()
|
||||
|
||||
tags = request.GET.get("tags", None)
|
||||
if tags is not None:
|
||||
tags = request.GET.get("tags").split(" ")
|
||||
|
||||
return [x.as_dict() for x in
|
||||
models.Event.find_events(time_from, time_until, tags=tags)]
|
||||
20
docker/blocks/graphite1/files/initial_data.json
Normal file
20
docker/blocks/graphite1/files/initial_data.json
Normal file
@@ -0,0 +1,20 @@
|
||||
[
|
||||
{
|
||||
"pk": 1,
|
||||
"model": "auth.user",
|
||||
"fields": {
|
||||
"username": "admin",
|
||||
"first_name": "",
|
||||
"last_name": "",
|
||||
"is_active": true,
|
||||
"is_superuser": true,
|
||||
"is_staff": true,
|
||||
"last_login": "2011-09-20 17:02:14",
|
||||
"groups": [],
|
||||
"user_permissions": [],
|
||||
"password": "sha1$1b11b$edeb0a67a9622f1f2cfeabf9188a711f5ac7d236",
|
||||
"email": "root@example.com",
|
||||
"date_joined": "2011-09-20 17:02:14"
|
||||
}
|
||||
}
|
||||
]
|
||||
42
docker/blocks/graphite1/files/local_settings.py
Normal file
42
docker/blocks/graphite1/files/local_settings.py
Normal file
@@ -0,0 +1,42 @@
|
||||
# Edit this file to override the default graphite settings, do not edit settings.py
|
||||
|
||||
# Turn on debugging and restart apache if you ever see an "Internal Server Error" page
|
||||
#DEBUG = True
|
||||
|
||||
# Set your local timezone (django will try to figure this out automatically)
|
||||
TIME_ZONE = 'UTC'
|
||||
|
||||
# Setting MEMCACHE_HOSTS to be empty will turn off use of memcached entirely
|
||||
#MEMCACHE_HOSTS = ['127.0.0.1:11211']
|
||||
|
||||
# Sometimes you need to do a lot of rendering work but cannot share your storage mount
|
||||
#REMOTE_RENDERING = True
|
||||
#RENDERING_HOSTS = ['fastserver01','fastserver02']
|
||||
#LOG_RENDERING_PERFORMANCE = True
|
||||
#LOG_CACHE_PERFORMANCE = True
|
||||
|
||||
# If you've got more than one backend server they should all be listed here
|
||||
#CLUSTER_SERVERS = []
|
||||
|
||||
# Override this if you need to provide documentation specific to your graphite deployment
|
||||
#DOCUMENTATION_URL = "http://wiki.mycompany.com/graphite"
|
||||
|
||||
# Enable email-related features
|
||||
#SMTP_SERVER = "mail.mycompany.com"
|
||||
|
||||
# LDAP / ActiveDirectory authentication setup
|
||||
#USE_LDAP_AUTH = True
|
||||
#LDAP_SERVER = "ldap.mycompany.com"
|
||||
#LDAP_PORT = 389
|
||||
#LDAP_SEARCH_BASE = "OU=users,DC=mycompany,DC=com"
|
||||
#LDAP_BASE_USER = "CN=some_readonly_account,DC=mycompany,DC=com"
|
||||
#LDAP_BASE_PASS = "readonly_account_password"
|
||||
#LDAP_USER_QUERY = "(username=%s)" #For Active Directory use "(sAMAccountName=%s)"
|
||||
|
||||
# If sqlite won't cut it, configure your real database here (don't forget to run manage.py syncdb!)
|
||||
#DATABASE_ENGINE = 'mysql' # or 'postgres'
|
||||
#DATABASE_NAME = 'graphite'
|
||||
#DATABASE_USER = 'graphite'
|
||||
#DATABASE_PASSWORD = 'graphite-is-awesome'
|
||||
#DATABASE_HOST = 'mysql.mycompany.com'
|
||||
#DATABASE_PORT = '3306'
|
||||
1
docker/blocks/graphite1/files/my_htpasswd
Normal file
1
docker/blocks/graphite1/files/my_htpasswd
Normal file
@@ -0,0 +1 @@
|
||||
grafana:$apr1$4R/20xhC$8t37jPP5dbcLr48btdkU//
|
||||
70
docker/blocks/graphite1/files/nginx.conf
Normal file
70
docker/blocks/graphite1/files/nginx.conf
Normal file
@@ -0,0 +1,70 @@
|
||||
daemon off;
|
||||
user www-data;
|
||||
worker_processes 1;
|
||||
pid /var/run/nginx.pid;
|
||||
|
||||
events {
|
||||
worker_connections 1024;
|
||||
}
|
||||
|
||||
http {
|
||||
sendfile on;
|
||||
tcp_nopush on;
|
||||
tcp_nodelay on;
|
||||
keepalive_timeout 65;
|
||||
types_hash_max_size 2048;
|
||||
server_tokens off;
|
||||
|
||||
server_names_hash_bucket_size 32;
|
||||
|
||||
include /etc/nginx/mime.types;
|
||||
default_type application/octet-stream;
|
||||
|
||||
access_log /var/log/nginx/access.log;
|
||||
error_log /var/log/nginx/error.log;
|
||||
|
||||
gzip on;
|
||||
gzip_disable "msie6";
|
||||
|
||||
server {
|
||||
listen 80 default_server;
|
||||
server_name _;
|
||||
|
||||
open_log_file_cache max=1000 inactive=20s min_uses=2 valid=1m;
|
||||
|
||||
location / {
|
||||
proxy_pass http://127.0.0.1:8000;
|
||||
proxy_set_header X-Real-IP $remote_addr;
|
||||
proxy_set_header X-Forwarded-For $proxy_add_x_forwarded_for;
|
||||
proxy_set_header X-Forwarded-Proto $scheme;
|
||||
proxy_set_header X-Forwarded-Server $host;
|
||||
proxy_set_header X-Forwarded-Host $host;
|
||||
proxy_set_header Host $host;
|
||||
|
||||
client_max_body_size 10m;
|
||||
client_body_buffer_size 128k;
|
||||
|
||||
proxy_connect_timeout 90;
|
||||
proxy_send_timeout 90;
|
||||
proxy_read_timeout 90;
|
||||
|
||||
proxy_buffer_size 4k;
|
||||
proxy_buffers 4 32k;
|
||||
proxy_busy_buffers_size 64k;
|
||||
proxy_temp_file_write_size 64k;
|
||||
}
|
||||
|
||||
add_header Access-Control-Allow-Origin "*";
|
||||
add_header Access-Control-Allow-Methods "GET, OPTIONS";
|
||||
add_header Access-Control-Allow-Headers "origin, authorization, accept";
|
||||
|
||||
location /content {
|
||||
alias /opt/graphite/webapp/content;
|
||||
|
||||
}
|
||||
|
||||
location /media {
|
||||
alias /usr/share/pyshared/django/contrib/admin/media;
|
||||
}
|
||||
}
|
||||
}
|
||||
8
docker/blocks/graphite1/files/statsd_config.js
Normal file
8
docker/blocks/graphite1/files/statsd_config.js
Normal file
@@ -0,0 +1,8 @@
|
||||
{
|
||||
graphitePort: 2003,
|
||||
graphiteHost: "127.0.0.1",
|
||||
port: 8125,
|
||||
mgmt_port: 8126,
|
||||
backends: ['./backends/graphite'],
|
||||
debug: true
|
||||
}
|
||||
19
docker/blocks/graphite1/files/storage-aggregation.conf
Normal file
19
docker/blocks/graphite1/files/storage-aggregation.conf
Normal file
@@ -0,0 +1,19 @@
|
||||
[min]
|
||||
pattern = \.min$
|
||||
xFilesFactor = 0.1
|
||||
aggregationMethod = min
|
||||
|
||||
[max]
|
||||
pattern = \.max$
|
||||
xFilesFactor = 0.1
|
||||
aggregationMethod = max
|
||||
|
||||
[sum]
|
||||
pattern = \.count$
|
||||
xFilesFactor = 0
|
||||
aggregationMethod = sum
|
||||
|
||||
[default_average]
|
||||
pattern = .*
|
||||
xFilesFactor = 0.5
|
||||
aggregationMethod = average
|
||||
16
docker/blocks/graphite1/files/storage-schemas.conf
Normal file
16
docker/blocks/graphite1/files/storage-schemas.conf
Normal file
@@ -0,0 +1,16 @@
|
||||
[carbon]
|
||||
pattern = ^carbon\..*
|
||||
retentions = 1m:31d,10m:1y,1h:5y
|
||||
|
||||
[highres]
|
||||
pattern = ^highres.*
|
||||
retentions = 1s:1d,1m:7d
|
||||
|
||||
[statsd]
|
||||
pattern = ^statsd.*
|
||||
retentions = 1m:7d,10m:1y
|
||||
|
||||
[default]
|
||||
pattern = .*
|
||||
retentions = 10s:1d,1m:7d,10m:1y
|
||||
|
||||
26
docker/blocks/graphite1/files/supervisord.conf
Normal file
26
docker/blocks/graphite1/files/supervisord.conf
Normal file
@@ -0,0 +1,26 @@
|
||||
[supervisord]
|
||||
nodaemon = true
|
||||
environment = GRAPHITE_STORAGE_DIR='/opt/graphite/storage',GRAPHITE_CONF_DIR='/opt/graphite/conf'
|
||||
|
||||
[program:nginx]
|
||||
command = /usr/sbin/nginx
|
||||
stdout_logfile = /var/log/supervisor/%(program_name)s.log
|
||||
stderr_logfile = /var/log/supervisor/%(program_name)s.log
|
||||
autorestart = true
|
||||
|
||||
[program:carbon-cache]
|
||||
;user = www-data
|
||||
command = /opt/graphite/bin/carbon-cache.py --debug start
|
||||
stdout_logfile = /var/log/supervisor/%(program_name)s.log
|
||||
stderr_logfile = /var/log/supervisor/%(program_name)s.log
|
||||
autorestart = true
|
||||
|
||||
[program:graphite-webapp]
|
||||
;user = www-data
|
||||
directory = /opt/graphite/webapp
|
||||
environment = PYTHONPATH='/opt/graphite/webapp'
|
||||
command = /usr/bin/gunicorn_django -b127.0.0.1:8000 -w2 graphite/settings.py
|
||||
stdout_logfile = /var/log/supervisor/%(program_name)s.log
|
||||
stderr_logfile = /var/log/supervisor/%(program_name)s.log
|
||||
autorestart = true
|
||||
|
||||
@@ -7,3 +7,8 @@ mysql:
|
||||
MYSQL_PASSWORD: password
|
||||
ports:
|
||||
- "3306:3306"
|
||||
volumes:
|
||||
- /etc/localtime:/etc/localtime:ro
|
||||
- /etc/timezone:/etc/timezone:ro
|
||||
command: [mysqld, --character-set-server=utf8mb4, --collation-server=utf8mb4_unicode_ci, --innodb_monitor_enable=all]
|
||||
|
||||
|
||||
20
docker/blocks/mysql_opendata/Dockerfile
Normal file
20
docker/blocks/mysql_opendata/Dockerfile
Normal file
@@ -0,0 +1,20 @@
|
||||
## MySQL with Open Data Set from NYC Open Data (https://data.cityofnewyork.us)
|
||||
|
||||
FROM mysql:latest
|
||||
|
||||
ENV MYSQL_DATABASE="testdata" \
|
||||
MYSQL_ROOT_PASSWORD="rootpass" \
|
||||
MYSQL_USER="grafana" \
|
||||
MYSQL_PASSWORD="password"
|
||||
|
||||
# Install requirement (wget)
|
||||
RUN apt-get update && apt-get install -y wget && apt-get install unzip
|
||||
|
||||
# Fetch NYC Data Set
|
||||
RUN wget https://data.cityofnewyork.us/download/57g5-etyj/application%2Fzip -O /tmp/data.zip && \
|
||||
unzip -j /tmp/data.zip 311_Service_Requests_from_2015.csv -d /var/lib/mysql-files && \
|
||||
rm /tmp/data.zip
|
||||
|
||||
ADD import_csv.sql /docker-entrypoint-initdb.d/
|
||||
|
||||
EXPOSE 3306
|
||||
9
docker/blocks/mysql_opendata/fig
Normal file
9
docker/blocks/mysql_opendata/fig
Normal file
@@ -0,0 +1,9 @@
|
||||
mysql_opendata:
|
||||
build: blocks/mysql_opendata
|
||||
environment:
|
||||
MYSQL_ROOT_PASSWORD: rootpass
|
||||
MYSQL_DATABASE: testdata
|
||||
MYSQL_USER: grafana
|
||||
MYSQL_PASSWORD: password
|
||||
ports:
|
||||
- "3307:3306"
|
||||
80
docker/blocks/mysql_opendata/import_csv.sql
Normal file
80
docker/blocks/mysql_opendata/import_csv.sql
Normal file
@@ -0,0 +1,80 @@
|
||||
use testdata;
|
||||
DROP TABLE IF EXISTS `nyc_open_data`;
|
||||
CREATE TABLE IF NOT EXISTS `nyc_open_data` (
|
||||
UniqueKey bigint(255),
|
||||
`CreatedDate` varchar(255),
|
||||
`ClosedDate` varchar(255),
|
||||
Agency varchar(255),
|
||||
AgencyName varchar(255),
|
||||
ComplaintType varchar(255),
|
||||
Descriptor varchar(255),
|
||||
LocationType varchar(255),
|
||||
IncidentZip varchar(255),
|
||||
IncidentAddress varchar(255),
|
||||
StreetName varchar(255),
|
||||
CrossStreet1 varchar(255),
|
||||
CrossStreet2 varchar(255),
|
||||
IntersectionStreet1 varchar(255),
|
||||
IntersectionStreet2 varchar(255),
|
||||
AddressType varchar(255),
|
||||
City varchar(255),
|
||||
Landmark varchar(255),
|
||||
FacilityType varchar(255),
|
||||
Status varchar(255),
|
||||
`DueDate` varchar(255),
|
||||
ResolutionDescription varchar(2048),
|
||||
`ResolutionActionUpdatedDate` varchar(255),
|
||||
CommunityBoard varchar(255),
|
||||
Borough varchar(255),
|
||||
XCoordinateStatePlane varchar(255),
|
||||
YCoordinateStatePlane varchar(255),
|
||||
ParkFacilityName varchar(255),
|
||||
ParkBorough varchar(255),
|
||||
SchoolName varchar(255),
|
||||
SchoolNumber varchar(255),
|
||||
SchoolRegion varchar(255),
|
||||
SchoolCode varchar(255),
|
||||
SchoolPhoneNumber varchar(255),
|
||||
SchoolAddress varchar(255),
|
||||
SchoolCity varchar(255),
|
||||
SchoolState varchar(255),
|
||||
SchoolZip varchar(255),
|
||||
SchoolNotFound varchar(255),
|
||||
SchoolOrCitywideComplaint varchar(255),
|
||||
VehicleType varchar(255),
|
||||
TaxiCompanyBorough varchar(255),
|
||||
TaxiPickUpLocation varchar(255),
|
||||
BridgeHighwayName varchar(255),
|
||||
BridgeHighwayDirection varchar(255),
|
||||
RoadRamp varchar(255),
|
||||
BridgeHighwaySegment varchar(255),
|
||||
GarageLotName varchar(255),
|
||||
FerryDirection varchar(255),
|
||||
FerryTerminalName varchar(255),
|
||||
Latitude varchar(255),
|
||||
Longitude varchar(255),
|
||||
Location varchar(255)
|
||||
);
|
||||
LOAD DATA INFILE '/var/lib/mysql-files/311_Service_Requests_from_2015.csv' INTO TABLE nyc_open_data FIELDS OPTIONALLY ENCLOSED BY '"' TERMINATED BY ',' IGNORE 1 LINES;
|
||||
UPDATE nyc_open_data SET CreatedDate = STR_TO_DATE(CreatedDate, '%m/%d/%Y %r') WHERE CreatedDate <> '';
|
||||
UPDATE nyc_open_data SET ClosedDate = STR_TO_DATE(ClosedDate, '%m/%d/%Y %r') WHERE ClosedDate <> '';
|
||||
UPDATE nyc_open_data SET DueDate = STR_TO_DATE(DueDate, '%m/%d/%Y %r') WHERE DueDate <> '';
|
||||
UPDATE nyc_open_data SET ResolutionActionUpdatedDate = STR_TO_DATE(ResolutionActionUpdatedDate, '%m/%d/%Y %r') WHERE ResolutionActionUpdatedDate <> '';
|
||||
|
||||
UPDATE nyc_open_data SET CreatedDate=null WHERE CreatedDate = '';
|
||||
UPDATE nyc_open_data SET ClosedDate=null WHERE ClosedDate = '';
|
||||
UPDATE nyc_open_data SET DueDate=null WHERE DueDate = '';
|
||||
UPDATE nyc_open_data SET ResolutionActionUpdatedDate=null WHERE ResolutionActionUpdatedDate = '';
|
||||
|
||||
ALTER TABLE nyc_open_data modify CreatedDate datetime NULL;
|
||||
ALTER TABLE nyc_open_data modify ClosedDate datetime NULL;
|
||||
ALTER TABLE nyc_open_data modify DueDate datetime NULL;
|
||||
ALTER TABLE nyc_open_data modify ResolutionActionUpdatedDate datetime NULL;
|
||||
|
||||
ALTER TABLE `nyc_open_data` ADD INDEX `IX_ComplaintType` (`ComplaintType`);
|
||||
ALTER TABLE `nyc_open_data` ADD INDEX `IX_CreatedDate` (`CreatedDate`);
|
||||
ALTER TABLE `nyc_open_data` ADD INDEX `IX_LocationType` (`LocationType`);
|
||||
ALTER TABLE `nyc_open_data` ADD INDEX `IX_AgencyName` (`AgencyName`);
|
||||
ALTER TABLE `nyc_open_data` ADD INDEX `IX_City` (`City`);
|
||||
|
||||
SYSTEM rm /var/lib/mysql-files/311_Service_Requests_from_2015.csv
|
||||
@@ -6,3 +6,4 @@ postgrestest:
|
||||
POSTGRES_DATABASE: grafana
|
||||
ports:
|
||||
- "5432:5432"
|
||||
command: postgres -c log_connections=on -c logging_collector=on -c log_destination=stderr -c log_directory=/var/log/postgresql
|
||||
|
||||
@@ -3,8 +3,6 @@ prometheus:
|
||||
net: host
|
||||
ports:
|
||||
- "9090:9090"
|
||||
volumes:
|
||||
- /var/docker/prometheus:/prometheus-data
|
||||
|
||||
node_exporter:
|
||||
image: prom/node-exporter
|
||||
|
||||
@@ -1,4 +1,4 @@
|
||||
snmpd:
|
||||
build: blocks/snmpd
|
||||
image: namshi/smtp
|
||||
ports:
|
||||
- "161:161"
|
||||
- "25:25"
|
||||
|
||||
@@ -3,10 +3,11 @@ FROM grafana/docs-base:latest
|
||||
# to get the git info for this repo
|
||||
# COPY config.toml /site
|
||||
|
||||
RUN rm -rf /site/content/*
|
||||
# RUN rm -rf /site/content/*
|
||||
|
||||
COPY ./sources /site/content/
|
||||
# COPY ./sources /site/content/docs/
|
||||
|
||||
COPY config.toml /site
|
||||
COPY awsconfig /site
|
||||
|
||||
VOLUME ["/site/content"]
|
||||
|
||||
@@ -1,50 +1,34 @@
|
||||
.PHONY: all default docs docs-build docs-shell shell test
|
||||
# to allow `make DOCSDIR=1 docs-shell` (to create a bind mount in docs)
|
||||
DOCS_MOUNT := $(if $(DOCSDIR),-v $(CURDIR):/docs/content/grafana/)
|
||||
.PHONY: all default docs docs-build docs-shell shell checkvars
|
||||
|
||||
# to allow `make DOCSPORT=9000 docs`
|
||||
DOCSPORT := 3004
|
||||
|
||||
# Get the IP ADDRESS
|
||||
DOCKER_IP=$(shell python -c "import urlparse ; print urlparse.urlparse('$(DOCKER_HOST)').hostname or ''")
|
||||
HUGO_BASE_URL=$(shell test -z "$(DOCKER_IP)" && echo localhost || echo "$(DOCKER_IP)")
|
||||
HUGO_BIND_IP=0.0.0.0
|
||||
|
||||
GIT_BRANCH := $(shell git rev-parse --abbrev-ref HEAD 2>/dev/null)
|
||||
GIT_BRANCH_CLEAN := $(shell echo $(GIT_BRANCH) | sed -e "s/[^[:alnum:]]/-/g")
|
||||
DOCKER_DOCS_IMAGE := grafana/grafana-docs
|
||||
|
||||
DOCKER_RUN_DOCS := docker run --rm -it $(DOCS_MOUNT) -e AWS_S3_BUCKET -e NOCACHE
|
||||
SOURCES_HOST_DIR := "$(shell pwd)/sources"
|
||||
|
||||
# for some docs workarounds (see below in "docs-build" target)
|
||||
GITCOMMIT := $(shell git rev-parse --short HEAD 2>/dev/null)
|
||||
DOCS_MOUNT := -v $(SOURCES_HOST_DIR):/site/content
|
||||
|
||||
DOCKER_RUN_DOCS := docker run --rm -it $(DOCS_MOUNT) -e NOCACHE -p 3004:3004 -p 3005:3005
|
||||
|
||||
VERSION := $(shell head -n 1 VERSION)
|
||||
|
||||
default: docs
|
||||
|
||||
checkvars:
|
||||
ifndef ENV
|
||||
$(error ENV is undefined set via ENV=staging or ENV=prod as argument to make)
|
||||
endif
|
||||
|
||||
docs: docs-build
|
||||
$(DOCKER_RUN_DOCS) -p 3004:3004 -p 3005:3005 -e DOCKERHOST "$(DOCKER_DOCS_IMAGE)" /bin/bash -c "grunt && grunt connect --port=3004"
|
||||
$(DOCKER_RUN_DOCS) $(DOCS_MOUNT) -e DOCKERHOST "$(DOCKER_DOCS_IMAGE)" /bin/bash -c "grunt --env=dev-docs && grunt connect --port=3004"
|
||||
|
||||
docs-watch: docs-build
|
||||
$(DOCKER_RUN_DOCS) -p 3004:3004 -p 3005:3005 -v $(SOURCES_HOST_DIR):/site/content -e DOCKERHOST "$(DOCKER_DOCS_IMAGE)" /bin/bash -c "grunt --env=dev-docs && grunt connect --port=3004 & grunt watch --port=3004 --env=dev-docs"
|
||||
watch: docs-build
|
||||
$(DOCKER_RUN_DOCS) $(DOCS_MOUNT) -e DOCKERHOST "$(DOCKER_DOCS_IMAGE)" /bin/bash -c "grunt --env=dev-docs && grunt connect --port=3004 & grunt watch --port=3004 --env=dev-docs"
|
||||
|
||||
docs-watch-mac: docs-build
|
||||
$(DOCKER_RUN_DOCS) -p 3004:3004 -p 3005:3005 -v $(SOURCES_HOST_DIR):/site/content -e DOCKERHOST "$(DOCKER_DOCS_IMAGE)" /bin/bash -c "grunt --env=dev-docs-mac && grunt connect --port=3004 & grunt watch --port=3004 --env=dev-docs-mac"
|
||||
|
||||
publish: docs-build
|
||||
$(DOCKER_RUN_DOCS) "$(DOCKER_DOCS_IMAGE)" /bin/bash -c "./publish.sh staging-docs v3.1"
|
||||
|
||||
publish-prod: docs-build
|
||||
$(DOCKER_RUN_DOCS) "$(DOCKER_DOCS_IMAGE)" /bin/bash -c "./publish.sh prod-docs root"
|
||||
|
||||
docs-draft: docs-build
|
||||
$(DOCKER_RUN_DOCS) -p $(if $(DOCSPORT),$(DOCSPORT):)8000 -e DOCKERHOST "$(DOCKER_DOCS_IMAGE)" hugo server --buildDrafts="true" --port=$(DOCSPORT) --baseUrl=$(HUGO_BASE_URL) --bind=$(HUGO_BIND_IP)
|
||||
|
||||
docs-shell: docs-build
|
||||
$(DOCKER_RUN_DOCS) -p $(if $(DOCSPORT),$(DOCSPORT):)8000 "$(DOCKER_DOCS_IMAGE)" bash
|
||||
|
||||
test: docs-build
|
||||
$(DOCKER_RUN_DOCS) -p $(if $(DOCSPORT),$(DOCSPORT):)8000 "$(DOCKER_DOCS_IMAGE)"
|
||||
publish: checkvars docs-build
|
||||
$(info Publishing ENV=${ENV} and VERSION=${VERSION})
|
||||
$(DOCKER_RUN_DOCS) $(DOCS_MOUNT) -e DOCKERHOST "$(DOCKER_DOCS_IMAGE)" /bin/bash -c "./publish.sh ${ENV}-docs ${VERSION}"
|
||||
|
||||
docs-build:
|
||||
docker build -t "$(DOCKER_DOCS_IMAGE)" .
|
||||
docker build -t "$(DOCKER_DOCS_IMAGE)" --no-cache .
|
||||
|
||||
@@ -1,61 +1,72 @@
|
||||
# Building The Docs
|
||||
|
||||
To build the docs locally, you need to have docker installed. The
|
||||
docs are built using a custom [docker](https://www.docker.com/) image
|
||||
and the [mkdocs](http://www.mkdocs.org/) tool.
|
||||
docs are built using [Hugo](http://gohugo.io/) - a static site generator.
|
||||
|
||||
**Prepare the Docker Image**:
|
||||
|
||||
Build the `grafana/docs-base:latest` image. Run these commands in the
|
||||
same directory this file is in. **Note** that you may require ``sudo``
|
||||
Git clone `grafana/grafana.org` repo. Run these commands in the root of that repo. **Note** that you may require ``sudo``
|
||||
when running ``make docs-build`` depending on how your system's docker
|
||||
service is configured):
|
||||
|
||||
```
|
||||
$ git clone https://github.com/grafana/docs-base
|
||||
$ cd docs-base
|
||||
$ make docs-build
|
||||
git clone https://github.com/grafana/grafana.org
|
||||
cd grafana.org
|
||||
make docs-build
|
||||
```
|
||||
|
||||
**Build the Documentation**:
|
||||
|
||||
Now that the docker image has been prepared we can build the
|
||||
docs. Switch your working directory back to the directory this file
|
||||
(README.md) is in and run (possibly with ``sudo``):
|
||||
grafana docs and start a docs server.
|
||||
|
||||
If you have not cloned the Grafana repository already then:
|
||||
|
||||
```
|
||||
$ make docs
|
||||
cd ..
|
||||
git clone https://github.com/grafana/grafana
|
||||
```
|
||||
|
||||
Switch your working directory to the directory this file
|
||||
(README.md) is in.
|
||||
|
||||
```
|
||||
cd grafana/docs
|
||||
```
|
||||
|
||||
An AWS config file is required to build the docs Docker image and to publish the site to AWS. If you are building locally only and do not have any AWS credentials for docs.grafana.org then create an empty file named `awsconfig` in the current directory.
|
||||
|
||||
```
|
||||
touch awsconfig
|
||||
```
|
||||
|
||||
Then run (possibly with ``sudo``):
|
||||
|
||||
```
|
||||
make watch
|
||||
```
|
||||
|
||||
This command will not return control of the shell to the user. Instead
|
||||
the command is now running a new docker container built from the image
|
||||
we created in the previous step.
|
||||
|
||||
Open [localhost:8180](http://localhost:8180) to view the docs.
|
||||
Open [localhost:3004](http://localhost:3004) to view the docs.
|
||||
|
||||
**Note** that after running ``make docs`` you may notice a message
|
||||
like this in the console output
|
||||
### Images & Content
|
||||
|
||||
> Running at: http://0.0.0.0:8000/
|
||||
All markdown files are located in this repo (main grafana repo). But all images are added to the https://github.com/grafana/grafana.org repo. So the process of adding images is a bit complicated.
|
||||
|
||||
This is misleading. That is **not** the port the documentation is
|
||||
served from. You must browse to port **8180** to view the new
|
||||
documentation.
|
||||
First you need create a feature (PR) branch of https://github.com/grafana/grafana.org so you can make change. Then add the image to the `/static/img/docs` directory. Then make a commit that adds the image.
|
||||
|
||||
|
||||
# Adding a New Page
|
||||
|
||||
Adding a new page requires updating the ``mkdocs.yml`` file which is
|
||||
located in this directory.
|
||||
|
||||
For example, if you are adding documentation for a new HTTP API called
|
||||
``preferences`` you would:
|
||||
|
||||
1. Create the file ``docs/sources/http_api/preferences.md``
|
||||
1. Add a reference to it in ``docs/sources/http_api/overview.md``
|
||||
1. Update the list under the **pages** key in the ``docs/mkdocs.yml`` file with a reference to your new page:
|
||||
|
||||
|
||||
```yaml
|
||||
- ['http_api/preferences.md', 'API', 'Preferences API']
|
||||
Then run:
|
||||
```
|
||||
make docs-build
|
||||
```
|
||||
|
||||
This will rebuild the docs docker container.
|
||||
|
||||
To be able to use the image your have to quit (CTRL-C) the `make watch` command (that you run in the same directory as this README). Then simply rerun `make watch`, it will restart the docs server but now with access to your image.
|
||||
|
||||
### Editing content
|
||||
|
||||
Changes to the markdown files should automatically cause a docs rebuild and live reload should reload the page in your browser.
|
||||
|
||||
@@ -1 +1 @@
|
||||
3.1.0
|
||||
v4.3
|
||||
|
||||
@@ -1,70 +1,20 @@
|
||||
|
||||
baseurl = "http://localhost:3002/"
|
||||
languageCode = "en-us"
|
||||
title = "Grafana Docs"
|
||||
canonifyurls = false
|
||||
title = "Grafana Documentation"
|
||||
canonifyurls = true
|
||||
relativeURLs = false
|
||||
verbose = true
|
||||
enableRobotsTXT = true
|
||||
disableSitemap = false
|
||||
disableRSS = true
|
||||
|
||||
[[menu.top]]
|
||||
name = "Docs"
|
||||
url = ""
|
||||
weight = 1
|
||||
|
||||
[[menu.top]]
|
||||
name = "Community"
|
||||
url = "/community"
|
||||
weight = 2
|
||||
|
||||
[[menu.top]]
|
||||
name = "Support"
|
||||
url = "/support"
|
||||
weight = 3
|
||||
|
||||
[[menu.top]]
|
||||
name = "Plugins"
|
||||
url = "https://grafana.net/plugins"
|
||||
weight = 4
|
||||
|
||||
[[menu.top]]
|
||||
name = "Dashboards"
|
||||
url = "https://grafana.net/dashboards"
|
||||
weight = 5
|
||||
|
||||
[[menu.top]]
|
||||
name = "Hosting"
|
||||
url = "/hosting"
|
||||
weight = 6
|
||||
|
||||
[[menu.top]]
|
||||
name = "Github"
|
||||
url = "https://github.com/grafana/grafana"
|
||||
weight = 7
|
||||
|
||||
## Main
|
||||
[[menu.main]]
|
||||
name = "Feature Gallery"
|
||||
url = "/features"
|
||||
weight = 1
|
||||
|
||||
[[menu.main]]
|
||||
name = "Live Demo"
|
||||
url = "http://play.grafana.org"
|
||||
weight = 2
|
||||
|
||||
[[menu.main]]
|
||||
name = "Download"
|
||||
url = "/download"
|
||||
weight = 3
|
||||
|
||||
[[menu.main]]
|
||||
name = "Blog"
|
||||
url = "/blog"
|
||||
weight = 4
|
||||
|
||||
|
||||
disableRSS = false
|
||||
preservetaxonomynames = true
|
||||
metaDataFormat = "yaml"
|
||||
|
||||
[taxonomies]
|
||||
tag = "tags"
|
||||
category = "categories"
|
||||
|
||||
[permalinks]
|
||||
blog = ":year/:month/:day/:title/"
|
||||
|
||||
|
||||
3
docs/publish.sh
Executable file
3
docs/publish.sh
Executable file
@@ -0,0 +1,3 @@
|
||||
#!/bin/bash
|
||||
|
||||
make publish ENV=prod VERSION=root
|
||||
50
docs/sources/administration/cli.md
Normal file
50
docs/sources/administration/cli.md
Normal file
@@ -0,0 +1,50 @@
|
||||
+++
|
||||
title = "Grafana CLI"
|
||||
description = "Guide to using grafana-cli"
|
||||
keywords = ["grafana", "cli", "grafana-cli", "command line interface"]
|
||||
type = "docs"
|
||||
[menu.docs]
|
||||
parent = "admin"
|
||||
weight = 8
|
||||
+++
|
||||
|
||||
# Grafana CLI
|
||||
|
||||
Grafana cli is a small executable that is bundled with grafana server and is suppose to be executed on the same machine as grafana runs.
|
||||
|
||||
## Plugins
|
||||
|
||||
The CLI helps you install, upgrade and manage your plugins on the same machine it CLI is running.
|
||||
You can find more information about how to install and manage your plugins at the
|
||||
[plugin page]({{< relref "plugins/installation.md" >}}).
|
||||
|
||||
## Admin
|
||||
|
||||
> This feature is only available in grafana 4.1 and above.
|
||||
|
||||
To show all admin commands:
|
||||
`grafana-cli admin`
|
||||
|
||||
### Reset admin password
|
||||
|
||||
You can reset the password for the admin user using the CLI. The use case for this command is when you have lost the admin password.
|
||||
|
||||
`grafana-cli admin reset-admin-password ...`
|
||||
|
||||
If running the command returns this error:
|
||||
|
||||
> Could not find config defaults, make sure homepath command line parameter is set or working directory is homepath
|
||||
|
||||
then there are two flags that can be used to set homepath and the config file path.
|
||||
|
||||
`grafana-cli admin reset-admin-password --homepath "/usr/share/grafana" newpass`
|
||||
|
||||
If you have not lost the admin password then it is better to set in the Grafana UI. If you need to set the password in a script then the [Grafana API](http://docs.grafana.org/http_api/user/#change-password) can be used. Here is an example with curl using basic auth:
|
||||
|
||||
```
|
||||
curl -X PUT -H "Content-Type: application/json" -d '{
|
||||
"oldPassword": "admin",
|
||||
"newPassword": "newpass",
|
||||
"confirmNew": "newpass"
|
||||
}' http://admin:admin@<your_grafana_host>:3000/api/user/password
|
||||
```
|
||||
15
docs/sources/administration/metrics.md
Normal file
15
docs/sources/administration/metrics.md
Normal file
@@ -0,0 +1,15 @@
|
||||
+++
|
||||
title = "Internal metrics"
|
||||
description = "Internal metrics exposed by Grafana"
|
||||
keywords = ["grafana", "metrics", "internal metrics"]
|
||||
type = "docs"
|
||||
[menu.docs]
|
||||
parent = "admin"
|
||||
weight = 8
|
||||
+++
|
||||
|
||||
# Internal metrics
|
||||
|
||||
Grafana collects some metrics about it self internally. Currently Grafana supports pushing metrics to graphite and exposing them to be scraped by Prometheus.
|
||||
|
||||
To enabled internal metrics you have to enable it under the [metrics] section in your [grafana.ini](http://docs.grafana.org/installation/configuration/#enabled-6) config file.If you want to push metrics to graphite you have also have to configure the [metrics.graphite](http://docs.grafana.org/installation/configuration/#metrics-graphite) section.
|
||||
@@ -13,7 +13,7 @@ weight = 2
|
||||
|
||||
> Alerting is only available in Grafana v4.0 and above.
|
||||
|
||||
The alert engine publish some internal metrics about itself. You can read more about how Grafana published [interal metrics](/installation/configuration/#metrics)
|
||||
The alert engine publishes some internal metrics about itself. You can read more about how Grafana published [internal metrics](/installation/configuration/#metrics).
|
||||
|
||||
Description | Type | Metric name
|
||||
---------- | ----------- | ----------
|
||||
|
||||
@@ -12,18 +12,18 @@ weight = 2
|
||||
|
||||
# Alert Notifications
|
||||
|
||||
{{< imgbox max-width="40%" img="/img/docs/v4/alert_notifications_menu.png" caption="Alerting notifications" >}}
|
||||
|
||||
> Alerting is only available in Grafana v4.0 and above.
|
||||
|
||||
When an alert changes state it sends out notifications. Each alert rule can have
|
||||
multiple notifications. But in order to add a notification to an alert rule you first need
|
||||
to add and configure a `notification` object. This is done from the Alerting/Notifications page.
|
||||
to add and configure a `notification` channel (can be email, Pagerduty or other integration). This is done from the Notification Channels page.
|
||||
|
||||
## Notification Setup
|
||||
## Notification Channel Setup
|
||||
|
||||
On the notifications list page hit the `New Notification` button to go the the page where you
|
||||
can configure and setup a new notification.
|
||||
{{< imgbox max-width="40%" img="/img/docs/v43/alert_notifications_menu.png" caption="Alerting Notification Channels" >}}
|
||||
|
||||
On the Notification Channels page hit the `New Channel` button to go the page where you
|
||||
can configure and setup a new Notification Channel.
|
||||
|
||||
You specify name and type, and type specific options. You can also test the notification to make
|
||||
sure it's working and setup correctly.
|
||||
@@ -32,15 +32,15 @@ sure it's working and setup correctly.
|
||||
|
||||
When checked this option will make this notification used for all alert rules, existing and new.
|
||||
|
||||
## Supported notification types
|
||||
## Supported Notification Types
|
||||
|
||||
Grafana ships with a set of notification types. More will be added in future releases.
|
||||
Grafana ships with the following set of notification types:
|
||||
|
||||
### Email
|
||||
|
||||
To enable email notification you have to setup [SMTP settings](/installation/configuration/#smtp)
|
||||
in the Grafana config. Email notification will upload an image of the alert graph to an
|
||||
external image destination if available or fallback on attaching the image in the email.
|
||||
external image destination if available or fallback to attaching the image in the email.
|
||||
|
||||
### Slack
|
||||
|
||||
@@ -55,19 +55,29 @@ Setting | Description
|
||||
Recipient | allows you to override the slack recipient.
|
||||
Mention | make it possible to include a mention in the slack notification sent by Grafana. Ex @here or @channel
|
||||
|
||||
### PagerDuty
|
||||
|
||||
To set up PagerDuty, all you have to do is to provide an api key.
|
||||
|
||||
Setting | Description
|
||||
---------- | -----------
|
||||
Integration Key | Integration key for pagerduty.
|
||||
Auto resolve incidents | Resolve incidents in pagerduty once the alert goes back to ok
|
||||
|
||||
### Webhook
|
||||
|
||||
The webhook notification is a simple way to send information about an state change over HTTP to a custom endpoint.
|
||||
Using this notification you could integrated Grafana into any system you choose, by yourself.
|
||||
Using this notification you could integrate Grafana into any system you choose, by yourself.
|
||||
|
||||
Example json body:
|
||||
|
||||
```json
|
||||
{
|
||||
"title": "My alert",
|
||||
"ruleId": 1,
|
||||
"ruleName": "Load peaking!",
|
||||
"ruleUrl": "http://url.to.grafana/db/dashboard/my_dashboard?panelId=2",
|
||||
"state": "Alerting",
|
||||
"state": "alerting",
|
||||
"imageUrl": "http://s3.image.url",
|
||||
"message": "Load is peaking. Make sure the traffic is real and spin up more webfronts",
|
||||
"evalMatches": [
|
||||
@@ -80,25 +90,58 @@ Example json body:
|
||||
}
|
||||
```
|
||||
|
||||
### PagerDuty
|
||||
- **state** - The possible values for alert state are: `ok`, `paused`, `alerting`, `pending`, `no_data`.
|
||||
|
||||
To set up PagerDuty, all you have to do is to provide an api key.
|
||||
### DingDing/DingTalk
|
||||
|
||||
Setting | Description
|
||||
---------- | -----------
|
||||
Integration Key | Integration key for pagerduty.
|
||||
Auto resolve incidents | Resolve incidents in pagerduty once the alert goes back to ok
|
||||
[Instructions in Chinese](https://open-doc.dingtalk.com/docs/doc.htm?spm=a219a.7629140.0.0.p2lr6t&treeId=257&articleId=105733&docType=1).
|
||||
|
||||
In DingTalk PC Client:
|
||||
|
||||
1. Click "more" icon on left bottom of the panel.
|
||||
|
||||
2. Click "Robot Manage" item in the pop menu, there will be a new panel call "Robot Manage".
|
||||
|
||||
3. In the "Robot Manage" panel, select "customised: customised robot with Webhook".
|
||||
|
||||
4. In the next new panel named "robot detail", click "Add" button.
|
||||
|
||||
5. In "Add Robot" panel, input a nickname for the robot and select a "message group" which the robot will join in. click "next".
|
||||
|
||||
6. There will be a Webhook URL in the panel, looks like this: https://oapi.dingtalk.com/robot/send?access_token=xxxxxxxxx. Copy this URL to the grafana Dingtalk setting page and then click "finish".
|
||||
|
||||
Dingtalk supports the following "message type": `text`, `link` and `markdown`. Only the `text` message type is supported.
|
||||
|
||||
### Other Supported Notification Channels
|
||||
|
||||
Grafana also supports the following Notification Channels:
|
||||
|
||||
- HipChat
|
||||
|
||||
- VictorOps
|
||||
|
||||
- Sensu
|
||||
|
||||
- OpsGenie
|
||||
|
||||
- Threema
|
||||
|
||||
- Pushover
|
||||
|
||||
- Telegram
|
||||
|
||||
- LINE
|
||||
|
||||
# Enable images in notifications {#external-image-store}
|
||||
|
||||
Grafana can render the panel associated with the alert rule and include that in the notification. Some types
|
||||
of notifications require that this image be publicly accessable (Slack for example). In order to support
|
||||
images in notifications like Slack Grafana can upload the image to an image store. It currently supports
|
||||
Amazon S3 for this and Webdav. So to set that up you need to configure the
|
||||
[external image uploader](/installation/configuration/#external-image-storage) in your grafana-server ini
|
||||
config file.
|
||||
Grafana can render the panel associated with the alert rule and include that in the notification. Most Notification Channels require that this image be publicly accessible (Slack and PagerDuty for example). In order to include images in alert notifications, Grafana can upload the image to an image store. It currently supports
|
||||
Amazon S3 and Webdav for this. So to set that up you need to configure the [external image uploader](/installation/configuration/#external-image-storage) in your grafana-server ini config file.
|
||||
|
||||
This is an optional requirement, you can get slack and email notifications without setting this up.
|
||||
Currently only the Email Channels attaches images if no external image store is specified. To include images in alert notifications for other channels then you need to set up an external image store.
|
||||
|
||||
This is an optional requirement, you can get Slack and email notifications without setting this up.
|
||||
|
||||
# Configure the link back to Grafana from alert notifications
|
||||
|
||||
All alert notifications contains a link back to the triggered alert in the Grafana instance.
|
||||
This url is based on the [domain](/installation/configuration/#domain) setting in Grafana.
|
||||
|
||||
@@ -27,14 +27,12 @@ and the conditions that need to be met for the alert to change state and trigger
|
||||
## Execution
|
||||
|
||||
The alert rules are evaluated in the Grafana backend in a scheduler and query execution engine that is part
|
||||
of core Grafana. Only some data soures are supported right now. They include `Graphite`, `Prometheus`,
|
||||
of core Grafana. Only some data sources are supported right now. They include `Graphite`, `Prometheus`,
|
||||
`InfluxDB` and `OpenTSDB`.
|
||||
|
||||
### Clustering
|
||||
|
||||
We have not implemented clustering yet. So if you run multiple instances of grafana-server
|
||||
you have to make sure [execute_alerts]({{< relref "/installation/configuration.md#alerting" >}})
|
||||
is true on only one instance or otherwise you will get duplicated notifications.
|
||||
Currently alerting supports a limited form of high availability. Since v4.2.0 of Grafana, alert notifications are deduped when running multiple servers. This means all alerts are executed on every server but no duplicate alert notifications are sent due to the deduping logic. Proper load balancing of alerts will be introduced in the future.
|
||||
|
||||
<div class="clearfix"></div>
|
||||
|
||||
@@ -52,12 +50,22 @@ Here you can specify the name of the alert rule and how often the scheduler shou
|
||||
### Conditions
|
||||
|
||||
Currently the only condition type that exists is a `Query` condition that allows you to
|
||||
specify a query letter, time range and an aggregation function. The letter refers to
|
||||
a query you already have added in the **Metrics** tab. The result from the query and the aggregation function is
|
||||
a single value that is then used in the threshold check. The query used in an alert rule cannot
|
||||
contain any template variables. Currently we only support `AND` and `OR` operators between conditions and they are executed serially.
|
||||
specify a query letter, time range and an aggregation function.
|
||||
|
||||
|
||||
### Query condition example
|
||||
|
||||
```sql
|
||||
avg() OF query(A, 5m, now) IS BELOW 14
|
||||
```
|
||||
|
||||
- `avg()` Controls how the values for **each** series should be reduced to a value that can be compared against the threshold. Click on the function to change it to another aggregation function.
|
||||
- `query(A, 5m, now)` The letter defines what query to execute from the **Metrics** tab. The second two parameters define the time range, `5m, now` means 5 minutes from now to now. You can also do `10m, now-2m` to define a time range that will be 10 minutes from now to 2 minutes from now. This is useful if you want to ignore the last 2 minutes of data.
|
||||
- `IS BELOW 14` Defines the type of threshold and the threshold value. You can click on `IS BELOW` to change the type of threshold.
|
||||
|
||||
The query used in an alert rule cannot contain any template variables. Currently we only support `AND` and `OR` operators between conditions and they are executed serially.
|
||||
For example, we have 3 conditions in the following order:
|
||||
`condition:A(evaluates to: TRUE) OR condition:B(evaluates to: FALSE) AND condition:C(evaluates to: TRUE)`
|
||||
*condition:A(evaluates to: TRUE) OR condition:B(evaluates to: FALSE) AND condition:C(evaluates to: TRUE)*
|
||||
so the result will be calculated as ((TRUE OR FALSE) AND TRUE) = TRUE.
|
||||
|
||||
We plan to add other condition types in the future, like `Other Alert`, where you can include the state
|
||||
@@ -66,7 +74,7 @@ of another alert in your conditions, and `Time Of Day`.
|
||||
#### Multiple Series
|
||||
|
||||
If a query returns multiple series then the aggregation function and threshold check will be evaluated for each series.
|
||||
What Grafana does not do currently is track alert rule state **per series**. This has implications that is exemplified
|
||||
What Grafana does not do currently is track alert rule state **per series**. This has implications that are detailed
|
||||
in the scenario below.
|
||||
|
||||
- Alert condition with query that returns 2 series: **server1** and **server2**
|
||||
@@ -81,8 +89,7 @@ we plan to track state **per series** in a future release.
|
||||
|
||||
### No Data / Null values
|
||||
|
||||
Below you condition you can configure how the rule evaluation engine should handle queries that return no data or only null valued
|
||||
data.
|
||||
Below your conditions you can configure how the rule evaluation engine should handle queries that return no data or only null values.
|
||||
|
||||
No Data Option | Description
|
||||
------------ | -------------
|
||||
@@ -92,23 +99,23 @@ Keep Last State | Keep the current alert rule state, what ever it is.
|
||||
|
||||
### Execution errors or timeouts
|
||||
|
||||
The last option is how to handle execution or timeout errors.
|
||||
The last option tells how to handle execution or timeout errors.
|
||||
|
||||
Error or timeout option | Description
|
||||
------------ | -------------
|
||||
Alerting | Set alert rule state to `Alerting`
|
||||
Keep Last State | Keep the current alert rule state, what ever it is.
|
||||
|
||||
If you an unreliable time series store that where queries sometime timeout or fail randomly you can set this option
|
||||
t `Keep Last State` to basically ignore them.
|
||||
If you have an unreliable time series store from which queries sometime timeout or fail randomly you can set this option
|
||||
to `Keep Last State` in order to basically ignore them.
|
||||
|
||||
## Notifications
|
||||
|
||||
In alert tab you can also specify alert rule notifications along with a detailed messsage about the alert rule.
|
||||
The message can contain anything, information about how you might solve the issue, link to runbook etc.
|
||||
The message can contain anything, information about how you might solve the issue, link to runbook, etc.
|
||||
|
||||
The actual notifications are configured and shared between multiple alerts. Read the
|
||||
[Notifications]({{< relref "notifications.md" >}}) guide for how to configure and setup notifications.
|
||||
[notifications]({{< relref "notifications.md" >}}) guide for how to configure and setup notifications.
|
||||
|
||||
## Alert State History & Annotations
|
||||
|
||||
@@ -121,7 +128,7 @@ submenu in the alert tab to view & clear state history.
|
||||
{{< imgbox max-width="40%" img="/img/docs/v4/alert_test_rule.png" caption="Test Rule" >}}
|
||||
|
||||
First level of troubleshooting you can do is hit the **Test Rule** button. You will get result back that you can expand
|
||||
to the point where you can see the raw data that was returned form your query.
|
||||
to the point where you can see the raw data that was returned from your query.
|
||||
|
||||
Further troubleshooting can also be done by inspecting the grafana-server log. If it's not an error or for some reason
|
||||
the log does not say anything you can enable debug logging for some relevant components. This is done
|
||||
|
||||
@@ -12,10 +12,11 @@ weight = 200
|
||||
Here you can find links to older versions of the documentation that might be better suited for your version
|
||||
of Grafana.
|
||||
|
||||
- [Latest](/)
|
||||
- [Version 3.1](/v3.1)
|
||||
- [Version 3.0](/v3.0)
|
||||
- [Version 2.6](/v2.6)
|
||||
- [Version 2.5](/v2.5)
|
||||
- [Version 2.1](/v2.1)
|
||||
- [Version 2.0](/v2.0)
|
||||
- [Latest](http://docs.grafana.org)
|
||||
- [Version 4.4](http://docs.grafana.org/v4.4)
|
||||
- [Version 4.3](http://docs.grafana.org/v4.3)
|
||||
- [Version 4.2](http://docs.grafana.org/v4.2)
|
||||
- [Version 4.1](http://docs.grafana.org/v4.1)
|
||||
- [Version 4.0](http://docs.grafana.org/v4.0)
|
||||
- [Version 3.1](http://docs.grafana.org/v3.1)
|
||||
- [Version 3.0](http://docs.grafana.org/v3.0)
|
||||
|
||||
104
docs/sources/contribute/cla.md
Normal file
104
docs/sources/contribute/cla.md
Normal file
@@ -0,0 +1,104 @@
|
||||
+++
|
||||
title = "Contributor Licence Agreement (CLA)"
|
||||
description = "Contributer Licence Agreement (CLA)"
|
||||
type = "docs"
|
||||
aliases = ["/project/cla", "docs/contributing/cla.html"]
|
||||
[menu.docs]
|
||||
parent = "contribute"
|
||||
weight = 1
|
||||
+++
|
||||
|
||||
# Grafana Labs Contributor License Agreement
|
||||
|
||||
Thank you for your interest in contributing to Grafana Labs ("We" or "Us").
|
||||
|
||||
This contributor agreement ("Agreement") documents the rights granted by contributors to Us.
|
||||
To make this document effective, please sign it following the instructions at
|
||||
[cla-assistant](https://cla-assistant.io/grafana/grafana). This is a legally binding document,
|
||||
so please read it carefully before agreeing to it. The Agreement may cover more than
|
||||
one software project managed by Us.
|
||||
|
||||
## 1. Definitions
|
||||
|
||||
"You" (Individual) means the individual who Submits a Contribution to Us.
|
||||
|
||||
"You" (Entity) means any Legal Entity on behalf of whom a Contribution has been received by Us. "Legal Entity" means an entity which is not a natural person. "Affiliates" means other Legal Entities that control, are controlled by, or under common control with that Legal Entity. For the purposes of this definition, "control" means (i) the power, direct or indirect, to cause the direction or management of such Legal Entity, whether by contract or otherwise, (ii) ownership of fifty percent (50%) or more of the outstanding shares or securities which vote to elect the management or other persons who direct such Legal Entity or (iii) beneficial ownership of such entity.
|
||||
|
||||
"Contribution" means any work of authorship that is Submitted by You to Us in which You own or assert ownership of the Copyright. If You do not own the Copyright in the entire work of authorship, you must notify us at contact@grafana.com before Submitting such a Contribution.
|
||||
|
||||
"Copyright" means all rights protecting works of authorship owned or controlled by You [or Your Affiliates], including copyright, moral and neighboring rights, as appropriate, for the full term of their existence including any extensions by You.
|
||||
|
||||
"Material" means the work of authorship which is made available by Us to third parties. When this Agreement covers more than one software project, the Material means the work of authorship to which the Contribution was Submitted. After You Submit the Contribution, it may be included in the Material.
|
||||
|
||||
"Submit" means any form of electronic, verbal, or written communication sent to Us or our representatives, including but not limited to electronic mailing lists, source code control systems, and issue tracking systems that are managed by, or on behalf of, Us for the purpose of discussing and improving the Material, but excluding communication that is conspicuously marked or otherwise designated in writing by You as "Not a Contribution."
|
||||
|
||||
"Submission Date" means the date on which You Submit a Contribution to Us.
|
||||
|
||||
"Effective Date" means the date You execute this Agreement or the date You first Submit a Contribution to Us, whichever is earlier.
|
||||
|
||||
"Media" means any portion of a Contribution which is not software.
|
||||
|
||||
## 2. Grant of Rights
|
||||
|
||||
### 2.1 Copyright License
|
||||
|
||||
(a) You retain ownership of the Copyright in Your Contribution and have the same rights to use or license the Contribution which You would have had without entering into the Agreement.
|
||||
|
||||
(b) To the maximum extent permitted by the relevant law, You grant to Us a perpetual, worldwide, non-exclusive, transferable, royalty-free, irrevocable license under the Copyright covering the Contribution, with the right to sublicense such rights through multiple tiers of sublicensees, to reproduce, modify, display, perform and distribute the Contribution as part of the Material; provided that this license is conditioned upon compliance with Section 2.3.
|
||||
|
||||
### 2.2 Patent License
|
||||
|
||||
For patent claims including, without limitation, method, process, and apparatus claims which You [or Your Affiliates] own, control or have the right to grant, now or in the future, You grant to Us a perpetual, worldwide, non-exclusive, transferable, royalty-free, irrevocable patent license, with the right to sublicense these rights to multiple tiers of sublicensees, to make, have made, use, sell, offer for sale, import and otherwise transfer the Contribution and the Contribution in combination with the Material (and portions of such combination). This license is granted only to the extent that the exercise of the licensed rights infringes such patent claims; and provided that this license is conditioned upon compliance with Section 2.3.
|
||||
|
||||
### 2.3 Outbound License
|
||||
|
||||
As a condition on the grant of rights in Sections 2.1 and 2.2, We agree to license the Contribution only under the terms of the license or licenses which We are using on the Submission Date for the Material or any licenses which are approved by the Open Source Initiative on or after the Effective Date, including both permissive and copyleft licenses, whether or not such licenses are subsequently disapproved (including any right to adopt any future version of a license if permitted).
|
||||
|
||||
In addition, We may use the following licenses for Media in the Contribution: GNU Free Documentation License v1.3, Creative Commons Attribution 3.0, or Creative Commons Attribution No Derivatives 3.0 (including any right to adopt any future version of a license if permitted).
|
||||
|
||||
2.4 Moral Rights. If moral rights apply to the Contribution, to the maximum extent permitted by law, You waive and agree not to assert such moral rights against Us or our successors in interest, or any of our licensees, either direct or indirect.
|
||||
|
||||
2.5 Our Rights. You acknowledge that We are not obligated to use Your Contribution as part of the Material and may decide to include any Contribution We consider appropriate.
|
||||
|
||||
2.6 Reservation of Rights. Any rights not expressly [assigned or] licensed under this section are expressly reserved by You.
|
||||
|
||||
## 3. Agreement
|
||||
|
||||
You confirm that:
|
||||
|
||||
(a) You have the legal authority to enter into this Agreement.
|
||||
|
||||
(b) You [or Your Affiliates] own the Copyright and patent claims covering the Contribution which are required to grant the rights under Section 2.
|
||||
|
||||
\(c)(Individual) The grant of rights under Section 2 does not violate any grant of rights which You have made to third parties, including Your employer. If You are an employee, You have had Your employer approve this Agreement or sign the Entity version of this document. If You are less than eighteen years old, please have Your parents or guardian sign the Agreement.
|
||||
|
||||
\(c)(Entity) The grant of rights under Section 2 does not violate any grant of rights which You or Your Affiliates have made to third parties.
|
||||
|
||||
## 4. Disclaimer
|
||||
|
||||
EXCEPT FOR THE EXPRESS WARRANTIES IN SECTION 3, THE CONTRIBUTION IS PROVIDED "AS IS". MORE PARTICULARLY, ALL EXPRESS OR IMPLIED WARRANTIES INCLUDING, WITHOUT LIMITATION, ANY IMPLIED WARRANTY OF MERCHANTABILITY, FITNESS FOR A PARTICULAR PURPOSE AND NON-INFRINGEMENT ARE EXPRESSLY DISCLAIMED BY YOU TO US [AND BY US TO YOU]. TO THE EXTENT THAT ANY SUCH WARRANTIES CANNOT BE DISCLAIMED, SUCH WARRANTY IS LIMITED IN DURATION TO THE MINIMUM PERIOD PERMITTED BY LAW.
|
||||
|
||||
## 5. Consequential Damage Waiver
|
||||
|
||||
TO THE MAXIMUM EXTENT PERMITTED BY APPLICABLE LAW, IN NO EVENT WILL YOU [OR US] BE LIABLE FOR ANY LOSS OF PROFITS, LOSS OF ANTICIPATED SAVINGS, LOSS OF DATA, INDIRECT, SPECIAL, INCIDENTAL, CONSEQUENTIAL AND EXEMPLARY DAMAGES ARISING OUT OF THIS AGREEMENT REGARDLESS OF THE LEGAL OR EQUITABLE THEORY (CONTRACT, TORT OR OTHERWISE) UPON WHICH THE CLAIM IS BASED.
|
||||
|
||||
## 6. Miscellaneous
|
||||
|
||||
6.1 This Agreement will be governed by and construed in accordance with the laws of New York State, United States excluding its conflicts of law provisions. Under certain circumstances, the governing law in this section might be superseded by the United Nations Convention on Contracts for the International Sale of Goods ("UN Convention") and the parties intend to avoid the application of the UN Convention to this Agreement and, thus, exclude the application of the UN Convention in its entirety to this Agreement.
|
||||
|
||||
6.2 This Agreement sets out the entire agreement between You and Us for Your Contributions to Us and overrides all other agreements or understandings.
|
||||
|
||||
6.3 If You or We assign the rights or obligations received through this Agreement to a third party, as a condition of the assignment, that third party must agree in writing to abide by all the rights and obligations in the Agreement.
|
||||
|
||||
6.4 The failure of either party to require performance by the other party of any provision of this Agreement in one situation shall not affect the right of a party to require such performance at any time in the future. A waiver of performance under a provision in one situation shall not be considered a waiver of the performance of the provision in the future or a waiver of the provision in its entirety.
|
||||
|
||||
6.5 If any provision of this Agreement is found void and unenforceable, such provision will be replaced to the extent possible with a provision that comes closest to the meaning of the original provision and which is enforceable. The terms and conditions set forth in this Agreement shall apply notwithstanding any failure of essential purpose of this Agreement or any limited remedy to the maximum extent possible under law.
|
||||
|
||||
### Sign using CLA-Assistant
|
||||
|
||||
[https://cla-assistant.io/grafana/grafana](https://cla-assistant.io/grafana/grafana)
|
||||
|
||||
<br>
|
||||
<br>
|
||||
<br>
|
||||
This CLA aggreement is based on the [Harmony Contributor Aggrement Template (combined)](http://www.harmonyagreements.org/agreements.html), [Creative Commons Attribution 3.0 Unported License](https://creativecommons.org/licenses/by/3.0/)
|
||||
12
docs/sources/contribute/index.md
Normal file
12
docs/sources/contribute/index.md
Normal file
@@ -0,0 +1,12 @@
|
||||
+++
|
||||
title = "Contribute"
|
||||
description = "Contribute"
|
||||
type = "docs"
|
||||
[menu.docs]
|
||||
name = "Contribute"
|
||||
identifier = "contribute"
|
||||
weight = 20
|
||||
+++
|
||||
|
||||
### Contribute info
|
||||
|
||||
@@ -1,113 +0,0 @@
|
||||
+++
|
||||
title = "AWS CloudWatch"
|
||||
description = "Guide for using CloudWatch in Grafana"
|
||||
keywords = ["grafana", "cloudwatch", "guide"]
|
||||
type = "docs"
|
||||
[menu.docs]
|
||||
name = "AWS Cloudwatch"
|
||||
identifier = "cloudwatch"
|
||||
parent = "datasources"
|
||||
weight = 10
|
||||
+++
|
||||
|
||||
# Using AWS CloudWatch in Grafana
|
||||
|
||||
Grafana ships with built in support for CloudWatch. You just have to add it as a data source and you will
|
||||
be ready to build dashboards for you CloudWatch metrics.
|
||||
|
||||
## Adding the data source
|
||||

|
||||
|
||||
1. Open the side menu by clicking the the Grafana icon in the top header.
|
||||
2. In the side menu under the `Dashboards` link you should find a link named `Data Sources`.
|
||||
|
||||
> NOTE: If this link is missing in the side menu it means that your current user does not have the `Admin` role for the current organization.
|
||||
|
||||
3. Click the `Add new` link in the top header.
|
||||
4. Select `CloudWatch` from the dropdown.
|
||||
> NOTE: If at any moment you have issues with getting this datasource to work and grafana is giving you undescriptive errors then dont forget to check your log file (try looking in /var/log/grafana/).
|
||||
|
||||
Name | Description
|
||||
------------ | -------------
|
||||
Name | The data source name, important that this is the same as in Grafana v1.x if you plan to import old dashboards.
|
||||
Default | Default data source means that it will be pre-selected for new panels.
|
||||
Credentials profile name | Specify the name of the profile to use (if you use `~/aws/credentials` file), leave blank for default. This option was introduced in Grafana 2.5.1
|
||||
Default Region | Used in query editor to set region (can be changed on per query basis)
|
||||
Custom Metrics namespace | Specify the CloudWatch namespace of Custom metrics
|
||||
Assume Role Arn | Specify the ARN of the role to assume
|
||||
|
||||
## Authentication
|
||||
|
||||
### IAM Roles
|
||||
|
||||
Currently all access to CloudWatch is done server side by the Grafana backend using the official AWS SDK. If you grafana
|
||||
server is running on AWS you can use IAM Roles and authentication will be handled automatically.
|
||||
|
||||
Checkout AWS docs on [IAM Roles](http://docs.aws.amazon.com/AWSEC2/latest/UserGuide/iam-roles-for-amazon-ec2.html)
|
||||
|
||||
### AWS credentials file
|
||||
|
||||
Create a file at `~/.aws/credentials`. That is the `HOME` path for user running grafana-server.
|
||||
> NOTE: If you think you have the credentials file in the right place but it is still not working then you might try moving your .aws file to '/usr/share/grafana/' and make sure your credentials file has at most 0644 permissions.
|
||||
|
||||
Example content:
|
||||
|
||||
[default]
|
||||
aws_access_key_id = asdsadasdasdasd
|
||||
aws_secret_access_key = dasdasdsadasdasdasdsa
|
||||
region = us-west-2
|
||||
|
||||
|
||||
## Metric Query Editor
|
||||
|
||||

|
||||
|
||||
You need to specify a namespace, metric, at least one stat, and at least one dimension.
|
||||
|
||||
## Templated queries
|
||||
CloudWatch Datasource Plugin provides the following functions in `Variables values query` field in Templating Editor to query `region`, `namespaces`, `metric names` and `dimension keys/values` on the CloudWatch.
|
||||
|
||||
Name | Description
|
||||
------- | --------
|
||||
`regions()` | Returns a list of regions AWS provides their service.
|
||||
`namespaces()` | Returns a list of namespaces CloudWatch support.
|
||||
`metrics(namespace, [region])` | Returns a list of metrics in the namespace. (specify region for custom metrics)
|
||||
`dimension_keys(namespace)` | Returns a list of dimension keys in the namespace.
|
||||
`dimension_values(region, namespace, metric, dimension_key)` | Returns a list of dimension values matching the specified `region`, `namespace`, `metric` and `dimension_key`.
|
||||
`ebs_volume_ids(region, instance_id)` | Returns a list of volume id matching the specified `region`, `instance_id`.
|
||||
`ec2_instance_attribute(region, attribute_name, filters)` | Returns a list of attribute matching the specified `region`, `attribute_name`, `filters`.
|
||||
|
||||
For details about the metrics CloudWatch provides, please refer to the [CloudWatch documentation](https://docs.aws.amazon.com/AmazonCloudWatch/latest/DeveloperGuide/CW_Support_For_AWS.html).
|
||||
|
||||
## Example templated Queries
|
||||
|
||||
Example dimension queries which will return list of resources for individual AWS Services:
|
||||
|
||||
Service | Query
|
||||
------- | -----
|
||||
ELB | `dimension_values(us-east-1,AWS/ELB,RequestCount,LoadBalancerName)`
|
||||
ElastiCache | `dimension_values(us-east-1,AWS/ElastiCache,CPUUtilization,CacheClusterId)`
|
||||
RedShift | `dimension_values(us-east-1,AWS/Redshift,CPUUtilization,ClusterIdentifier)`
|
||||
RDS | `dimension_values(us-east-1,AWS/RDS,CPUUtilization,DBInstanceIdentifier)`
|
||||
S3 | `dimension_values(us-east-1,AWS/S3,BucketSizeBytes,BucketName)`
|
||||
|
||||
## ec2_instance_attribute JSON filters
|
||||
|
||||
The `ec2_instance_attribute` query take `filters` in JSON format.
|
||||
You can specify [pre-defined filters of ec2:DescribeInstances](http://docs.aws.amazon.com/AWSEC2/latest/APIReference/API_DescribeInstances.html).
|
||||
Specify like `{ filter_name1: [ filter_value1 ], filter_name2: [ filter_value2 ] }`
|
||||
|
||||
Example `ec2_instance_attribute()` query
|
||||
|
||||
ec2_instance_attribute(us-east-1, InstanceId, { "tag:Environment": [ "production" ] })
|
||||
|
||||

|
||||
|
||||
## Cost
|
||||
|
||||
Amazon provides 1 million CloudWatch API requests each month at no additional charge. Past this,
|
||||
it costs $0.01 per 1,000 GetMetricStatistics or ListMetrics requests. For each query Grafana will
|
||||
issue a GetMetricStatistics request and every time you pick a dimension in the query editor
|
||||
Grafana will issue a ListMetrics request.
|
||||
|
||||
|
||||
@@ -1,94 +0,0 @@
|
||||
+++
|
||||
title = "Using Elasticsearch in Grafana"
|
||||
description = "Guide for using Elasticsearch in Grafana"
|
||||
keywords = ["grafana", "elasticsearch", "guide"]
|
||||
type = "docs"
|
||||
[menu.docs]
|
||||
name = "Elasticsearch"
|
||||
parent = "datasources"
|
||||
weight = 3
|
||||
+++
|
||||
|
||||
# Using Elasticsearch in Grafana
|
||||
|
||||
Grafana ships with advanced support for Elasticsearch. You can do many types of
|
||||
simple or complex elasticsearch queries to visualize logs or metrics stored in elasticsearch. You can
|
||||
also annotate your graphs with log events stored in elasticsearch.
|
||||
|
||||
## Adding the data source
|
||||
|
||||

|
||||
|
||||
1. Open the side menu by clicking the the Grafana icon in the top header.
|
||||
2. In the side menu under the `Dashboards` link you should find a link named `Data Sources`.
|
||||
|
||||
> NOTE: If this link is missing in the side menu it means that your current user does not have the `Admin` role for the current organization.
|
||||
|
||||
3. Click the `Add new` link in the top header.
|
||||
4. Select `Elasticsearch` from the dropdown.
|
||||
|
||||
Name | Description
|
||||
------------ | -------------
|
||||
Name | The data source name, important that this is the same as in Grafana v1.x if you plan to import old dashboards.
|
||||
Default | Default data source means that it will be pre-selected for new panels.
|
||||
Url | The http protocol, ip and port of you elasticsearch server.
|
||||
Access | Proxy = access via Grafana backend, Direct = access directly from browser.
|
||||
|
||||
Proxy access means that the Grafana backend will proxy all requests from the browser, and send them on to the Data Source. This is useful because it can eliminate CORS (Cross Origin Site Resource) issues, as well as eliminate the need to disseminate authentication details to the Data Source to the browser.
|
||||
|
||||
Direct access is still supported because in some cases it may be useful to access a Data Source directly depending on the use case and topology of Grafana, the user, and the Data Source.
|
||||
|
||||
### Direct access
|
||||
If you select direct access you must update your Elasticsearch configuration to allow other domains to access
|
||||
Elasticsearch from the browser. You do this by specifying these to options in your **elasticsearch.yml** config file.
|
||||
|
||||
http.cors.enabled: true
|
||||
http.cors.allow-origin: "*"
|
||||
|
||||
### Index settings
|
||||
|
||||

|
||||
|
||||
Here you can specify a default for the `time field` and specify the name of your elasticsearch index. You can use
|
||||
a time pattern for the index name or a wildcard.
|
||||
|
||||
## Metric Query editor
|
||||
|
||||

|
||||
|
||||
The Elasticsearch query editor allows you to select multiple metrics and group by multiple terms or filters. Use the plus and minus icons to the right to add / remove
|
||||
metrics or group bys. Some metrics and group by have options, click the option text to expand the the row to view and edit metric or group by options.
|
||||
|
||||
## Pipeline metrics
|
||||
|
||||
If you have Elasticsearch 2.x and Grafana 2.6 or above then you can use pipeline metric aggregations like
|
||||
**Moving Average** and **Derivative**. Elasticsearch pipeline metrics require another metric to be based on. Use the eye icon next to the metric
|
||||
to hide metrics from appearing in the graph. This is useful for metrics you only have in the query to be used
|
||||
in a pipeline metric.
|
||||
|
||||

|
||||
|
||||
## Templating
|
||||
|
||||
The Elasticsearch datasource supports two types of queries you can use to fill template variables with values.
|
||||
|
||||
### Possible values for a field
|
||||
|
||||
```json
|
||||
{"find": "terms", "field": "@hostname"}
|
||||
```
|
||||
|
||||
### Fields filtered by type
|
||||
```json
|
||||
{"find": "fields", "type": "string"}
|
||||
```
|
||||
|
||||
### Fields filtered by type, with filter
|
||||
```json
|
||||
{"find": "fields", "type": "string", "query": <lucene query>}
|
||||
```
|
||||
|
||||
### Multi format / All format
|
||||
Use lucene format.
|
||||
|
||||
|
||||
@@ -1,87 +0,0 @@
|
||||
+++
|
||||
title = "Using Graphite in Grafana"
|
||||
description = "Guide for using graphite in Grafana"
|
||||
keywords = ["grafana", "graphite", "guide"]
|
||||
type = "docs"
|
||||
[menu.docs]
|
||||
name = "Graphite"
|
||||
identifier = "graphite"
|
||||
parent = "datasources"
|
||||
weight = 1
|
||||
+++
|
||||
|
||||
# Using Graphite in Grafana
|
||||
|
||||
Grafana has an advanced Graphite query editor that lets you quickly navigate the metric space, add functions,
|
||||
change function parameters and much more. The editor can handle all types of graphite queries. It can even handle complex nested
|
||||
queries through the use of query references.
|
||||
|
||||
## Adding the data source
|
||||

|
||||
|
||||
1. Open the side menu by clicking the the Grafana icon in the top header.
|
||||
2. In the side menu under the `Dashboards` link you should find a link named `Data Sources`.
|
||||
|
||||
> NOTE: If this link is missing in the side menu it means that your current user does not have the `Admin` role for the current organization.
|
||||
|
||||
3. Click the `Add new` link in the top header.
|
||||
4. Select `Graphite` from the dropdown.
|
||||
|
||||
Name | Description
|
||||
------------ | -------------
|
||||
Name | The data source name, important that this is the same as in Grafana v1.x if you plan to import old dashboards.
|
||||
Default | Default data source means that it will be pre-selected for new panels.
|
||||
Url | The http protocol, ip and port of your graphite-web or graphite-api install.
|
||||
Access | Proxy = access via Grafana backend, Direct = access directly from browser.
|
||||
|
||||
|
||||
Proxy access means that the Grafana backend will proxy all requests from the browser, and send them on to the Data Source. This is useful because it can eliminate CORS (Cross Origin Site Resource) issues, as well as eliminate the need to disseminate authentication details to the Data Source to the browser.
|
||||
|
||||
Direct access is still supported because in some cases it may be useful to access a Data Source directly depending on the use case and topology of Grafana, the user, and the Data Source.
|
||||
|
||||
|
||||
## Metric editor
|
||||
|
||||
### Navigate metric segments
|
||||
Click the ``Select metric`` link to start navigating the metric space. One you start you can continue using the mouse
|
||||
or keyboard arrow keys. You can select a wildcard and still continue.
|
||||
|
||||

|
||||
|
||||
### Functions
|
||||
Click the plus icon to the right to add a function. You can search for the function or select it from the menu. Once
|
||||
a function is selected it will be added and your focus will be in the text box of the first parameter. To later change
|
||||
a parameter just click on it and it will turn into a text box. To delete a function click the function name followed
|
||||
by the x icon.
|
||||
|
||||

|
||||
|
||||
|
||||
### Optional parameters
|
||||
Some functions like aliasByNode support an optional second argument. To add this parameter specify for example 3,-2 as the first parameter and the function editor will adapt and move the -2 to a second parameter. To remove the second optional parameter just click on it and leave it blank and the editor will remove it.
|
||||
|
||||

|
||||
|
||||
## Point consolidation
|
||||
|
||||
All Graphite metrics are consolidated so that Graphite doesn't return more data points than there are pixels in the graph. By default
|
||||
this consolidation is done using `avg` function. You can how Graphite consolidates metrics by adding the Graphite consolidateBy function.
|
||||
|
||||
> *Notice* This means that legend summary values (max, min, total) cannot be all correct at the same time. They are calculated
|
||||
> client side by Grafana. And depending on your consolidation function only one or two can be correct at the same time.
|
||||
|
||||
## Templating
|
||||
You can create a template variable in Grafana and have that variable filled with values from any Graphite metric exploration query.
|
||||
You can then use this variable in your Graphite queries, either as part of a metric path or as arguments to functions.
|
||||
|
||||
For example a query like `prod.servers.*` will fill the variable with all possible
|
||||
values that exists in the wildcard position.
|
||||
|
||||
You can also create nested variables that use other variables in their definition. For example
|
||||
`apps.$app.servers.*` uses the variable `$app` in its query definition.
|
||||
|
||||

|
||||
|
||||
|
||||
## Query Reference
|
||||
You can reference queries by the row “letter” that they’re on (similar to Microsoft Excel). If you add a second query to graph, you can reference the first query simply by typing in #A. This provides an easy and convenient way to build compounded queries.
|
||||
@@ -1,132 +0,0 @@
|
||||
+++
|
||||
title = "Using InfluxDB in Grafana"
|
||||
description = "Guide for using InfluxDB in Grafana"
|
||||
keywords = ["grafana", "influxdb", "guide"]
|
||||
type = "docs"
|
||||
[menu.docs]
|
||||
name = "InfluxDB"
|
||||
parent = "datasources"
|
||||
weight = 3
|
||||
+++
|
||||
|
||||
# Using InfluxDB in Grafana
|
||||
|
||||
Grafana ships with very feature rich data source plugin for InfluxDB. Supporting a feature rich query editor, annotation and templating queries.
|
||||
|
||||
## Adding the data source
|
||||

|
||||
|
||||
1. Open the side menu by clicking the the Grafana icon in the top header.
|
||||
2. In the side menu under the `Dashboards` link you should find a link named `Data Sources`.
|
||||
|
||||
> NOTE: If this link is missing in the side menu it means that your current user does not have the `Admin` role for the current organization.
|
||||
|
||||
3. Click the `Add new` link in the top header.
|
||||
4. Select `InfluxDB 0.9.x` or `InfluxDB 0.8.x` from the dropdown.
|
||||
|
||||
Name | Description
|
||||
------------ | -------------
|
||||
Name | The data source name, important that this is the same as in Grafana v1.x if you plan to import old dashboards.
|
||||
Default | Default data source means that it will be pre-selected for new panels.
|
||||
Url | The http protocol, ip and port of you influxdb api (influxdb api port is by default 8086)
|
||||
Access | Proxy = access via Grafana backend, Direct = access directly from browser.
|
||||
Database | Name of your influxdb database
|
||||
User | Name of your database user
|
||||
Password | Database user's password
|
||||
|
||||
> Proxy access means that the Grafana backend will proxy all requests from the browser, and send them on to the Data Source. This is useful because it can eliminate CORS (Cross Origin Site Resource) issues, as well as eliminate the need to disseminate authentication details to the Data Source to the browser.
|
||||
|
||||
> Direct access is still supported because in some cases it may be useful to access a Data Source directly depending on the use case and topology of Grafana, the user, and the Data Source.
|
||||
|
||||
|
||||
## Query Editor
|
||||
|
||||

|
||||
|
||||
You find the InfluxDB editor in the metrics tab in Graph or Singlestat panel's edit mode. You enter edit mode by clicking the
|
||||
panel title, then edit. The editor allows you to select metrics and tags.
|
||||
|
||||
### Filter data (WHERE)
|
||||
To add a tag filter click the plus icon to the right of the `WHERE` condition. You can remove tag filters by clicking on
|
||||
the tag key and select `--remove tag filter--`.
|
||||
|
||||
**Regex matching**
|
||||
|
||||
You can type in regex patterns for metric names or tag filter values, be sure to wrap the regex pattern in forward slashes (`/`). Grafana
|
||||
will automatically adjust the filter tag condition to use the InfluxDB regex match condition operator (`=~`).
|
||||
|
||||
### Field & Aggregation functions
|
||||
In the `SELECT` row you can specify what fields and functions you want to use. If you have a
|
||||
group by time you need an aggregation function. Some functions like derivative require an aggregation function.
|
||||
|
||||
The editor tries simplify and unify this part of the query. For example:
|
||||

|
||||
|
||||
The above will generate the following InfluxDB `SELECT` clause:
|
||||
|
||||
```sql
|
||||
SELECT derivative(mean("value"), 10s) /10 AS "REQ/s" FROM ....
|
||||
```
|
||||
|
||||
#### Select multiple fields
|
||||
Use the plus button and select Field > field to add another SELECT clause. You can also
|
||||
specify an asterix `*` to select all fields.
|
||||
|
||||
### Group By
|
||||
To group by a tag click the plus icon at the end of the GROUP BY row. Pick a tag from the dropdown that appears.
|
||||
You can remove the group by by clicking on the `tag` and then click on the x icon.
|
||||
|
||||
### Text Editor Mode (RAW)
|
||||
You can switch to raw query mode by clicking hamburger icon and then `Switch editor mode`.
|
||||
|
||||
> If you use Raw Query be sure your query at minimum have `WHERE $timeFilter`
|
||||
> Also please always have a group by time and an aggregation function, otherwise InfluxDB can easily return hundreds of thousands
|
||||
> of data points that will hang the browser.
|
||||
|
||||
### Alias patterns
|
||||
|
||||
- $m = replaced with measurement name
|
||||
- $measurement = replaced with measurement name
|
||||
- $col = replaced with column name
|
||||
- $tag_hostname = replaced with the value of the hostname tag
|
||||
- You can also use [[tag_hostname]] pattern replacement syntax
|
||||
|
||||
### Table query / raw data
|
||||
|
||||

|
||||
|
||||
You can remove the group by time by clicking on the `time` part and then the `x` icon. You can
|
||||
change the option `Format As` to `Table` if you want to show raw data in the `Table` panel.
|
||||
|
||||
|
||||
## Templating
|
||||
You can create a template variable in Grafana and have that variable filled with values from any InfluxDB metric exploration query.
|
||||
You can then use this variable in your InfluxDB metric queries.
|
||||
|
||||
For example you can have a variable that contains all values for tag `hostname` if you specify a query like this
|
||||
in the templating edit view.
|
||||
```sql
|
||||
SHOW TAG VALUES WITH KEY = "hostname"
|
||||
```
|
||||
|
||||
You can also create nested variables. For example if you had another variable, for example `region`. Then you could have
|
||||
the hosts variable only show hosts from the current selected region with a query like this:
|
||||
|
||||
```sql
|
||||
SHOW TAG VALUES WITH KEY = "hostname" WHERE region =~ /$region/
|
||||
```
|
||||
|
||||
> Always use `regex values` or `regex wildcard` for All format or multi select format.
|
||||
|
||||

|
||||
|
||||
## Annotations
|
||||
Annotations allows you to overlay rich event information on top of graphs.
|
||||
|
||||
An example query:
|
||||
|
||||
```SQL
|
||||
SELECT title, description from events WHERE $timeFilter order asc
|
||||
```
|
||||
|
||||
|
||||
@@ -1,52 +0,0 @@
|
||||
---
|
||||
page_title: KairosDB Guide
|
||||
page_description: KairosDB guide for Grafana
|
||||
page_keywords: grafana, kairosdb, documentation
|
||||
---
|
||||
|
||||
# KairosDB Guide
|
||||
Grafana v2.1 brings initial support for KairosDB Datasources. While the process of adding the datasource is similar to adding a Graphite or OpenTSDB datasource type, Kairos DB does have a few different options for building queries.
|
||||
|
||||
## Adding the data source to Grafana
|
||||

|
||||
|
||||
1. Open the side menu by clicking the the Grafana icon in the top header.
|
||||
2. In the side menu under the `Dashboards` link you should find a link named `Data Sources`.
|
||||
|
||||
> NOTE: If this link is missing in the side menu it means that your current user does not have the `Admin` role for the current organization.
|
||||
|
||||
3. Click the `Add new` link in the top header.
|
||||
4. Select `KairosDB` from the dropdown.
|
||||
|
||||
|
||||
|
||||
Name | Description
|
||||
------------ | -------------
|
||||
Name | The data source name, important that this is the same as in Grafana v1.x if you plan to import old dashboards.
|
||||
Default | Default data source means that it will be pre-selected for new panels.
|
||||
Url | The http protocol, ip and port of your kairosdb server (default port is usually 8080)
|
||||
Access | Proxy = access via Grafana backend, Direct = access directly from browser.
|
||||
|
||||
## Query editor
|
||||
Open a graph in edit mode by click the title.
|
||||
|
||||

|
||||
|
||||
For details on KairosDB metric queries checkout the official.
|
||||
- [Query Metrics - KairosDB 0.9.4 documentation](http://kairosdb.github.io/kairosdocs/restapi/QueryMetrics.html).
|
||||
|
||||
## Templated queries
|
||||
KairosDB Datasource Plugin provides following functions in `Variables values query` field in Templating Editor to query `metric names`, `tag names`, and `tag values` to kairosdb server.
|
||||
|
||||
Name | Description
|
||||
| ------- | --------|
|
||||
`metrics(query)` | Returns a list of metric names matching `query`. If nothing is given, returns a list of all metric names.
|
||||
`tag_names(query)` | Returns a list of tag names matching `query`. If nothing is given, returns a list of all tag names.
|
||||
`tag_values(metric,tag)` | Returns a list of values for `tag` from the given `metric`.
|
||||
|
||||
For details of `metric names`, `tag names`, and `tag values`, please refer to the KairosDB documentations.
|
||||
|
||||
- [List Metric Names - KairosDB 0.9.4 documentation](http://kairosdb.github.io/kairosdocs/restapi/ListMetricNames.html)
|
||||
- [List Tag Names - KairosDB 0.9.4 documentation](http://kairosdb.github.io/kairosdocs/restapi/ListTagNames.html)
|
||||
- [List Tag Values - KairosDB 0.9.4 documentation](http://kairosdb.github.io/kairosdocs/restapi/ListTagValues.html)
|
||||
- [Query Metrics - KairosDB 0.9.4 documentation](http://kairosdb.github.io/kairosdocs/restapi/QueryMetrics.html).
|
||||
@@ -1,69 +0,0 @@
|
||||
+++
|
||||
title = "Using OpenTSDB in Grafana"
|
||||
description = "Guide for using OpenTSDB in Grafana"
|
||||
keywords = ["grafana", "opentsdb", "guide"]
|
||||
type = "docs"
|
||||
[menu.docs]
|
||||
name = "OpenTSDB"
|
||||
parent = "datasources"
|
||||
weight = 5
|
||||
+++
|
||||
|
||||
# Using OpenTSDB in Grafana
|
||||
|
||||
{{< docs-imagebox img="/img/docs/v2/add_OpenTSDB.png" max-width="14rem" >}}
|
||||
|
||||
The newest release of Grafana adds additional functionality when using an OpenTSDB Data source.
|
||||
|
||||
1. Open the side menu by clicking the the Grafana icon in the top header.
|
||||
2. In the side menu under the `Dashboards` link you should find a link named `Data Sources`.
|
||||
|
||||
> NOTE: If this link is missing in the side menu it means that your current user does not have the `Admin` role for the current organization.
|
||||
|
||||
3. Click the `Add new` link in the top header.
|
||||
4. Select `OpenTSDB` from the dropdown.
|
||||
|
||||
Name | Description
|
||||
------------ | -------------
|
||||
Name | The data source name, important that this is the same as in Grafana v1.x if you plan to import old dashboards.
|
||||
Default | Default data source means that it will be pre-selected for new panels.
|
||||
Url | The http protocol, ip and port of you opentsdb server (default port is usually 4242)
|
||||
Access | Proxy = access via Grafana backend, Direct = access directly from browser.
|
||||
Version | Version = opentsdb version, either <=2.1 or 2.2
|
||||
Resolution | Metrics from opentsdb may have datapoints with either second or millisecond resolution.
|
||||
|
||||
## Query editor
|
||||
Open a graph in edit mode by click the title. Query editor will differ if the datasource has version <=2.1 or = 2.2. In the former version, only tags can be used to query opentsdb. But in the latter version, filters as well as tags can be used to query opentsdb. Fill Policy is also introduced in opentsdb 2.2.
|
||||
|
||||
> Note: While using Opentsdb 2.2 datasource, make sure you use either Filters or Tags as they are mutually exclusive. If used together, might give you weird results.
|
||||
|
||||

|
||||
|
||||
### Auto complete suggestions
|
||||
As soon as you start typing metric names, tag names and tag values , you should see highlighted auto complete suggestions for them.
|
||||
|
||||
> Note: This is required for the OpenTSDB `suggest` api to work.
|
||||
|
||||
## Templating queries
|
||||
Grafana's OpenTSDB data source now supports template variable values queries. This means you can create template variables that fetch the values from OpenTSDB (for example metric names, tag names, or tag values). The query editor is also enhanced to limiting tags by metric.
|
||||
|
||||
When using OpenTSDB with a template variable of `query` type you can use following syntax for lookup.
|
||||
|
||||
metrics(prefix) // returns metric names with specific prefix (can be empty)
|
||||
tag_names(cpu) // return tag names (i.e. keys) for a specific cpu metric
|
||||
tag_values(cpu, hostname) // return tag values for metric cpu and tag key hostname
|
||||
suggest_tagk(prefix) // return tag names (i.e. keys) for all metrics with specific prefix (can be empty)
|
||||
suggest_tagv(prefix) // return tag values for all metrics with specific prefix (can be empty)
|
||||
|
||||
If you do not see template variables being populated in `Preview of values` section, you need to enable `tsd.core.meta.enable_realtime_ts` in the OpenTSDB server settings. Also, to populate metadata of the existing time series data in OpenTSDB, you need to run `tsdb uid metasync` on the OpenTSDB server.
|
||||
|
||||
### Nested Templating
|
||||
|
||||
One template variable can be used to filter tag values for another template varible. Very importantly, the order of the parameters matter in tag_values function. First parameter is the metric name, second parameter is the tag key for which you need to find tag values, and after that all other dependent template variables. Some examples are mentioned below to make nested template queries work successfully.
|
||||
|
||||
tag_values(cpu, hostname, env=$env) // return tag values for cpu metric, selected env tag value and tag key hostname
|
||||
tag_values(cpu, hostanme, env=$env, region=$region) // return tag values for cpu metric, selected env tag value, selected region tag value and tag key hostname
|
||||
|
||||
> Note: This is required for the OpenTSDB `lookup` api to work.
|
||||
|
||||
For details on opentsdb metric queries checkout the official [OpenTSDB documentation](http://opentsdb.net/docs/build/html/index.html)
|
||||
@@ -1,34 +0,0 @@
|
||||
----
|
||||
page_title: Data source Plugin API
|
||||
page_description: Data Source Plugin Description
|
||||
page_keywords: grafana, data source, plugin, api, docs
|
||||
---
|
||||
|
||||
# Data source plugin API
|
||||
|
||||
All data sources in Grafana are implemented as plugins.
|
||||
|
||||
## Breaking change in 2.2
|
||||
|
||||
In Grafana 2.2 a breaking change was introduced for how data source query editors
|
||||
are structured, defined and loaded. This was in order to support mixing multiple data sources
|
||||
in the same panel.
|
||||
|
||||
In Grafana 2.2, the query editor is no longer defined using the partials section in
|
||||
`plugin.json`, but defined via an angular directive named using convention naming
|
||||
scheme like `metricQueryEditor<data source type name>`. For example
|
||||
|
||||
Graphite defines a directive like this:
|
||||
|
||||
```javascript
|
||||
module.directive('metricQueryEditorGraphite', function() {
|
||||
return {controller: 'GraphiteQueryCtrl', templateUrl: 'app/plugins/datasource/graphite/partials/query.editor.html'};
|
||||
});
|
||||
```
|
||||
|
||||
Even though the data source type name is with lowercase `g`, the directive uses capital `G` in `Graphite` because
|
||||
that is how angular directives needs to be named in order to match an element with name `<metric-query-editor-graphite />`.
|
||||
You also specify the query controller here instead of in the query.editor.html partial like before.
|
||||
|
||||
|
||||
|
||||
@@ -1,75 +0,0 @@
|
||||
+++
|
||||
title = "Using Prometheus in Grafana"
|
||||
description = "Guide for using Prometheus in Grafana"
|
||||
keywords = ["grafana", "prometheus", "guide"]
|
||||
type = "docs"
|
||||
[menu.docs]
|
||||
name = "Prometheus"
|
||||
parent = "datasources"
|
||||
weight = 2
|
||||
+++
|
||||
|
||||
|
||||
# Using Prometheus in Grafana
|
||||
|
||||
Grafana includes support for Prometheus Datasources. While the process of adding the datasource is similar to adding a Graphite or OpenTSDB datasource type, Prometheus does have a few different options for building queries.
|
||||
|
||||
## Adding the data source to Grafana
|
||||

|
||||
|
||||
1. Open the side menu by clicking the the Grafana icon in the top header.
|
||||
2. In the side menu under the `Dashboards` link you should find a link named `Data Sources`.
|
||||
|
||||
> NOTE: If this link is missing in the side menu it means that your current user does not have the `Admin` role for the current organization.
|
||||
|
||||
3. Click the `Add new` link in the top header.
|
||||
4. Select `Prometheus` from the dropdown.
|
||||
|
||||
Name | Description
|
||||
------------ | -------------
|
||||
Name | The data source name, important that this is the same as in Grafana v1.x if you plan to import old dashboards.
|
||||
Default | Default data source means that it will be pre-selected for new panels.
|
||||
Url | The http protocol, ip and port of you Prometheus server (default port is usually 9090)
|
||||
Access | Proxy = access via Grafana backend, Direct = access directly from browser.
|
||||
Basic Auth | Enable basic authentication to the Prometheus datasource.
|
||||
User | Name of your Prometheus user
|
||||
Password | Database user's password
|
||||
|
||||
> Proxy access means that the Grafana backend will proxy all requests from the browser, and send them on to the Data Source. This is useful because it can eliminate CORS (Cross Origin Site Resource) issues, as well as eliminate the need to disseminate authentication details to the Data Source to the browser.
|
||||
|
||||
> Direct access is still supported because in some cases it may be useful to access a Data Source directly depending on the use case and topology of Grafana, the user, and the Data Source.
|
||||
|
||||
## Query editor
|
||||
Open a graph in edit mode by click the title.
|
||||
|
||||

|
||||
|
||||
For details on Prometheus metric queries check out the Prometheus documentation
|
||||
- [Query Metrics - Prometheus documentation](http://prometheus.io/docs/querying/basics/).
|
||||
|
||||
## Templated queries
|
||||
Prometheus Datasource Plugin provides the following functions in `Variables values query` field in Templating Editor to query `metric names` and `labels names` on the Prometheus server.
|
||||
|
||||
Name | Description
|
||||
------- | --------
|
||||
`label_values(label)` | Returns a list of label values for the `label` in every metric.
|
||||
`label_values(metric, label)` | Returns a list of label values for the `label` in the specified metric.
|
||||
`metrics(metric)` | Returns a list of metrics matching the specified `metric` regex.
|
||||
`query_result(query)` | Returns a list of Prometheus query result for the `query`.
|
||||
|
||||
For details of `metric names` & `label names`, and `label values`, please refer to the [Prometheus documentation](http://prometheus.io/docs/concepts/data_model/#metric-names-and-labels).
|
||||
|
||||
> Note: The part of queries is incompatible with the version before 2.6, if you specify like `foo.*`, please change like `metrics(foo.*)`.
|
||||
|
||||
You can create a template variable in Grafana and have that variable filled with values from any Prometheus metric exploration query.
|
||||
You can then use this variable in your Prometheus metric queries.
|
||||
|
||||
For example you can have a variable that contains all values for label `hostname` if you specify a query like this
|
||||
in the templating edit view.
|
||||
```sql
|
||||
label_values(hostname)
|
||||
```
|
||||
|
||||
You can also use raw queries & regular expressions to extract anything you might need.
|
||||
|
||||

|
||||
168
docs/sources/features/datasources/cloudwatch.md
Normal file
168
docs/sources/features/datasources/cloudwatch.md
Normal file
@@ -0,0 +1,168 @@
|
||||
+++
|
||||
title = "AWS CloudWatch"
|
||||
description = "Guide for using CloudWatch in Grafana"
|
||||
keywords = ["grafana", "cloudwatch", "guide"]
|
||||
type = "docs"
|
||||
aliases = ["/datasources/cloudwatch"]
|
||||
[menu.docs]
|
||||
name = "AWS Cloudwatch"
|
||||
identifier = "cloudwatch"
|
||||
parent = "datasources"
|
||||
weight = 10
|
||||
+++
|
||||
|
||||
# Using AWS CloudWatch in Grafana
|
||||
|
||||
Grafana ships with built in support for CloudWatch. You just have to add it as a data source and you will be ready to build dashboards for you CloudWatch metrics.
|
||||
|
||||
## Adding the data source to Grafana
|
||||
|
||||
1. Open the side menu by clicking the Grafana icon in the top header.
|
||||
2. In the side menu under the `Dashboards` link you should find a link named `Data Sources`.
|
||||
3. Click the `+ Add data source` button in the top header.
|
||||
4. Select `Cloudwatch` from the *Type* dropdown.
|
||||
|
||||
> NOTE: If at any moment you have issues with getting this datasource to work and Grafana is giving you undescriptive errors then don't
|
||||
forget to check your log file (try looking in /var/log/grafana/grafana.log).
|
||||
|
||||
Name | Description
|
||||
------------ | -------------
|
||||
*Name* | The data source name. This is how you refer to the data source in panels & queries.
|
||||
*Default* | Default data source means that it will be pre-selected for new panels.
|
||||
*Credentials* profile name | Specify the name of the profile to use (if you use `~/aws/credentials` file), leave blank for default.
|
||||
*Default Region* | Used in query editor to set region (can be changed on per query basis)
|
||||
*Custom Metrics namespace* | Specify the CloudWatch namespace of Custom metrics
|
||||
*Assume Role Arn* | Specify the ARN of the role to assume
|
||||
|
||||
## Authentication
|
||||
|
||||
### IAM Roles
|
||||
|
||||
Currently all access to CloudWatch is done server side by the Grafana backend using the official AWS SDK. If you grafana
|
||||
server is running on AWS you can use IAM Roles and authentication will be handled automatically.
|
||||
|
||||
Checkout AWS docs on [IAM Roles](http://docs.aws.amazon.com/AWSEC2/latest/UserGuide/iam-roles-for-amazon-ec2.html)
|
||||
|
||||
### AWS credentials file
|
||||
|
||||
Create a file at `~/.aws/credentials`. That is the `HOME` path for user running grafana-server.
|
||||
> NOTE: If you think you have the credentials file in the right place but it is still not working then you might try moving your .aws file to '/usr/share/grafana/' and make sure your credentials file has at most 0644 permissions.
|
||||
|
||||
Example content:
|
||||
|
||||
[default]
|
||||
aws_access_key_id = asdsadasdasdasd
|
||||
aws_secret_access_key = dasdasdsadasdasdasdsa
|
||||
region = us-west-2
|
||||
|
||||
|
||||
## Metric Query Editor
|
||||
|
||||

|
||||
|
||||
You need to specify a namespace, metric, at least one stat, and at least one dimension.
|
||||
|
||||
## Templated queries
|
||||
|
||||
Instead of hard-coding things like server, application and sensor name in you metric queries you can use variables in their place.
|
||||
Variables are shown as dropdown select boxes at the top of the dashboard. These dropdowns makes it easy to change the data
|
||||
being displayed in your dashboard.
|
||||
|
||||
Checkout the [Templating]({{< relref "reference/templating.md" >}}) documentation for an introduction to the templating feature and the different
|
||||
types of template variables.
|
||||
|
||||
### Query variable
|
||||
|
||||
CloudWatch Datasource Plugin provides the following queries you can specify in the `Query` field in the Variable
|
||||
edit view. They allow you to fill a variable's options list with things like `region`, `namespaces`, `metric names`
|
||||
and `dimension keys/values`.
|
||||
|
||||
Name | Description
|
||||
------- | --------
|
||||
*regions()* | Returns a list of regions AWS provides their service.
|
||||
*namespaces()* | Returns a list of namespaces CloudWatch support.
|
||||
*metrics(namespace, [region])* | Returns a list of metrics in the namespace. (specify region for custom metrics)
|
||||
*dimension_keys(namespace)* | Returns a list of dimension keys in the namespace.
|
||||
*dimension_values(region, namespace, metric, dimension_key)* | Returns a list of dimension values matching the specified `region`, `namespace`, `metric` and `dimension_key`.
|
||||
*ebs_volume_ids(region, instance_id)* | Returns a list of volume ids matching the specified `region`, `instance_id`.
|
||||
*ec2_instance_attribute(region, attribute_name, filters)* | Returns a list of attributes matching the specified `region`, `attribute_name`, `filters`.
|
||||
|
||||
For details about the metrics CloudWatch provides, please refer to the [CloudWatch documentation](https://docs.aws.amazon.com/AmazonCloudWatch/latest/DeveloperGuide/CW_Support_For_AWS.html).
|
||||
|
||||
#### Examples templated Queries
|
||||
|
||||
Example dimension queries which will return list of resources for individual AWS Services:
|
||||
|
||||
Query | Service
|
||||
------- | -----
|
||||
*dimension_values(us-east-1,AWS/ELB,RequestCount,LoadBalancerName)* | ELB
|
||||
*dimension_values(us-east-1,AWS/ElastiCache,CPUUtilization,CacheClusterId)* | ElastiCache
|
||||
*dimension_values(us-east-1,AWS/Redshift,CPUUtilization,ClusterIdentifier)* | RedShift
|
||||
*dimension_values(us-east-1,AWS/RDS,CPUUtilization,DBInstanceIdentifier)* | RDS
|
||||
*dimension_values(us-east-1,AWS/S3,BucketSizeBytes,BucketName)* | S3
|
||||
|
||||
## ec2_instance_attribute examples
|
||||
|
||||
### JSON filters
|
||||
|
||||
The `ec2_instance_attribute` query takes `filters` in JSON format.
|
||||
You can specify [pre-defined filters of ec2:DescribeInstances](http://docs.aws.amazon.com/AWSEC2/latest/APIReference/API_DescribeInstances.html).
|
||||
Note that the actual filtering takes place on Amazon's servers, not in Grafana.
|
||||
|
||||
Filters syntax:
|
||||
|
||||
```javascript
|
||||
{ filter_name1: [ filter_value1 ], filter_name2: [ filter_value2 ] }
|
||||
```
|
||||
|
||||
Example `ec2_instance_attribute()` query
|
||||
|
||||
ec2_instance_attribute(us-east-1, InstanceId, { "tag:Environment": [ "production" ] })
|
||||
|
||||
### Selecting Attributes
|
||||
|
||||
Only 1 attribute per instance can be returned. Any flat attribute can be selected (i.e. if the attribute has a single value and isn't an object or array). Below is a list of available flat attributes:
|
||||
|
||||
* `AmiLaunchIndex`
|
||||
* `Architecture`
|
||||
* `ClientToken`
|
||||
* `EbsOptimized`
|
||||
* `EnaSupport`
|
||||
* `Hypervisor`
|
||||
* `IamInstanceProfile`
|
||||
* `ImageId`
|
||||
* `InstanceId`
|
||||
* `InstanceLifecycle`
|
||||
* `InstanceType`
|
||||
* `KernelId`
|
||||
* `KeyName`
|
||||
* `LaunchTime`
|
||||
* `Platform`
|
||||
* `PrivateDnsName`
|
||||
* `PrivateIpAddress`
|
||||
* `PublicDnsName`
|
||||
* `PublicIpAddress`
|
||||
* `RamdiskId`
|
||||
* `RootDeviceName`
|
||||
* `RootDeviceType`
|
||||
* `SourceDestCheck`
|
||||
* `SpotInstanceRequestId`
|
||||
* `SriovNetSupport`
|
||||
* `SubnetId`
|
||||
* `VirtualizationType`
|
||||
* `VpcId`
|
||||
|
||||
Tags can be selected by prepending the tag name with `Tags.`
|
||||
|
||||
Example `ec2_instance_attribute()` query
|
||||
|
||||
ec2_instance_attribute(us-east-1, Tags.Name, { "tag:Team": [ "sysops" ] })
|
||||
|
||||
## Cost
|
||||
|
||||
Amazon provides 1 million CloudWatch API requests each month at no additional charge. Past this,
|
||||
it costs $0.01 per 1,000 GetMetricStatistics or ListMetrics requests. For each query Grafana will
|
||||
issue a GetMetricStatistics request and every time you pick a dimension in the query editor
|
||||
Grafana will issue a ListMetrics request.
|
||||
|
||||
|
||||
138
docs/sources/features/datasources/elasticsearch.md
Normal file
138
docs/sources/features/datasources/elasticsearch.md
Normal file
@@ -0,0 +1,138 @@
|
||||
+++
|
||||
title = "Using Elasticsearch in Grafana"
|
||||
description = "Guide for using Elasticsearch in Grafana"
|
||||
keywords = ["grafana", "elasticsearch", "guide"]
|
||||
type = "docs"
|
||||
aliases = ["/datasources/elasticsearch"]
|
||||
[menu.docs]
|
||||
name = "Elasticsearch"
|
||||
parent = "datasources"
|
||||
weight = 3
|
||||
+++
|
||||
|
||||
# Using Elasticsearch in Grafana
|
||||
|
||||
Grafana ships with advanced support for Elasticsearch. You can do many types of simple or complex Elasticsearch queries to
|
||||
visualize logs or metrics stored in Elasticsearch. You can also annotate your graphs with log events stored in Elasticsearch.
|
||||
|
||||
## Adding the data source
|
||||
|
||||
1. Open the side menu by clicking the Grafana icon in the top header.
|
||||
2. In the side menu under the `Dashboards` link you should find a link named `Data Sources`.
|
||||
3. Click the `+ Add data source` button in the top header.
|
||||
4. Select *Elasticsearch* from the *Type* dropdown.
|
||||
|
||||
> NOTE: If you're not seeing the `Data Sources` link in your side menu it means that your current user does not have the `Admin` role for the current organization.
|
||||
|
||||
Name | Description
|
||||
------------ | -------------
|
||||
*Name* | The data source name. This is how you refer to the data source in panels & queries.
|
||||
*Default* | Default data source means that it will be pre-selected for new panels.
|
||||
*Url* | The HTTP protocol, IP, and port of your Elasticsearch server.
|
||||
*Access* | Proxy = access via Grafana backend, Direct = access directly from browser.
|
||||
|
||||
Proxy access means that the Grafana backend will proxy all requests from the browser, and send them on to the Data Source. This is useful because it can eliminate CORS (Cross Origin Site Resource) issues, as well as eliminate the need to disseminate authentication to the browser.
|
||||
|
||||
### Direct access
|
||||
|
||||
If you select direct access you must update your Elasticsearch configuration to allow other domains to access
|
||||
Elasticsearch from the browser. You do this by specifying these to options in your **elasticsearch.yml** config file.
|
||||
|
||||
http.cors.enabled: true
|
||||
http.cors.allow-origin: "*"
|
||||
|
||||
### Index settings
|
||||
|
||||

|
||||
|
||||
Here you can specify a default for the `time field` and specify the name of your Elasticsearch index. You can use
|
||||
a time pattern for the index name or a wildcard.
|
||||
|
||||
### Elasticsearch version
|
||||
|
||||
Be sure to specify your Elasticsearch version in the version selection dropdown. This is very important as there are differences how queries are composed. Currently only 2.x and 5.x
|
||||
are supported.
|
||||
|
||||
## Metric Query editor
|
||||
|
||||

|
||||
|
||||
The Elasticsearch query editor allows you to select multiple metrics and group by multiple terms or filters. Use the plus and minus icons to the right to add/remove
|
||||
metrics or group by clauses. Some metrics and group by clauses haves options, click the option text to expand the row to view and edit metric or group by options.
|
||||
|
||||
## Series naming & alias patterns
|
||||
|
||||
You can control the name for time series via the `Alias` input field.
|
||||
|
||||
Pattern | Description
|
||||
------------ | -------------
|
||||
*{{term fieldname}}* | replaced with value of a term group by
|
||||
*{{metric}}* | replaced with metric name (ex. Average, Min, Max)
|
||||
*{{field}}* | replaced with the metric field name
|
||||
|
||||
## Pipeline metrics
|
||||
|
||||
Some metric aggregations are called Pipeline aggregations, for example, *Moving Average* and *Derivative*. Elasticsearch pipeline metrics require another metric to be based on. Use the eye icon next to the metric to hide metrics from appearing in the graph. This is useful for metrics you only have in the query for use in a pipeline metric.
|
||||
|
||||

|
||||
|
||||
## Templating
|
||||
|
||||
Instead of hard-coding things like server, application and sensor name in you metric queries you can use variables in their place.
|
||||
Variables are shown as dropdown select boxes at the top of the dashboard. These dropdowns makes it easy to change the data
|
||||
being displayed in your dashboard.
|
||||
|
||||
Checkout the [Templating]({{< relref "reference/templating.md" >}}) documentation for an introduction to the templating feature and the different
|
||||
types of template variables.
|
||||
|
||||
### Query variable
|
||||
|
||||
The Elasticsearch data source supports two types of queries you can use in the *Query* field of *Query* variables. The query is written using a custom JSON string.
|
||||
|
||||
Query | Description
|
||||
------------ | -------------
|
||||
*{"find": "fields", "type": "keyword"} | Returns a list of field names with the index type `keyword`.
|
||||
*{"find": "terms", "field": "@hostname", "size": 1000}* | Returns a list of values for a field using term aggregation. Query will user current dashboard time range as time range for query.
|
||||
*{"find": "terms", "field": "@hostname", "query": '<lucene query>'}* | Returns a list of values for a field using term aggregation & and a specified lucene query filter. Query will use current dashboard time range as time range for query.
|
||||
|
||||
There is a default size limit of 500 on terms queries. Set the size property in your query to set a custom limit.
|
||||
You can use other variables inside the query. Example query definition for a variable named `$host`.
|
||||
|
||||
```
|
||||
{"find": "terms", "field": "@hostname", "query": "@source:$source"}
|
||||
```
|
||||
|
||||
In the above example, we use another variable named `$source` inside the query definition. Whenever you change, via the dropdown, the current value of the ` $source` variable, it will trigger an update of the `$host` variable so it now only contains hostnames filtered by in this case the
|
||||
`@source` document property.
|
||||
|
||||
### Using variables in queries
|
||||
|
||||
There are two syntaxes:
|
||||
|
||||
- `$<varname>` Example: @hostname:$hostname
|
||||
- `[[varname]]` Example: @hostname:[[hostname]]
|
||||
|
||||
Why two ways? The first syntax is easier to read and write but does not allow you to use a variable in the middle of a word. When the *Multi-value* or *Include all value*
|
||||
options are enabled, Grafana converts the labels from plain text to a lucene compatible condition.
|
||||
|
||||

|
||||
|
||||
In the above example, we have a lucene query that filters documents based on the `@hostname` property using a variable named `$hostname`. It is also using
|
||||
a variable in the *Terms* group by field input box. This allows you to use a variable to quickly change how the data is grouped.
|
||||
|
||||
Example dashboard:
|
||||
[Elasticsearch Templated Dashboard](http://play.grafana.org/dashboard/db/elasticsearch-templated)
|
||||
|
||||
## Annotations
|
||||
|
||||
[Annotations]({{< relref "reference/annotations.md" >}}) allows you to overlay rich event information on top of graphs. You add annotation
|
||||
queries via the Dashboard menu / Annotations view. Grafana can query any Elasticsearch index
|
||||
for annotation events.
|
||||
|
||||
Name | Description
|
||||
------------ | -------------
|
||||
Query | You can leave the search query blank or specify a lucene query
|
||||
Time | The name of the time field, needs to be date field.
|
||||
Title | The name of the field to use for the event title.
|
||||
Tags | Optional field name to use for event tags (can be an array or a CSV string).
|
||||
Text | Optional field name to use event text body.
|
||||
122
docs/sources/features/datasources/graphite.md
Normal file
122
docs/sources/features/datasources/graphite.md
Normal file
@@ -0,0 +1,122 @@
|
||||
+++
|
||||
title = "Using Graphite in Grafana"
|
||||
description = "Guide for using graphite in Grafana"
|
||||
keywords = ["grafana", "graphite", "guide"]
|
||||
type = "docs"
|
||||
aliases = ["/datasources/graphite"]
|
||||
[menu.docs]
|
||||
name = "Graphite"
|
||||
identifier = "graphite"
|
||||
parent = "datasources"
|
||||
weight = 1
|
||||
+++
|
||||
|
||||
# Using Graphite in Grafana
|
||||
|
||||
Grafana has an advanced Graphite query editor that lets you quickly navigate the metric space, add functions,
|
||||
change function parameters and much more. The editor can handle all types of graphite queries. It can even handle complex nested
|
||||
queries through the use of query references.
|
||||
|
||||
## Adding the data source
|
||||
|
||||
1. Open the side menu by clicking the Grafana icon in the top header.
|
||||
2. In the side menu under the `Dashboards` link you should find a link named `Data Sources`.
|
||||
3. Click the `+ Add data source` button in the top header.
|
||||
4. Select `Graphite` from the *Type* dropdown.
|
||||
|
||||
> NOTE: If you're not seeing the `Data Sources` link in your side menu it means that your current user does not have the `Admin` role for the current organization.
|
||||
|
||||
Name | Description
|
||||
------------ | -------------
|
||||
*Name* | The data source name. This is how you refer to the data source in panels & queries.
|
||||
*Default* | Default data source means that it will be pre-selected for new panels.
|
||||
*Url* | The HTTP protocol, IP, and port of your graphite-web or graphite-api install.
|
||||
*Access* | Proxy = access via Grafana backend, Direct = access directly from browser.
|
||||
|
||||
Proxy access means that the Grafana backend will proxy all requests from the browser, and send them on to the Data Source. This is useful because it can eliminate CORS (Cross Origin Site Resource) issues, as well as eliminate the need to disseminate authentication details to the browser.
|
||||
|
||||
## Metric editor
|
||||
|
||||
### Navigate metric segments
|
||||
Click the ``Select metric`` link to start navigating the metric space. One you start you can continue using the mouse
|
||||
or keyboard arrow keys. You can select a wildcard and still continue.
|
||||
|
||||
{{< docs-imagebox img="/img/docs/v45/graphite_query1_still.png"
|
||||
animated-gif="/img/docs/v45/graphite_query1.gif" >}}
|
||||
|
||||
|
||||
### Functions
|
||||
|
||||
Click the plus icon to the right to add a function. You can search for the function or select it from the menu. Once
|
||||
a function is selected it will be added and your focus will be in the text box of the first parameter. To later change
|
||||
a parameter just click on it and it will turn into a text box. To delete a function click the function name followed
|
||||
by the x icon.
|
||||
|
||||
{{< docs-imagebox img="/img/docs/v45/graphite_query2_still.png"
|
||||
animated-gif="/img/docs/v45/graphite_query2.gif" >}}
|
||||
|
||||
|
||||
### Optional parameters
|
||||
|
||||
Some functions like aliasByNode support an optional second argument. To add this parameter specify for example 3,-2 as the first parameter and the function editor will adapt and move the -2 to a second parameter. To remove the second optional parameter just click on it and leave it blank and the editor will remove it.
|
||||
|
||||
{{< docs-imagebox img="/img/docs/v45/graphite_query3_still.png"
|
||||
animated-gif="/img/docs/v45/graphite_query3.gif" >}}
|
||||
|
||||
|
||||
### Nested Queries
|
||||
|
||||
You can reference queries by the row “letter” that they’re on (similar to Microsoft Excel). If you add a second query to a graph, you can reference the first query simply by typing in #A. This provides an easy and convenient way to build compounded queries.
|
||||
|
||||
{{< docs-imagebox img="/img/docs/v45/graphite_nested_queries_still.png"
|
||||
animated-gif="/img/docs/v45/graphite_nested_queries.gif" >}}
|
||||
|
||||
|
||||
## Point consolidation
|
||||
|
||||
All Graphite metrics are consolidated so that Graphite doesn't return more data points than there are pixels in the graph. By default,
|
||||
this consolidation is done using `avg` function. You can how Graphite consolidates metrics by adding the Graphite consolidateBy function.
|
||||
|
||||
> *Notice* This means that legend summary values (max, min, total) cannot be all correct at the same time. They are calculated
|
||||
> client side by Grafana. And depending on your consolidation function only one or two can be correct at the same time.
|
||||
|
||||
## Templating
|
||||
|
||||
Instead of hard-coding things like server, application and sensor name in you metric queries you can use variables in their place.
|
||||
Variables are shown as dropdown select boxes at the top of the dashboard. These dropdowns makes it easy to change the data
|
||||
being displayed in your dashboard.
|
||||
|
||||
Checkout the [Templating]({{< relref "reference/templating.md" >}}) documentation for an introduction to the templating feature and the different
|
||||
types of template variables.
|
||||
|
||||
### Query variable
|
||||
|
||||
The query you specify in the query field should be a metric find type of query. For example, a query like `prod.servers.*` will fill the
|
||||
variable with all possible values that exist in the wildcard position.
|
||||
|
||||
You can also create nested variables that use other variables in their definition. For example
|
||||
`apps.$app.servers.*` uses the variable `$app` in its query definition.
|
||||
|
||||
### Variable usage
|
||||
|
||||
You can use a variable in a metric node path or as a parameter to a function.
|
||||

|
||||
|
||||
There are two syntaxes:
|
||||
|
||||
- `$<varname>` Example: apps.frontend.$server.requests.count
|
||||
- `[[varname]]` Example: apps.frontend.[[server]].requests.count
|
||||
|
||||
Why two ways? The first syntax is easier to read and write but does not allow you to use a variable in the middle of a word. Use
|
||||
the second syntax in expressions like `my.server[[serverNumber]].count`.
|
||||
|
||||
Example:
|
||||
[Graphite Templated Dashboard](http://play.grafana.org/dashboard/db/graphite-templated-nested)
|
||||
|
||||
## Annotations
|
||||
|
||||
[Annotations]({{< relref "reference/annotations.md" >}}) allows you to overlay rich event information on top of graphs. You add annotation
|
||||
queries via the Dashboard menu / Annotations view.
|
||||
|
||||
Graphite supports two ways to query annotations. A regular metric query, for this you use the `Graphite query` textbox. A Graphite events query, use the `Graphite event tags` textbox,
|
||||
specify a tag or wildcard (leave empty should also work)
|
||||
@@ -9,13 +9,16 @@ weight = 5
|
||||
+++
|
||||
|
||||
# Data Source Overview
|
||||
|
||||
Grafana supports many different storage backends for your time series data (Data Source). Each Data Source has a specific Query Editor that is customized for the features and capabilities that the particular Data Source exposes.
|
||||
|
||||
|
||||
## Querying
|
||||
|
||||
The query language and capabilities of each Data Source are obviously very different. You can combine data from multiple Data Sources onto a single Dashboard, but each Panel is tied to a specific Data Source that belongs to a particular Organization.
|
||||
|
||||
## Supported Data Sources
|
||||
|
||||
The following datasources are officially supported:
|
||||
|
||||
* [Graphite]({{< relref "graphite.md" >}})
|
||||
@@ -27,5 +30,5 @@ The following datasources are officially supported:
|
||||
|
||||
## Data source plugins
|
||||
|
||||
Since grafana 3.0 you can install data sources as plugins. Checkout [Grafana.net](https://grafana.net/plugins) for more data sources.
|
||||
Since grafana 3.0 you can install data sources as plugins. Checkout [Grafana.net](https://grafana.com/plugins) for more data sources.
|
||||
|
||||
178
docs/sources/features/datasources/influxdb.md
Normal file
178
docs/sources/features/datasources/influxdb.md
Normal file
@@ -0,0 +1,178 @@
|
||||
+++
|
||||
title = "Using InfluxDB in Grafana"
|
||||
description = "Guide for using InfluxDB in Grafana"
|
||||
keywords = ["grafana", "influxdb", "guide"]
|
||||
type = "docs"
|
||||
aliases = ["/datasources/influxdb"]
|
||||
[menu.docs]
|
||||
name = "InfluxDB"
|
||||
parent = "datasources"
|
||||
weight = 3
|
||||
+++
|
||||
|
||||
# Using InfluxDB in Grafana
|
||||
|
||||
Grafana ships with very feature rich data source plugin for InfluxDB. Supporting a feature rich query editor, annotation and templating queries.
|
||||
|
||||
## Adding the data source
|
||||
|
||||
1. Open the side menu by clicking the Grafana icon in the top header.
|
||||
2. In the side menu under the `Dashboards` link you should find a link named `Data Sources`.
|
||||
3. Click the `+ Add data source` button in the top header.
|
||||
4. Select *InfluxDB* from the *Type* dropdown.
|
||||
|
||||
> NOTE: If you're not seeing the `Data Sources` link in your side menu it means that your current user does not have the `Admin` role for the current organization.
|
||||
|
||||
Name | Description
|
||||
------------ | -------------
|
||||
*Name* | The data source name. This is how you refer to the data source in panels & queries.
|
||||
*Default* | Default data source means that it will be pre-selected for new panels.
|
||||
*Url* | The http protocol, ip and port of you influxdb api (influxdb api port is by default 8086)
|
||||
*Access* | Proxy = access via Grafana backend, Direct = access directly from browser.
|
||||
*Database* | Name of your influxdb database
|
||||
*User* | Name of your database user
|
||||
*Password* | Database user's password
|
||||
|
||||
### Proxy vs Direct access
|
||||
|
||||
Proxy access means that the Grafana backend will proxy all requests from the browser. So requests to InfluxDB will be channeled through
|
||||
`grafana-server`. This means that the URL you specify needs to be accessible from the server you are running Grafana on. Proxy access
|
||||
mode is also more secure as the username & password will never reach the browser.
|
||||
|
||||
## Query Editor
|
||||
|
||||
{{< docs-imagebox img="/img/docs/v45/influxdb_query_still.png" class="docs-image--no-shadow" animated-gif="/img/docs/v45/influxdb_query.gif" >}}
|
||||
|
||||
You find the InfluxDB editor in the metrics tab in Graph or Singlestat panel's edit mode. You enter edit mode by clicking the
|
||||
panel title, then edit. The editor allows you to select metrics and tags.
|
||||
|
||||
### Filter data (WHERE)
|
||||
To add a tag filter click the plus icon to the right of the `WHERE` condition. You can remove tag filters by clicking on
|
||||
the tag key and select `--remove tag filter--`.
|
||||
|
||||
**Regex matching**
|
||||
|
||||
You can type in regex patterns for metric names or tag filter values, be sure to wrap the regex pattern in forward slashes (`/`). Grafana
|
||||
will automatically adjust the filter tag condition to use the InfluxDB regex match condition operator (`=~`).
|
||||
|
||||
### Field & Aggregation functions
|
||||
In the `SELECT` row you can specify what fields and functions you want to use. If you have a
|
||||
group by time you need an aggregation function. Some functions like derivative require an aggregation function. The editor tries simplify and unify this part of the query. For example:<br>
|
||||
<br>
|
||||
|
||||
The above will generate the following InfluxDB `SELECT` clause:
|
||||
|
||||
```sql
|
||||
SELECT derivative(mean("value"), 10s) /10 AS "REQ/s" FROM ....
|
||||
```
|
||||
|
||||
#### Select multiple fields
|
||||
Use the plus button and select Field > field to add another SELECT clause. You can also
|
||||
specify an asterix `*` to select all fields.
|
||||
|
||||
### Group By
|
||||
To group by a tag click the plus icon at the end of the GROUP BY row. Pick a tag from the dropdown that appears.
|
||||
You can remove the group by by clicking on the `tag` and then click on the x icon.
|
||||
|
||||
### Text Editor Mode (RAW)
|
||||
You can switch to raw query mode by clicking hamburger icon and then `Switch editor mode`.
|
||||
|
||||
> If you use Raw Query be sure your query at minimum have `WHERE $timeFilter`
|
||||
> Also please always have a group by time and an aggregation function, otherwise InfluxDB can easily return hundreds of thousands
|
||||
> of data points that will hang the browser.
|
||||
|
||||
### Alias patterns
|
||||
|
||||
- $m = replaced with measurement name
|
||||
- $measurement = replaced with measurement name
|
||||
- $col = replaced with column name
|
||||
- $tag_exampletag = replaced with the value of the `exampletag` tag. The syntax is `$tag_yourTagName` (must start with `$tag_`). To use your tag as an alias in the ALIAS BY field then the tag must be used to group by in the query.
|
||||
- You can also use [[tag_hostname]] pattern replacement syntax. For example, in the ALIAS BY field using this text `Host: [[tag_hostname]]` would substitute in the `hostname` tag value for each legend value and an example legend value would be: `Host: server1`.
|
||||
|
||||
### Table query / raw data
|
||||
|
||||

|
||||
|
||||
You can remove the group by time by clicking on the `time` part and then the `x` icon. You can
|
||||
change the option `Format As` to `Table` if you want to show raw data in the `Table` panel.
|
||||
|
||||
|
||||
## Templating
|
||||
|
||||
Instead of hard-coding things like server, application and sensor name in you metric queries you can use variables in their place.
|
||||
Variables are shown as dropdown select boxes at the top of the dashboard. These dropdowns makes it easy to change the data
|
||||
being displayed in your dashboard.
|
||||
|
||||
Checkout the [Templating]({{< relref "reference/templating.md" >}}) documentation for an introduction to the templating feature and the different
|
||||
types of template variables.
|
||||
|
||||
### Query variable
|
||||
|
||||
If you add a template variable of the type `Query` you can write a InfluxDB exploration (meta data) query. These queries can
|
||||
return things like measurement names, key names or key values.
|
||||
|
||||
For example you can have a variable that contains all values for tag `hostname` if you specify a query like this in the templating variable *Query* setting.
|
||||
|
||||
```sql
|
||||
SHOW TAG VALUES WITH KEY = "hostname"
|
||||
```
|
||||
|
||||
You can also create nested variables. For example if you had another variable, for example `region`. Then you could have
|
||||
the hosts variable only show hosts from the current selected region with a query like this:
|
||||
|
||||
```sql
|
||||
SHOW TAG VALUES WITH KEY = "hostname" WHERE region =~ /$region/
|
||||
```
|
||||
|
||||
You can fetch key names for a given measurement.
|
||||
|
||||
```sql
|
||||
SHOW TAG KEYS [FROM <measurement_name>]
|
||||
```
|
||||
|
||||
If you have a variable with key names you can use this variable in a group by clause. This will allow you to change group by using the variable dropdown at the top
|
||||
of the dashboard.
|
||||
|
||||
### Using variables in queries
|
||||
|
||||
There are two syntaxes:
|
||||
|
||||
`$<varname>` Example:
|
||||
|
||||
```sql
|
||||
SELECT mean("value") FROM "logins" WHERE "hostname" =~ /^$host$/ AND $timeFilter GROUP BY time($__interval), "hostname"
|
||||
```
|
||||
|
||||
`[[varname]]` Example:
|
||||
|
||||
```sql
|
||||
SELECT mean("value") FROM "logins" WHERE "hostname" =~ /^[[host]]$/ AND $timeFilter GROUP BY time($__interval), "hostname"
|
||||
```
|
||||
|
||||
Why two ways? The first syntax is easier to read and write but does not allow you to use a variable in the middle of a word. When the *Multi-value* or *Include all value*
|
||||
options are enabled, Grafana converts the labels from plain text to a regex compatible string. Which means you have to use `=~` instead of `=`.
|
||||
|
||||
Example Dashboard:
|
||||
[InfluxDB Templated Dashboard](http://play.grafana.org/dashboard/db/influxdb-templated-queries)
|
||||
|
||||
### Ad hoc filters variable
|
||||
|
||||
InfluxDB supports the special `Ad hoc filters` variable type. This variable allows you to specify any number of key/value filters on the fly. These filters will automatically
|
||||
be applied to all your InfluxDB queries.
|
||||
|
||||
## Annotations
|
||||
|
||||
[Annotations]({{< relref "reference/annotations.md" >}}) allows you to overlay rich event information on top of graphs. You add annotation
|
||||
queries via the Dashboard menu / Annotations view.
|
||||
|
||||
An example query:
|
||||
|
||||
```SQL
|
||||
SELECT title, description from events WHERE $timeFilter order asc
|
||||
```
|
||||
|
||||
For InfluxDB you need to enter a query like in the above example. You need to have the ```where $timeFilter```
|
||||
part. If you only select one column you will not need to enter anything in the column mapping fields. The
|
||||
Tags field can be a comma seperated string.
|
||||
|
||||
|
||||
176
docs/sources/features/datasources/mysql.md
Normal file
176
docs/sources/features/datasources/mysql.md
Normal file
@@ -0,0 +1,176 @@
|
||||
+++
|
||||
title = "Using MySQL in Grafana"
|
||||
description = "Guide for using MySQL in Grafana"
|
||||
keywords = ["grafana", "mysql", "guide"]
|
||||
type = "docs"
|
||||
[menu.docs]
|
||||
name = "MySQL"
|
||||
parent = "datasources"
|
||||
weight = 7
|
||||
+++
|
||||
|
||||
# Using MySQL in Grafana
|
||||
|
||||
> Only available in Grafana v4.3+.
|
||||
|
||||
Grafana ships with a built-in MySQL data source plugin that allow you to query any visualize
|
||||
data from a MySQL compatible database.
|
||||
|
||||
## Adding the data source
|
||||
|
||||
1. Open the side menu by clicking the Grafana icon in the top header.
|
||||
2. In the side menu under the `Dashboards` link you should find a link named `Data Sources`.
|
||||
3. Click the `+ Add data source` button in the top header.
|
||||
4. Select *MySQL* from the *Type* dropdown.
|
||||
|
||||
### Database User Permissions (Important!)
|
||||
|
||||
The database user you specify when you add the data source should only be granted SELECT permissions on
|
||||
the specified database & tables you want to query. Grafana does not validate that the query is safe. The query
|
||||
could include any SQL statement. For example, statements like `USE otherdb;` and `DROP TABLE user;` would be
|
||||
executed. To protect against this we **Highly** recommmend you create a specific mysql user with restricted permissions.
|
||||
|
||||
Example:
|
||||
|
||||
```sql
|
||||
CREATE USER 'grafanaReader' IDENTIFIED BY 'password';
|
||||
GRANT SELECT ON mydatabase.mytable TO 'grafanaReader';
|
||||
```
|
||||
|
||||
You can use wildcards (`*`) in place of database or table if you want to grant access to more databases and tables.
|
||||
|
||||
## Macros
|
||||
|
||||
To simplify syntax and to allow for dynamic parts, like date range filters, the query can contain macros.
|
||||
|
||||
Macro example | Description
|
||||
------------ | -------------
|
||||
*$__timeFilter(dateColumn)* | Will be replaced by a time range filter using the specified column name. For example, *dateColumn > FROM_UNIXTIME(1494410783) AND dateColumn < FROM_UNIXTIME(1494497183)*
|
||||
|
||||
We plan to add many more macros. If you have suggestions for what macros you would like to see, please [open an issue](https://github.com/grafana/grafana) in our GitHub repo.
|
||||
|
||||
The query editor has a link named `Generated SQL` that show up after a query as been executed, while in panel edit mode. Click on it and it will expand and show the raw interpolated SQL string that was executed.
|
||||
|
||||
## Table queries
|
||||
|
||||
If the `Format as` query option is set to `Table` then you can basically do any type of SQL query. The table panel will automatically show the results of whatever columns & rows your query returns.
|
||||
|
||||
Query editor with example query:
|
||||
|
||||
{{< docs-imagebox img="/img/docs/v45/mysql_table_query.png" >}}
|
||||
|
||||
The query:
|
||||
|
||||
```sql
|
||||
SELECT
|
||||
title as 'Title',
|
||||
user.login as 'Created By' ,
|
||||
dashboard.created as 'Created On'
|
||||
FROM dashboard
|
||||
INNER JOIN user on user.id = dashboard.created_by
|
||||
WHERE $__timeFilter(dashboard.created)
|
||||
```
|
||||
|
||||
You can control the name of the Table panel columns by using regular `as ` SQL column selection syntax.
|
||||
|
||||
The resulting table panel:
|
||||
|
||||

|
||||
|
||||
### Time series queries
|
||||
|
||||
If you set `Format as` to `Time series`, for use in Graph panel for example, then there are some requirements for
|
||||
what your query returns.
|
||||
|
||||
- Must be a column named `time_sec` representing a unix epoch in seconds.
|
||||
- Must be a column named `value` representing the time series value.
|
||||
- Must be a column named `metric` representing the time series name.
|
||||
|
||||
Example:
|
||||
|
||||
```sql
|
||||
SELECT
|
||||
min(UNIX_TIMESTAMP(time_date_time)) as time_sec,
|
||||
max(value_double) as value,
|
||||
metric1 as metric
|
||||
FROM test_data
|
||||
WHERE $__timeFilter(time_date_time)
|
||||
GROUP BY metric1, UNIX_TIMESTAMP(time_date_time) DIV 300
|
||||
ORDER BY time_sec asc
|
||||
```
|
||||
|
||||
Currently, there is no support for a dynamic group by time based on time range & panel width.
|
||||
This is something we plan to add.
|
||||
|
||||
## Templating
|
||||
|
||||
This feature is currently available in the nightly builds and will be included in the 5.0.0 release.
|
||||
|
||||
Instead of hard-coding things like server, application and sensor name in you metric queries you can use variables in their place. Variables are shown as dropdown select boxes at the top of the dashboard. These dropdowns makes it easy to change the data being displayed in your dashboard.
|
||||
|
||||
Checkout the [Templating]({{< relref "reference/templating.md" >}}) documentation for an introduction to the templating feature and the different types of template variables.
|
||||
|
||||
### Query Variable
|
||||
|
||||
If you add a template variable of the type `Query`, you can write a MySQL query that can
|
||||
return things like measurement names, key names or key values that are shown as a dropdown select box.
|
||||
|
||||
For example, you can have a variable that contains all values for the `hostname` column in a table if you specify a query like this in the templating variable *Query* setting.
|
||||
|
||||
```sql
|
||||
SELECT hostname FROM my_host
|
||||
```
|
||||
|
||||
A query can returns multiple columns and Grafana will automatically create a list from them. For example, the query below will return a list with values from `hostname` and `hostname2`.
|
||||
|
||||
```sql
|
||||
SELECT my_host.hostname, my_other_host.hostname2 FROM my_host JOIN my_other_host ON my_host.city = my_other_host.city
|
||||
```
|
||||
|
||||
Another option is a query that can create a key/value variable. The query should return two columns that are named `__text` and `__value`. The `__text` column value should be unique (if it is not unique then the first value is used). The options in the dropdown will have a text and value that allows you to have a friendly name as text and an id as the value. An example query with `hostname` as the text and `id` as the value:
|
||||
|
||||
```sql
|
||||
SELECT hostname AS __text, id AS __value FROM my_host
|
||||
```
|
||||
|
||||
You can also create nested variables. For example if you had another variable named `region`. Then you could have
|
||||
the hosts variable only show hosts from the current selected region with a query like this (if `region` is a multi-value variable then use the `IN` comparison operator rather than `=` to match against multiple values):
|
||||
|
||||
```sql
|
||||
SELECT hostname FROM my_host WHERE region IN($region)
|
||||
```
|
||||
|
||||
### Using Variables in Queries
|
||||
|
||||
Template variables are quoted automatically so if it is a string value do not wrap them in quotes in where clauses. If the variable is a multi-value variable then use the `IN` comparison operator rather than `=` to match against multiple values.
|
||||
|
||||
There are two syntaxes:
|
||||
|
||||
`$<varname>` Example with a template variable named `hostname`:
|
||||
|
||||
```sql
|
||||
SELECT
|
||||
UNIX_TIMESTAMP(atimestamp) as time_sec,
|
||||
aint as value,
|
||||
avarchar as metric
|
||||
FROM my_table
|
||||
WHERE $__timeFilter(atimestamp) and hostname in($hostname)
|
||||
ORDER BY atimestamp ASC
|
||||
```
|
||||
|
||||
`[[varname]]` Example with a template variable named `hostname`:
|
||||
|
||||
```sql
|
||||
SELECT
|
||||
UNIX_TIMESTAMP(atimestamp) as time_sec,
|
||||
aint as value,
|
||||
avarchar as metric
|
||||
FROM my_table
|
||||
WHERE $__timeFilter(atimestamp) and hostname in([[hostname]])
|
||||
ORDER BY atimestamp ASC
|
||||
```
|
||||
|
||||
## Alerting
|
||||
|
||||
Time series queries should work in alerting conditions. Table formatted queries is not yet supported in alert rule
|
||||
conditions.
|
||||
90
docs/sources/features/datasources/opentsdb.md
Normal file
90
docs/sources/features/datasources/opentsdb.md
Normal file
@@ -0,0 +1,90 @@
|
||||
+++
|
||||
title = "Using OpenTSDB in Grafana"
|
||||
description = "Guide for using OpenTSDB in Grafana"
|
||||
keywords = ["grafana", "opentsdb", "guide"]
|
||||
type = "docs"
|
||||
aliases = ["/datasources/opentsdb", "docs/features/opentsdb"]
|
||||
[menu.docs]
|
||||
name = "OpenTSDB"
|
||||
parent = "datasources"
|
||||
weight = 5
|
||||
+++
|
||||
|
||||
# Using OpenTSDB in Grafana
|
||||
|
||||
Grafana ships with advanced support for OpenTSDB.
|
||||
|
||||
## Adding the data source
|
||||
|
||||
1. Open the side menu by clicking the Grafana icon in the top header.
|
||||
2. In the side menu under the `Dashboards` link you should find a link named `Data Sources`.
|
||||
3. Click the `+ Add data source` button in the top header.
|
||||
4. Select *OpenTSDB* from the *Type* dropdown.
|
||||
|
||||
> NOTE: If you're not seeing the `Data Sources` link in your side menu it means that your current user does not have the `Admin` role for the current organization.
|
||||
|
||||
Name | Description
|
||||
------------ | -------------
|
||||
*Name* | The data source name. This is how you refer to the data source in panels & queries.
|
||||
*Default* | Default data source means that it will be pre-selected for new panels.
|
||||
*Url* | The http protocol, ip and port of you opentsdb server (default port is usually 4242)
|
||||
*Access* | Proxy = access via Grafana backend, Direct = access directly from browser.
|
||||
*Version* | Version = opentsdb version, either <=2.1 or 2.2
|
||||
*Resolution* | Metrics from opentsdb may have datapoints with either second or millisecond resolution.
|
||||
|
||||
|
||||
## Query editor
|
||||
|
||||
Open a graph in edit mode by click the title. Query editor will differ if the datasource has version <=2.1 or = 2.2.
|
||||
In the former version, only tags can be used to query OpenTSDB. But in the latter version, filters as well as tags
|
||||
can be used to query opentsdb. Fill Policy is also introduced in OpenTSDB 2.2.
|
||||
|
||||

|
||||
|
||||
> Note: While using OpenTSDB 2.2 datasource, make sure you use either Filters or Tags as they are mutually exclusive. If used together, might give you weird results.
|
||||
|
||||
### Auto complete suggestions
|
||||
|
||||
As soon as you start typing metric names, tag names and tag values , you should see highlighted auto complete suggestions for them.
|
||||
The autocomplete only works if the OpenTSDB suggest api is enabled.
|
||||
|
||||
## Templating queries
|
||||
|
||||
Instead of hard-coding things like server, application and sensor name in you metric queries you can use variables in their place.
|
||||
Variables are shown as dropdown select boxes at the top of the dashboard. These dropdowns makes it easy to change the data
|
||||
being displayed in your dashboard.
|
||||
|
||||
Checkout the [Templating]({{< relref "reference/templating.md" >}}) documentation for an introduction to the templating feature and the different
|
||||
types of template variables.
|
||||
|
||||
### Query variable
|
||||
|
||||
Grafana's OpenTSDB data source supports template variable queries. This means you can create template variables
|
||||
that fetch the values from OpenTSDB. For example, metric names, tag names, or tag values.
|
||||
|
||||
When using OpenTSDB with a template variable of `query` type you can use following syntax for lookup.
|
||||
|
||||
Query | Description
|
||||
------------ | -------------
|
||||
*metrics(prefix)* | Returns metric names with specific prefix (can be empty)
|
||||
*tag_names(cpu)* | Return tag names (i.e. keys) for a specific cpu metric
|
||||
*tag_values(cpu, hostname)* | Return tag values for metric cpu and tag key hostname
|
||||
*suggest_tagk(prefix)* | Return tag names (i.e. keys) for all metrics with specific prefix (can be empty)
|
||||
*suggest_tagv(prefix)* | Return tag values for all metrics with specific prefix (can be empty)
|
||||
|
||||
If you do not see template variables being populated in `Preview of values` section, you need to enable
|
||||
`tsd.core.meta.enable_realtime_ts` in the OpenTSDB server settings. Also, to populate metadata of
|
||||
the existing time series data in OpenTSDB, you need to run `tsdb uid metasync` on the OpenTSDB server.
|
||||
|
||||
### Nested Templating
|
||||
|
||||
One template variable can be used to filter tag values for another template varible. First parameter is the metric name,
|
||||
second parameter is the tag key for which you need to find tag values, and after that all other dependent template variables.
|
||||
Some examples are mentioned below to make nested template queries work successfully.
|
||||
|
||||
Query | Description
|
||||
------------ | -------------
|
||||
*tag_values(cpu, hostname, env=$env)* | Return tag values for cpu metric, selected env tag value and tag key hostname
|
||||
*tag_values(cpu, hostanme, env=$env, region=$region)* | Return tag values for cpu metric, selected env tag value, selected region tag value and tag key hostname
|
||||
|
||||
For details on OpenTSDB metric queries checkout the official [OpenTSDB documentation](http://opentsdb.net/docs/build/html/index.html)
|
||||
97
docs/sources/features/datasources/prometheus.md
Normal file
97
docs/sources/features/datasources/prometheus.md
Normal file
@@ -0,0 +1,97 @@
|
||||
+++
|
||||
title = "Using Prometheus in Grafana"
|
||||
description = "Guide for using Prometheus in Grafana"
|
||||
keywords = ["grafana", "prometheus", "guide"]
|
||||
type = "docs"
|
||||
aliases = ["/datasources/prometheus"]
|
||||
[menu.docs]
|
||||
name = "Prometheus"
|
||||
parent = "datasources"
|
||||
weight = 2
|
||||
+++
|
||||
|
||||
# Using Prometheus in Grafana
|
||||
|
||||
Grafana includes built-in support for Prometheus.
|
||||
|
||||
## Adding the data source to Grafana
|
||||
|
||||
1. Open the side menu by clicking the Grafana icon in the top header.
|
||||
2. In the side menu under the `Dashboards` link you should find a link named `Data Sources`.
|
||||
3. Click the `+ Add data source` button in the top header.
|
||||
4. Select `Prometheus` from the *Type* dropdown.
|
||||
|
||||
> NOTE: If you're not seeing the `Data Sources` link in your side menu it means that your current user does not have the `Admin` role for the current organization.
|
||||
|
||||
## Data source options
|
||||
|
||||
Name | Description
|
||||
------------ | -------------
|
||||
*Name* | The data source name. This is how you refer to the data source in panels & queries.
|
||||
*Default* | Default data source means that it will be pre-selected for new panels.
|
||||
*Url* | The http protocol, ip and port of you Prometheus server (default port is usually 9090)
|
||||
*Access* | Proxy = access via Grafana backend, Direct = access directly from browser.
|
||||
*Basic Auth* | Enable basic authentication to the Prometheus data source.
|
||||
*User* | Name of your Prometheus user
|
||||
*Password* | Database user's password
|
||||
|
||||
## Query editor
|
||||
|
||||
Open a graph in edit mode by click the title > Edit (or by pressing `e` key while hovering over panel).
|
||||
|
||||
{{< docs-imagebox img="/img/docs/v45/prometheus_query_editor_still.png"
|
||||
animated-gif="/img/docs/v45/prometheus_query_editor.gif" >}}
|
||||
|
||||
Name | Description
|
||||
------- | --------
|
||||
*Query expression* | Prometheus query expression, check out the [Prometheus documentation](http://prometheus.io/docs/querying/basics/).
|
||||
*Legend format* | Controls the name of the time series, using name or pattern. For example `{{hostname}}` will be replaced with label value for the label `hostname`.
|
||||
*Min step* | Set a lower limit for the Prometheus step option. Step controls how big the jumps are when the Prometheus query engine performs range queries. Sadly there is no official prometheus documentation to link to for this very important option.
|
||||
*Resolution* | Controls the step option. Small steps create high-resolution graphs but can be slow over larger time ranges, lowering the resolution can speed things up. `1/2` will try to set step option to generate 1 data point for every other pixel. A value of `1/10` will try to set step option so there is a data point every 10 pixels.
|
||||
*Metric lookup* | Search for metric names in this input field.
|
||||
*Format as* | **(New in v4.3)** Switch between Table & Time series. Table format will only work in the Table panel.
|
||||
|
||||
## Templating
|
||||
|
||||
Instead of hard-coding things like server, application and sensor name in you metric queries you can use variables in their place.
|
||||
Variables are shown as dropdown select boxes at the top of the dashboard. These dropdowns makes it easy to change the data
|
||||
being displayed in your dashboard.
|
||||
|
||||
Checkout the [Templating]({{< relref "reference/templating.md" >}}) documentation for an introduction to the templating feature and the different
|
||||
types of template variables.
|
||||
|
||||
### Query variable
|
||||
|
||||
Variable of the type *Query* allows you to query Prometheus for a list of metrics, labels or label values. The Prometheus data source plugin
|
||||
provides the following functions you can use in the `Query` input field.
|
||||
|
||||
Name | Description
|
||||
---- | --------
|
||||
*label_values(label)* | Returns a list of label values for the `label` in every metric.
|
||||
*label_values(metric, label)* | Returns a list of label values for the `label` in the specified metric.
|
||||
*metrics(metric)* | Returns a list of metrics matching the specified `metric` regex.
|
||||
*query_result(query)* | Returns a list of Prometheus query result for the `query`.
|
||||
|
||||
For details of *metric names*, *label names* and *label values* are please refer to the [Prometheus documentation](http://prometheus.io/docs/concepts/data_model/#metric-names-and-labels).
|
||||
|
||||
### Using variables in queries
|
||||
|
||||
There are two syntaxes:
|
||||
|
||||
- `$<varname>` Example: rate(http_requests_total{job=~"$job"}[5m])
|
||||
- `[[varname]]` Example: rate(http_requests_total{job=~"[[job]]"}[5m])
|
||||
|
||||
Why two ways? The first syntax is easier to read and write but does not allow you to use a variable in the middle of a word. When the *Multi-value* or *Include all value*
|
||||
options are enabled, Grafana converts the labels from plain text to a regex compatible string. Which means you have to use `=~` instead of `=`.
|
||||
|
||||
## Annotations
|
||||
|
||||
[Annotations]({{< relref "reference/annotations.md" >}}) allows you to overlay rich event information on top of graphs. You add annotation
|
||||
queries via the Dashboard menu / Annotations view.
|
||||
|
||||
Prometheus supports two ways to query annotations.
|
||||
|
||||
- A regular metric query
|
||||
- A Prometheus query for pending and firing alerts (for details see [Inspecting alerts during runtime](https://prometheus.io/docs/alerting/rules/#inspecting-alerts-during-runtime))
|
||||
|
||||
The step option is useful to limit the number of events returned from your query.
|
||||
47
docs/sources/features/datasources/testdata.md
Normal file
47
docs/sources/features/datasources/testdata.md
Normal file
@@ -0,0 +1,47 @@
|
||||
+++
|
||||
title = "TestData"
|
||||
keywords = ["grafana", "dashboard", "documentation", "panels", "testdata"]
|
||||
type = "docs"
|
||||
[menu.docs]
|
||||
name = "TestData"
|
||||
parent = "datasources"
|
||||
weight = 20
|
||||
+++
|
||||
|
||||
|
||||
# Grafana TestData
|
||||
|
||||
The purpose of this data sources is to make it easier to create fake data for any panel.
|
||||
Using `Grafana TestData` you can build your own time series and have any panel render it.
|
||||
This make is much easier to verify functionally since the data can be shared very easily.
|
||||
|
||||
## Enable
|
||||
|
||||
`Grafana TestData` is not enabled by default. To enable it you have to go to `/plugins/testdata/edit` and click the enable button to enable.
|
||||
|
||||
## Create mock data.
|
||||
|
||||
Once `Grafana TestData` is enabled you can use it as a data source in any metric panel.
|
||||
|
||||

|
||||
|
||||
## CSV
|
||||
|
||||
The comma separated values scenario is the most powerful one since it lets you create any kind of graph you like.
|
||||
Once you provided the numbers `Grafana TestData` will distribute them evenly based on the time range of your query.
|
||||
|
||||

|
||||
|
||||
## Dashboards
|
||||
|
||||
`Grafana TestData` also contains some dashboards with example. `/plugins/testdata/edit`
|
||||
|
||||
### Commit updates to the dashboards
|
||||
|
||||
If you want to submit a change to one of the current dashboards bundled with `Grafana TestData` you have to update the revision property.
|
||||
Otherwise the dashboard will not be updated automatically for other Grafana users.
|
||||
|
||||
## Using test data in issues
|
||||
|
||||
If you post an issue on github regarding time series data or rendering of time series data we strongly advice you to use this data source to replicate the data.
|
||||
That makes it much easier for the developers to replicate and solve the issue you have.
|
||||
@@ -2,6 +2,7 @@
|
||||
title = "Dashboard List"
|
||||
keywords = ["grafana", "dashboard list", "documentation", "panel", "dashlist"]
|
||||
type = "docs"
|
||||
aliases = ["/reference/dashlist/"]
|
||||
[menu.docs]
|
||||
name = "Dashboard list"
|
||||
parent = "panels"
|
||||
@@ -2,6 +2,7 @@
|
||||
title = "Graph Panel"
|
||||
keywords = ["grafana", "graph panel", "documentation", "guide", "graph"]
|
||||
type = "docs"
|
||||
aliases = ["/reference/graph/"]
|
||||
[menu.docs]
|
||||
name = "Graph"
|
||||
parent = "panels"
|
||||
@@ -18,7 +19,8 @@ Clicking the title for a panel exposes a menu. The `edit` option opens addition
|
||||
options for the panel.
|
||||
|
||||
## General
|
||||

|
||||
|
||||

|
||||
|
||||
The general tab allows customization of a panel's appearance and menu options.
|
||||
|
||||
@@ -31,14 +33,14 @@ The general tab allows customization of a panel's appearance and menu options.
|
||||
### Drilldown / detail link
|
||||
|
||||
The drilldown section allows adding dynamic links to the panel that can link to other dashboards
|
||||
or URLs
|
||||
or URLs.
|
||||
|
||||
Each link has a title, a type and params. A link can be either a ``dashboard`` or ``absolute`` links.
|
||||
If it is a dashboard links, the `dashboard` value must be the name of a dashboard. If it's an
|
||||
`absolute` link, the URL is the URL to link.
|
||||
If it is a dashboard link, the `dashboard` value must be the name of a dashboard. If it is an
|
||||
`absolute` link, the URL is the URL to the link.
|
||||
|
||||
``params`` allows adding additional URL params to the links. The format is the ``name=value`` with
|
||||
multiple params separate by ``&``. Template variables can be added as values using ``$myvar``.
|
||||
multiple params separated by ``&``. Template variables can be added as values using ``$myvar``.
|
||||
|
||||
When linking to another dashboard that uses template variables, you can use ``var-myvar=value`` to
|
||||
populate the template variable to a desired value from the link.
|
||||
@@ -48,15 +50,11 @@ populate the template variable to a desired value from the link.
|
||||
The metrics tab defines what series data and sources to render. Each datasource provides different
|
||||
options.
|
||||
|
||||
## Axes & Grid
|
||||
## Axes
|
||||
|
||||

|
||||

|
||||
|
||||
The Axes & Grid tab controls the display of axes, grids and legend.
|
||||
|
||||
### Axes
|
||||
|
||||
The ``Left Y`` and ``Right Y`` can be customized using:
|
||||
The Axes tab controls the display of axes, grids and legend. The ``Left Y`` and ``Right Y`` can be customized using:
|
||||
|
||||
- ``Unit`` - The display unit for the Y value
|
||||
- ``Grid Max`` - The maximum Y value. (default auto)
|
||||
@@ -65,6 +63,20 @@ The ``Left Y`` and ``Right Y`` can be customized using:
|
||||
|
||||
Axes can also be hidden by unchecking the appropriate box from `Show Axis`.
|
||||
|
||||
### X-Axis Mode
|
||||
|
||||
There are three options:
|
||||
|
||||
- The default option is `Time` and means the x-axis represents time and that the data is grouped by time (for example, by hour or by minute).
|
||||
|
||||
- The `Series` option means that the data is grouped by series and not by time. The y-axis still represents the value.
|
||||
|
||||
<img src="/img/docs/v4/x_axis_mode_series.png" class="no-shadow">
|
||||
|
||||
- The `Histogram` option converts the graph into a histogram. A Histogram is a kind of bar chart that groups numbers into ranges, often called buckets or bins. Taller bars show that more data falls in that range. Histograms and buckets are described in more detail [here](http://docs.grafana.org/features/panels/heatmap/#histograms-and-buckets).
|
||||
|
||||
<img src="/img/docs/v43/heatmap_histogram.png" class="no-shadow">
|
||||
|
||||
### Legend
|
||||
|
||||
The legend hand be hidden by checking the ``Show`` checkbox. If it's shown, it can be
|
||||
@@ -74,7 +86,6 @@ values can be hidden from the legend using the ``Hide empty`` checkbox.
|
||||
### Legend Values
|
||||
|
||||
Additional values can be shown along-side the legend names:
|
||||
|
||||
- ``Total`` - Sum of all values returned from metric query
|
||||
- ``Current`` - Last value returned from the metric query
|
||||
- ``Min`` - Minimum of all values returned from metric query
|
||||
@@ -83,16 +94,16 @@ Additional values can be shown along-side the legend names:
|
||||
- ``Decimals`` - Controls how many decimals are displayed for legend values (and graph hover tooltips)
|
||||
|
||||
The legend values are calculated client side by Grafana and depend on what type of
|
||||
aggregation or point consolidation you metric query is using. All the above legend values cannot
|
||||
aggregation or point consolidation your metric query is using. All the above legend values cannot
|
||||
be correct at the same time. For example if you plot a rate like requests/second, this is probably
|
||||
using average as aggregator, then the Total in the legend will not represent the total number of requests.
|
||||
It is just the sum of all data points received by Grafana.
|
||||
|
||||
## Display styles
|
||||
|
||||

|
||||

|
||||
|
||||
Display styles controls properties of the graph.
|
||||
Display styles control visual properties of the graph.
|
||||
|
||||
### Thresholds
|
||||
|
||||
@@ -108,19 +119,19 @@ the graph crosses a particular threshold.
|
||||
|
||||
### Line Options
|
||||
|
||||
- ``Line Fill`` - Amount of color fill for a series. 0 is none.
|
||||
- ``Line Fill`` - Amount of color fill for a series. 0 is none.
|
||||
- ``Line Width`` - The width of the line for a series.
|
||||
- ``Null point mode`` - How null values are displayed
|
||||
- ``Staircase line`` - Draws adjacent points as staircase
|
||||
|
||||
### Multiple Series
|
||||
|
||||
If there are multiple series, they can be display as a group.
|
||||
If there are multiple series, they can be displayed as a group.
|
||||
|
||||
- ``Stack`` - Each series is stacked on top of another
|
||||
- ``Percent`` - Each series is draw as a percent of the total of all series
|
||||
- ``Percent`` - Each series is drawn as a percentage of the total of all series
|
||||
|
||||
If you have stack enabled you can select what the mouse hover feature should show.
|
||||
If you have stack enabled, you can select what the mouse hover feature should show.
|
||||
|
||||
- Cumulative - Sum of series below plus the series you hover over
|
||||
- Individual - Just the value for the series you hover over
|
||||
@@ -134,11 +145,15 @@ If you have stack enabled you can select what the mouse hover feature should sho
|
||||
|
||||
- ``All series`` - Show all series on the same tooltip and a x crosshairs to help follow all series
|
||||
|
||||
### Series specific overrides
|
||||
### Series Specific Overrides
|
||||
|
||||
The section allows a series to be render different from the rest. For example, one series can be given
|
||||
a thicker line width to make it standout.
|
||||
The section allows a series to be rendered differently from the others. For example, one series can be given
|
||||
a thicker line width to make it stand out.
|
||||
|
||||
## Time range
|
||||
#### Dashes Drawing Style
|
||||
|
||||
There is an option under Series overrides to draw lines as dashes. Set Dashes to the value True to override the line draw setting for a specific series.
|
||||
|
||||
## Time Range
|
||||
|
||||

|
||||
108
docs/sources/features/panels/heatmap.md
Normal file
108
docs/sources/features/panels/heatmap.md
Normal file
@@ -0,0 +1,108 @@
|
||||
+++
|
||||
title = "Heatmap Panel"
|
||||
description = "Heatmap panel documentation"
|
||||
keywords = ["grafana", "heatmap", "panel", "documentation"]
|
||||
type = "docs"
|
||||
[menu.docs]
|
||||
name = "Heatmap"
|
||||
parent = "panels"
|
||||
weight = 3
|
||||
+++
|
||||
|
||||
# Heatmap Panel
|
||||
|
||||

|
||||
|
||||
> New panel only available in Grafana v4.3+
|
||||
|
||||
The Heatmap panel allows you to view histograms over time. To fully understand and use this panel you need
|
||||
understand what Histograms are and how they are created. Read on below to for a quick introduction to the
|
||||
term Histogram.
|
||||
|
||||
## Histograms and buckets
|
||||
|
||||
A histogram is a graphical representation of the distribution of numerical data. You group values into buckets
|
||||
(some times also called bins) and then count how many values fall into each bucket. Instead
|
||||
of graphing the actual values you then graph the buckets. Each bar represents a bucket
|
||||
and the bar height represents the frequency (i.e. count) of values that fell into that bucket's interval.
|
||||
|
||||
Example Histogram:
|
||||
|
||||

|
||||
|
||||
The above histogram shows us that most value distribution of a couple of time series. We can easily see that
|
||||
most values land between 240-300 with a peak between 260-280. Histograms just look at value distributions
|
||||
over specific time range. So you cannot see any trend or changes in the distribution over time,
|
||||
this is where heatmaps become useful.
|
||||
|
||||
## Heatmap
|
||||
|
||||
A Heatmap is like a histogram but over time where each time slice represents its own
|
||||
histogram. Instead of using bar height as a representation of frequency you use cells and color
|
||||
the cell proportional to the number of values in the bucket.
|
||||
|
||||
Example:
|
||||
|
||||

|
||||
|
||||
Here we can clearly see what values are more common and how they trend over time.
|
||||
|
||||
## Data Options
|
||||
|
||||
Data and bucket options can be found in the `Axes` tab.
|
||||
|
||||
### Data Formats
|
||||
|
||||
Data format | Description
|
||||
------------ | -------------
|
||||
*Time series* | Grafana does the bucketing by going through all time series values. The bucket sizes & intervals will be determined using the Buckets options.
|
||||
*Time series buckets* | Each time series already represents a Y-Axis bucket. The time series name (alias) needs to be a numeric value representing the upper interval for the bucket. Grafana does no bucketing so the bucket size options are hidden.
|
||||
|
||||
### Bucket Size
|
||||
|
||||
The Bucket count & size options are used by Grafana to calculate how big each cell in the heatmap is. You can
|
||||
define the bucket size either by count (the first input box) or by specifying a size interval. For the Y-Axis
|
||||
the size interval is just a value but for the X-bucket you can specify a time range in the *Size* input, for example,
|
||||
the time range `1h`. This will make the cells 1h wide on the X-axis.
|
||||
|
||||
### Pre-bucketed data
|
||||
|
||||
If you have a data that is already organized into buckets you can use the `Time series buckets` data format. This format requires that your metric query return regular time series and that each time series has a numeric name
|
||||
that represent the upper or lower bound of the interval.
|
||||
|
||||
The only data source that supports histograms over time is Elasticsearch. You do this by adding a *Histogram*
|
||||
bucket aggregation before the *Date Histogram*.
|
||||
|
||||

|
||||
|
||||
You control the size of the buckets using the Histogram interval (Y-Axis) and the Date Histogram interval (X-axis).
|
||||
|
||||
## Display Options
|
||||
|
||||
In the heatmap *Display* tab you define how the cells are rendered and what color they are assigned.
|
||||
|
||||
### Color Mode & Spectrum
|
||||
|
||||
{{< imgbox max-width="40%" img="/img/docs/v43/heatmap_scheme.png" caption="Color spectrum" >}}
|
||||
|
||||
The color spectrum controls the mapping between value count (in each bucket) and the color assigned to each bucket.
|
||||
The left most color on the spectrum represents the minimum count and the color on the right most side represents the
|
||||
maximum count. Some color schemes are automatically inverted when using the light theme.
|
||||
|
||||
You can also change the color mode to `Opacity`. In this case, the color will not change but the amount of opacity will
|
||||
change with the bucket count.
|
||||
|
||||
## Raw data vs aggregated
|
||||
|
||||
If you use the heatmap with regular time series data (not pre-bucketed). Then it's important to keep in mind that your data
|
||||
is often already by aggregated by your time series backend. Most time series queries do not return raw sample data
|
||||
but include a group by time interval or maxDataPoints limit coupled with an aggregation function (usually average).
|
||||
|
||||
This all depends on the time range of your query of course. But the important point is to know that the Histogram bucketing
|
||||
that Grafana performs may be done on already aggregated and averaged data. To get more accurate heatmaps it is better
|
||||
to do the bucketing during metric collection or store the data in Elasticsearch, which currently is the only data source
|
||||
data supports doing Histogram bucketing on the raw data.
|
||||
|
||||
If you remove or lower the group by time (or raise maxDataPoints) in your query to return more data points your heatmap will be
|
||||
more accurate but this can also be very CPU & Memory taxing for your browser and could cause hangs and crashes if the number of
|
||||
data points becomes unreasonably large.
|
||||
@@ -2,6 +2,7 @@
|
||||
title = "Singlestat Panel"
|
||||
keywords = ["grafana", "dashboard", "documentation", "panels", "singlestat"]
|
||||
type = "docs"
|
||||
aliases = ["/reference/singlestat/"]
|
||||
[menu.docs]
|
||||
name = "Singlestat"
|
||||
parent = "panels"
|
||||
@@ -26,13 +27,14 @@ The singlestat panel has a normal query editor to allow you define your exact me
|
||||
3. `Values`: The Value fields let you set the function (min, max, average, current, total, first, delta, range) that your entire query is reduced into a single value with. You can also set the font size of the Value field and font-size (as a %) of the metric query that the Panel is configured with. This reduces the entire query into a single summary value that is displayed.
|
||||
* `min` - The smallest value in the series
|
||||
* `max` - The largest value in the series
|
||||
* `average` - The average of all the non-null values in the series
|
||||
* `avg` - The average of all the non-null values in the series
|
||||
* `current` - The last value in the series. If the series ends on null the previous value will be used.
|
||||
* `total` - The sum of all the non-null values in the series
|
||||
* `first` - The first value in the series
|
||||
* `delta` - The total incremental increase (of a counter) in the series. An attempt is made to account for counter resets, but this will only be accurate for single instance metrics. Used to show total counter increase in time series.
|
||||
* `diff` - The difference betwen 'current' (last value) and 'first'.
|
||||
* `range` - The difference between 'min' and 'max'. Useful the show the range of change for a gauge.
|
||||
4. `Postfixes`: The Postfix fields let you define a custom label and font-size (as a %) to appear *after* the value
|
||||
4. `Prefix/Postfix`: The Prefix/Postfix fields let you define a custom label and font-size (as a %) to appear *before/after* the value. The `$__name` variable can be used here to use the series name or alias from the metric query.
|
||||
5. `Units`: Units are appended to the the Singlestat within the panel, and will respect the color and threshold settings for the value.
|
||||
6. `Decimals`: The Decimal field allows you to override the automatic decimal precision, and set it explicitly.
|
||||
|
||||
@@ -2,6 +2,7 @@
|
||||
title = "Table Panel"
|
||||
keywords = ["grafana", "dashboard", "documentation", "panels", "table panel"]
|
||||
type = "docs"
|
||||
aliases = ["/reference/table/"]
|
||||
[menu.docs]
|
||||
name = "Table"
|
||||
parent = "panels"
|
||||
@@ -11,7 +12,7 @@ weight = 2
|
||||
|
||||
# Table Panel
|
||||
|
||||
<img src="/assets/img/features/table-panel.png">
|
||||
<img class="screenshot" src="/assets/img/features/table-panel.png">
|
||||
|
||||
The new table panel is very flexible, supporting both multiple modes for time series as well as for
|
||||
table, annotation and raw JSON data. It also provides date formatting and value formatting and coloring options.
|
||||
@@ -21,55 +22,63 @@ To view table panels in action and test different configurations with sample dat
|
||||
## Options overview
|
||||
|
||||
The table panel has many ways to manipulate your data for optimal presentation.
|
||||
{{< docs-imagebox img="/img/docs/v45/table_options.png" class="docs-image--no-shadow" max-width= "500px" >}}
|
||||
|
||||
<img class="no-shadow" src="/img/docs/v2/table-config2.png">
|
||||
|
||||
1. `Data`: Control how your query is transformed into a table.
|
||||
2. `Table Display`: Table display options.
|
||||
3. `Column Styles`: Column value formatting and display options.
|
||||
2. `Paging`: Table display options.
|
||||
|
||||
|
||||
## Data to Table
|
||||
|
||||
<img class="no-shadow" src="/img/docs/v2/table-data-options.png">
|
||||
{{< docs-imagebox img="/img/docs/v45/table_data_options.png" max-width="500px" class="docs-image--right">}}
|
||||
|
||||
The data section contains the **To Table Transform (1)**. This is the primary option for how your data/metric
|
||||
query should be transformed into a table format. The **Columns (2)** option allows you to select what columns
|
||||
you want in the table. Only applicable for some transforms.
|
||||
|
||||
<div class="clearfix"></div>
|
||||
|
||||
### Time series to rows
|
||||
|
||||
<img src="/img/docs/v2/table_ts_to_rows2.png">
|
||||
{{< docs-imagebox img="/img/docs/v45/table_ts_to_rows.png" >}}
|
||||
|
||||
In the most simple mode you can turn time series to rows. This means you get a `Time`, `Metric` and a `Value` column. Where `Metric` is the name of the time series.
|
||||
|
||||
### Time series to columns
|
||||
|
||||

|
||||
{{< docs-imagebox img="/img/docs/v45/table_ts_to_columns.png" >}}
|
||||
|
||||
|
||||
This transform allows you to take multiple time series and group them by time. Which will result in the primary column being `Time` and a column for each time series.
|
||||
|
||||
### Time series aggregations
|
||||
|
||||

|
||||
{{< docs-imagebox img="/img/docs/v45/table_ts_to_aggregations.png" >}}
|
||||
|
||||
This table transformation will lay out your table into rows by metric, allowing columns of `Avg`, `Min`, `Max`, `Total`, `Current` and `Count`. More than one column can be added.
|
||||
|
||||
### Annotations
|
||||

|
||||
|
||||
{{< docs-imagebox img="/img/docs/v45/table_annotations.png" >}}
|
||||
|
||||
|
||||
If you have annotations enabled in the dashboard you can have the table show them. If you configure this
|
||||
mode then any queries you have in the metrics tab will be ignored.
|
||||
|
||||
### JSON Data
|
||||

|
||||
|
||||
{{< docs-imagebox img="/img/docs/v45/table_json_data.png" max-width="500px" >}}
|
||||
|
||||
If you have an Elasticsearch **Raw Document** query or an Elasticsearch query without a `date histogram` use this
|
||||
transform mode and pick the columns using the **Columns** section.
|
||||
|
||||

|
||||
|
||||
{{< docs-imagebox img="/img/docs/v45/elastic_raw_doc.png" >}}
|
||||
|
||||
## Table Display
|
||||
|
||||
<img class="no-shadow" src="/img/docs/v2/table-display.png">
|
||||
{{< docs-imagebox img="/img/docs/v45/table_paging.png" class="docs-image--no-shadow docs-image--right" max-width="350px" >}}
|
||||
|
||||
1. `Pagination (Page Size)`: The table display fields allow you to control The `Pagination` (page size) is the threshold at which the table rows will be broken into pages. For example, if your table had 95 records with a pagination value of 10, your table would be split across 9 pages.
|
||||
2. `Scroll`: The `scroll bar` checkbox toggles the ability to scroll within the panel, when unchecked, the panel height will grow to display all rows.
|
||||
@@ -80,12 +89,11 @@ transform mode and pick the columns using the **Columns** section.
|
||||
|
||||
The column styles allow you control how dates and numbers are formatted.
|
||||
|
||||
<img class="no-shadow" src="/img/docs/v2/Column-Options.png">
|
||||
{{< docs-imagebox img="/img/docs/v45/table_column_styles.png" class="docs-image--no-shadow" >}}
|
||||
|
||||
1. `Name or regex`: The Name or Regex field controls what columns the rule should be applied to. The regex or name filter will be matched against the column name not against column values.
|
||||
2. `Type`: The three supported types of types are `Number`, `String` and `Date`.
|
||||
3. `Format`: Specify date format. Only available when `Type` is set to `Date`.
|
||||
4. `Coloring` and `Thresholds`: Specify color mode and thresholds limits.
|
||||
5. `Unit` and `Decimals`: Specify unit and decimal precision for numbers.
|
||||
6. `Add column style rule`: Add new column rule.
|
||||
2. `Column Header`: Title for the column, when using a Regex the title can include replacement strings like `$1`.
|
||||
3. `Add column style rule`: Add new column rule.
|
||||
4. `Thresholds` and `Coloring`: Specify color mode and thresholds limits.
|
||||
5. `Type`: The three supported types of types are `Number`, `String` and `Date`. `Unit` and `Decimals`: Specify unit and decimal precision for numbers.`Format`: Specify date format for dates.
|
||||
|
||||
Some files were not shown because too many files have changed in this diff Show More
Reference in New Issue
Block a user