mirror of
https://github.com/grafana/grafana.git
synced 2026-01-07 01:44:00 +08:00
Compare commits
64 Commits
v6.1.0-bet
...
v5.4.5
| Author | SHA1 | Date | |
|---|---|---|---|
|
|
091fd2c8d5 | ||
|
|
ebc257ad47 | ||
|
|
986f6689de | ||
|
|
e69aead0fe | ||
|
|
653918056c | ||
|
|
194153aa62 | ||
|
|
c0400f32ad | ||
|
|
aaac7cc556 | ||
|
|
c2e708042c | ||
|
|
17f4a03d6f | ||
|
|
5743ceaa93 | ||
|
|
0f3a938f0b | ||
|
|
4796ec8cd4 | ||
|
|
a304e5b600 | ||
|
|
54b725b91b | ||
|
|
ca88aedbdd | ||
|
|
566c7b17ad | ||
|
|
d812109ebf | ||
|
|
f44a006cb9 | ||
|
|
43c0405ae1 | ||
|
|
ed05e9de72 | ||
|
|
e43f13bc03 | ||
|
|
308c818cd7 | ||
|
|
d49d8bf13d | ||
|
|
3701f22d66 | ||
|
|
4c60ef398a | ||
|
|
ec98666de1 | ||
|
|
7fe10e2eef | ||
|
|
4a8cd4c023 | ||
|
|
174be1abab | ||
|
|
4c13e02aef | ||
|
|
4a8a3d40e7 | ||
|
|
01c4b71cfb | ||
|
|
e7cd39a543 | ||
|
|
6f241a4bac | ||
|
|
0a19581c48 | ||
|
|
96cb4df83a | ||
|
|
7820775a53 | ||
|
|
9699133501 | ||
|
|
80ecd8ea8e | ||
|
|
2ab2259091 | ||
|
|
deb305b95f | ||
|
|
d42c17efad | ||
|
|
972aaef2a6 | ||
|
|
ce3982d406 | ||
|
|
69c5191926 | ||
|
|
99ee3bbe5a | ||
|
|
01840cbd70 | ||
|
|
23b19543bd | ||
|
|
bb4e5934fb | ||
|
|
fd3821d2f1 | ||
|
|
8b1d0b14b6 | ||
|
|
23c6bea21b | ||
|
|
e3abefa19f | ||
|
|
4ee92bd59c | ||
|
|
780e5153d0 | ||
|
|
be9058d7ef | ||
|
|
3301f96811 | ||
|
|
1c59669da0 | ||
|
|
1ad60be47b | ||
|
|
9ec0af73ec | ||
|
|
8190d10827 | ||
|
|
18b5f630f7 | ||
|
|
9df26af3db |
11
.babelrc
11
.babelrc
@@ -1,11 +0,0 @@
|
||||
{
|
||||
"presets": [
|
||||
[
|
||||
"@babel/preset-env",
|
||||
{
|
||||
"targets": { "browsers": "last 3 versions" },
|
||||
"useBuiltIns": "entry"
|
||||
}
|
||||
]
|
||||
]
|
||||
}
|
||||
@@ -19,7 +19,7 @@ version: 2
|
||||
jobs:
|
||||
mysql-integration-test:
|
||||
docker:
|
||||
- image: circleci/golang:1.11.5
|
||||
- image: circleci/golang:1.11.4
|
||||
- image: circleci/mysql:5.6-ram
|
||||
environment:
|
||||
MYSQL_ROOT_PASSWORD: rootpass
|
||||
@@ -35,11 +35,11 @@ jobs:
|
||||
- run: cat devenv/docker/blocks/mysql_tests/setup.sql | mysql -h 127.0.0.1 -P 3306 -u root -prootpass
|
||||
- run:
|
||||
name: mysql integration tests
|
||||
command: './scripts/circle-test-mysql.sh'
|
||||
command: 'GRAFANA_TEST_DB=mysql go test ./pkg/services/sqlstore/... ./pkg/tsdb/mysql/... '
|
||||
|
||||
postgres-integration-test:
|
||||
docker:
|
||||
- image: circleci/golang:1.11.5
|
||||
- image: circleci/golang:1.11.4
|
||||
- image: circleci/postgres:9.3-ram
|
||||
environment:
|
||||
POSTGRES_USER: grafanatest
|
||||
@@ -54,21 +54,7 @@ jobs:
|
||||
- run: 'PGPASSWORD=grafanatest psql -p 5432 -h 127.0.0.1 -U grafanatest -d grafanatest -f devenv/docker/blocks/postgres_tests/setup.sql'
|
||||
- run:
|
||||
name: postgres integration tests
|
||||
command: './scripts/circle-test-postgres.sh'
|
||||
|
||||
cache-server-test:
|
||||
docker:
|
||||
- image: circleci/golang:1.11.5
|
||||
- image: circleci/redis:4-alpine
|
||||
- image: memcached
|
||||
working_directory: /go/src/github.com/grafana/grafana
|
||||
steps:
|
||||
- checkout
|
||||
- run: dockerize -wait tcp://127.0.0.1:11211 -timeout 120s
|
||||
- run: dockerize -wait tcp://127.0.0.1:6379 -timeout 120s
|
||||
- run:
|
||||
name: cache server tests
|
||||
command: './scripts/circle-test-cache-servers.sh'
|
||||
command: 'GRAFANA_TEST_DB=postgres go test ./pkg/services/sqlstore/... ./pkg/tsdb/postgres/...'
|
||||
|
||||
codespell:
|
||||
docker:
|
||||
@@ -88,16 +74,24 @@ jobs:
|
||||
|
||||
gometalinter:
|
||||
docker:
|
||||
- image: circleci/golang:1.11.5
|
||||
- image: circleci/golang:1.11.4
|
||||
environment:
|
||||
# we need CGO because of go-sqlite3
|
||||
CGO_ENABLED: 1
|
||||
working_directory: /go/src/github.com/grafana/grafana
|
||||
steps:
|
||||
- checkout
|
||||
- run: 'go get -u github.com/alecthomas/gometalinter'
|
||||
- run: 'go get -u github.com/tsenart/deadcode'
|
||||
- run: 'go get -u github.com/jgautheron/goconst/cmd/goconst'
|
||||
- run: 'go get -u github.com/gordonklaus/ineffassign'
|
||||
- run: 'go get -u honnef.co/go/tools/cmd/megacheck'
|
||||
- run: 'go get -u github.com/opennota/check/cmd/structcheck'
|
||||
- run: 'go get -u github.com/mdempsky/unconvert'
|
||||
- run: 'go get -u github.com/opennota/check/cmd/varcheck'
|
||||
- run:
|
||||
name: Gometalinter tests
|
||||
command: './scripts/gometalinter.sh'
|
||||
name: run go vet
|
||||
command: 'go vet ./pkg/...'
|
||||
|
||||
test-frontend:
|
||||
docker:
|
||||
@@ -120,7 +114,7 @@ jobs:
|
||||
|
||||
test-backend:
|
||||
docker:
|
||||
- image: circleci/golang:1.11.5
|
||||
- image: circleci/golang:1.11.4
|
||||
working_directory: /go/src/github.com/grafana/grafana
|
||||
steps:
|
||||
- checkout
|
||||
@@ -130,7 +124,7 @@ jobs:
|
||||
|
||||
build-all:
|
||||
docker:
|
||||
- image: grafana/build-container:1.2.4
|
||||
- image: grafana/build-container:1.2.2
|
||||
working_directory: /go/src/github.com/grafana/grafana
|
||||
steps:
|
||||
- checkout
|
||||
@@ -161,20 +155,24 @@ jobs:
|
||||
- run:
|
||||
name: sha-sum packages
|
||||
command: 'go run build.go sha-dist'
|
||||
- run:
|
||||
name: Build Grafana.com master publisher
|
||||
command: 'go build -o scripts/publish scripts/build/publish.go'
|
||||
- run:
|
||||
name: Test and build Grafana.com release publisher
|
||||
command: 'cd scripts/build/release_publisher && go test . && go build -o release_publisher .'
|
||||
- persist_to_workspace:
|
||||
root: .
|
||||
paths:
|
||||
- dist/*
|
||||
- dist/grafana*
|
||||
- scripts/*.sh
|
||||
- scripts/publish
|
||||
- scripts/build/release_publisher/release_publisher
|
||||
- scripts/build/publish.sh
|
||||
|
||||
build:
|
||||
docker:
|
||||
- image: grafana/build-container:1.2.4
|
||||
- image: grafana/build-container:1.2.2
|
||||
working_directory: /go/src/github.com/grafana/grafana
|
||||
steps:
|
||||
- checkout
|
||||
@@ -196,7 +194,7 @@ jobs:
|
||||
- persist_to_workspace:
|
||||
root: .
|
||||
paths:
|
||||
- dist/*
|
||||
- dist/grafana*
|
||||
|
||||
grafana-docker-master:
|
||||
machine:
|
||||
@@ -243,7 +241,7 @@ jobs:
|
||||
|
||||
build-enterprise:
|
||||
docker:
|
||||
- image: grafana/build-container:1.2.4
|
||||
- image: grafana/build-container:1.2.2
|
||||
working_directory: /go/src/github.com/grafana/grafana
|
||||
steps:
|
||||
- checkout
|
||||
@@ -271,11 +269,11 @@ jobs:
|
||||
- persist_to_workspace:
|
||||
root: .
|
||||
paths:
|
||||
- enterprise-dist/*
|
||||
- enterprise-dist/grafana-enterprise*
|
||||
|
||||
build-all-enterprise:
|
||||
docker:
|
||||
- image: grafana/build-container:1.2.4
|
||||
- image: grafana/build-container:1.2.2
|
||||
working_directory: /go/src/github.com/grafana/grafana
|
||||
steps:
|
||||
- checkout
|
||||
@@ -318,11 +316,11 @@ jobs:
|
||||
- persist_to_workspace:
|
||||
root: .
|
||||
paths:
|
||||
- enterprise-dist/*
|
||||
- enterprise-dist/grafana-enterprise*
|
||||
|
||||
deploy-enterprise-master:
|
||||
docker:
|
||||
- image: grafana/grafana-ci-deploy:1.2.1
|
||||
- image: grafana/grafana-ci-deploy:1.1.0
|
||||
steps:
|
||||
- attach_workspace:
|
||||
at: .
|
||||
@@ -340,16 +338,13 @@ jobs:
|
||||
command: '/opt/google-cloud-sdk/bin/gsutil cp ./enterprise-dist/* gs://$GCP_BUCKET_NAME/enterprise/master'
|
||||
- run:
|
||||
name: Deploy to grafana.com
|
||||
command: |
|
||||
cd enterprise-dist
|
||||
../scripts/build/release_publisher/release_publisher -apikey ${GRAFANA_COM_API_KEY} -enterprise -version "v$(cat grafana.version)" --nightly
|
||||
command: 'cd enterprise-dist && ../scripts/build/release_publisher/release_publisher -apikey ${GRAFANA_COM_API_KEY} -enterprise -from-local'
|
||||
|
||||
|
||||
deploy-enterprise-release:
|
||||
docker:
|
||||
- image: grafana/grafana-ci-deploy:1.2.1
|
||||
- image: grafana/grafana-ci-deploy:1.1.0
|
||||
steps:
|
||||
- checkout
|
||||
- attach_workspace:
|
||||
at: .
|
||||
- run:
|
||||
@@ -369,18 +364,18 @@ jobs:
|
||||
command: './scripts/build/publish.sh --enterprise'
|
||||
- run:
|
||||
name: Load GPG private key
|
||||
command: './scripts/build/load-signing-key.sh'
|
||||
comand: './scripts/build/load-signing-key.sh'
|
||||
- run:
|
||||
name: Update Debian repository
|
||||
command: './scripts/build/update_repo/update-deb.sh "enterprise" "$GPG_KEY_PASSWORD" "$CIRCLE_TAG" "enterprise-dist"'
|
||||
command: './scripts/build/update_repo/update-deb.sh "enterprise" "$GPG_KEY_PASSWORD" "$CIRCLE_TAG"'
|
||||
- run:
|
||||
name: Update RPM repository
|
||||
command: './scripts/build/update_repo/update-rpm.sh "enterprise" "$GPG_KEY_PASSWORD" "$CIRCLE_TAG" "enterprise-dist"'
|
||||
command: './scripts/build/update_repo/update-rpm.sh "enterprise" "$GPG_KEY_PASSWORD" "$CIRCLE_TAG"'
|
||||
|
||||
|
||||
deploy-master:
|
||||
docker:
|
||||
- image: grafana/grafana-ci-deploy:1.2.1
|
||||
- image: grafana/grafana-ci-deploy:1.1.0
|
||||
steps:
|
||||
- attach_workspace:
|
||||
at: .
|
||||
@@ -406,12 +401,11 @@ jobs:
|
||||
name: Publish to Grafana.com
|
||||
command: |
|
||||
rm dist/grafana-master-$(echo "${CIRCLE_SHA1}" | cut -b1-7).linux-x64.tar.gz
|
||||
rm dist/*latest*
|
||||
cd dist && ../scripts/build/release_publisher/release_publisher -apikey ${GRAFANA_COM_API_KEY} -version "v$(cat grafana.version)" --nightly
|
||||
./scripts/publish -apiKey ${GRAFANA_COM_API_KEY}
|
||||
|
||||
deploy-release:
|
||||
docker:
|
||||
- image: grafana/grafana-ci-deploy:1.2.1
|
||||
- image: grafana/grafana-ci-deploy:1.1.0
|
||||
steps:
|
||||
- checkout
|
||||
- attach_workspace:
|
||||
@@ -436,19 +430,10 @@ jobs:
|
||||
command: './scripts/build/load-signing-key.sh'
|
||||
- run:
|
||||
name: Update Debian repository
|
||||
command: './scripts/build/update_repo/update-deb.sh "oss" "$GPG_KEY_PASSWORD" "$CIRCLE_TAG" "dist"'
|
||||
command: './scripts/build/update_repo/update-deb.sh "oss" "$GPG_KEY_PASSWORD" "$CIRCLE_TAG"'
|
||||
- run:
|
||||
name: Update RPM repository
|
||||
command: './scripts/build/update_repo/update-rpm.sh "oss" "$GPG_KEY_PASSWORD" "$CIRCLE_TAG" "dist"'
|
||||
|
||||
store-build-artifacts:
|
||||
docker:
|
||||
- image: circleci/node:8
|
||||
steps:
|
||||
- attach_workspace:
|
||||
at: .
|
||||
- store_artifacts:
|
||||
path: ./dist
|
||||
command: './scripts/build/update_repo/update-rpm.sh "oss" "$GPG_KEY_PASSWORD" "$CIRCLE_TAG"'
|
||||
|
||||
workflows:
|
||||
version: 2
|
||||
@@ -570,8 +555,6 @@ workflows:
|
||||
filters: *filter-not-release-or-master
|
||||
- postgres-integration-test:
|
||||
filters: *filter-not-release-or-master
|
||||
- cache-server-test:
|
||||
filters: *filter-not-release-or-master
|
||||
- grafana-docker-pr:
|
||||
requires:
|
||||
- build
|
||||
@@ -581,16 +564,4 @@ workflows:
|
||||
- gometalinter
|
||||
- mysql-integration-test
|
||||
- postgres-integration-test
|
||||
- cache-server-test
|
||||
filters: *filter-not-release-or-master
|
||||
- store-build-artifacts:
|
||||
requires:
|
||||
- build
|
||||
- test-backend
|
||||
- test-frontend
|
||||
- codespell
|
||||
- gometalinter
|
||||
- mysql-integration-test
|
||||
- postgres-integration-test
|
||||
- cache-server-test
|
||||
filters: *filter-not-release-or-master
|
||||
|
||||
16
.github/ISSUE_TEMPLATE.md
vendored
Normal file
16
.github/ISSUE_TEMPLATE.md
vendored
Normal file
@@ -0,0 +1,16 @@
|
||||
Read before posting:
|
||||
|
||||
- Questions should be posted to https://community.grafana.com. Please search there and here on GitHub for similar issues before creating a new issue.
|
||||
- Checkout FAQ: https://community.grafana.com/c/howto/faq
|
||||
- Checkout How to troubleshoot metric query issues: https://community.grafana.com/t/how-to-troubleshoot-metric-query-issues/50
|
||||
|
||||
Please include this information:
|
||||
### What Grafana version are you using?
|
||||
### What datasource are you using?
|
||||
### What OS are you running grafana on?
|
||||
### What did you do?
|
||||
### What was the expected result?
|
||||
### What happened instead?
|
||||
### If related to metric query / data viz:
|
||||
### Include raw network request & response: get by opening Chrome Dev Tools (F12, Ctrl+Shift+I on windows, Cmd+Opt+I on Mac), go the network tab.
|
||||
|
||||
27
.github/ISSUE_TEMPLATE/1-bug_report.md
vendored
27
.github/ISSUE_TEMPLATE/1-bug_report.md
vendored
@@ -1,27 +0,0 @@
|
||||
---
|
||||
name: Bug report
|
||||
about: Report a bug you found when using Grafana
|
||||
labels: 'type: bug'
|
||||
---
|
||||
|
||||
<!--
|
||||
Please use this template while reporting a bug and provide as much info as possible.
|
||||
Questions should be posted to https://community.grafana.com
|
||||
Use query inspector to troubleshoot issues: https://community.grafana.com/t/using-grafanas-query-inspector-to-troubleshoot-issues/2630
|
||||
-->
|
||||
|
||||
**What happened**:
|
||||
|
||||
**What you expected to happen**:
|
||||
|
||||
**How to reproduce it (as minimally and precisely as possible)**:
|
||||
|
||||
**Anything else we need to know?**:
|
||||
|
||||
**Environment**:
|
||||
- Grafana version:
|
||||
- Data source type & version:
|
||||
- OS Grafana is installed on:
|
||||
- User OS & Browser:
|
||||
- Grafana plugins:
|
||||
- Others:
|
||||
11
.github/ISSUE_TEMPLATE/2-feature_request.md
vendored
11
.github/ISSUE_TEMPLATE/2-feature_request.md
vendored
@@ -1,11 +0,0 @@
|
||||
---
|
||||
name: Enhancement request
|
||||
about: Suggest an enhancement or new feature for the Grafana project
|
||||
labels: 'type: feature request'
|
||||
---
|
||||
|
||||
<!-- Please only use this template for submitting feature requests -->
|
||||
|
||||
**What would you like to be added**:
|
||||
|
||||
**Why is this needed**:
|
||||
26
.github/ISSUE_TEMPLATE/3-accessibility.md
vendored
26
.github/ISSUE_TEMPLATE/3-accessibility.md
vendored
@@ -1,26 +0,0 @@
|
||||
---
|
||||
name: Accessibility issue
|
||||
about: Help make Grafana be better at keyboard navigation, screen-readable and accessible to all.
|
||||
labels: 'type: accessibility'
|
||||
---
|
||||
|
||||
<!--
|
||||
Please only use this template for submitting accessibility issues.
|
||||
|
||||
This is a new feature area for Grafana that we want to improve. We have long way to go
|
||||
to really improve accessibility and would like your help to know where to start.
|
||||
-->
|
||||
|
||||
**Steps to reproduce**:
|
||||
|
||||
**Actual Result**:
|
||||
|
||||
**Expected Result**
|
||||
|
||||
**Relevant WCAG Criteria:** [#.#.# WCAG Criterion](link to https://www.w3.org/WAI/WCAG21/quickref/?versions=2.0)
|
||||
|
||||
**Environment**:
|
||||
- Grafana version:
|
||||
- Data source type & version:
|
||||
- User OS & Browser:
|
||||
- Others:
|
||||
14
.github/ISSUE_TEMPLATE/4-question.md
vendored
14
.github/ISSUE_TEMPLATE/4-question.md
vendored
@@ -1,14 +0,0 @@
|
||||
---
|
||||
name: Support request
|
||||
about: 'Question or support request relating to using Grafana'
|
||||
title: ''
|
||||
labels: ''
|
||||
assignees: ''
|
||||
---
|
||||
|
||||
STOP -- PLEASE READ!
|
||||
|
||||
GitHub is not the right place for questions and support requests.
|
||||
|
||||
Please ask questions on our community site: [https://community.grafana.com/](https://community.grafana.com/)
|
||||
|
||||
29
.github/PULL_REQUEST_TEMPLATE.md
vendored
29
.github/PULL_REQUEST_TEMPLATE.md
vendored
@@ -1,27 +1,4 @@
|
||||
<!-- Thanks for sending a pull request! Here are some tips for you:
|
||||
* Link the PR to an issue for new features
|
||||
* Rebase your PR if it gets out of sync with master
|
||||
|
||||
1. If this is your first time, please read our [`CONTRIBUTING.md`](https://github.com/grafana/grafana/blob/master/CONTRIBUTING.md) guide.
|
||||
2. Ensure you have added or ran the appropriate tests for your PR.
|
||||
3. If it's a new feature or config option it will need a docs update. Docs are under the docs folder in repo root.
|
||||
4. If the PR is unfinished, mark it as a draft PR.
|
||||
5. Rebase your PR if it gets out of sync with master
|
||||
-->
|
||||
|
||||
**What this PR does / why we need it**:
|
||||
|
||||
**Which issue(s) this PR fixes**:
|
||||
<!--
|
||||
*Automatically closes linked issue when PR is merged.
|
||||
Usage: `Fixes #<issue number>`, or `Fixes (paste link of issue)`.
|
||||
-->
|
||||
Fixes #
|
||||
|
||||
**Special notes for your reviewer**:
|
||||
|
||||
**Release note**:
|
||||
<!--
|
||||
If this is a user facing change and should be mentioned in release note add it below. If no, just write "NONE" below.
|
||||
-->
|
||||
```release-note
|
||||
|
||||
```
|
||||
**REMOVE THE TEXT ABOVE BEFORE CREATING THE PULL REQUEST**
|
||||
|
||||
8
.gitignore
vendored
8
.gitignore
vendored
@@ -46,7 +46,6 @@ devenv/docker-compose.yaml
|
||||
/conf/provisioning/**/custom.yaml
|
||||
/conf/provisioning/**/dev.yaml
|
||||
/conf/ldap_dev.toml
|
||||
/conf/ldap_freeipa.toml
|
||||
profile.cov
|
||||
/grafana
|
||||
/local
|
||||
@@ -77,10 +76,3 @@ debug.test
|
||||
/devenv/bulk_alerting_dashboards/*.json
|
||||
|
||||
/scripts/build/release_publisher/release_publisher
|
||||
*.patch
|
||||
|
||||
|
||||
# Ignoring frontend packages specifics
|
||||
/packages/**/dist
|
||||
/packages/**/compiled
|
||||
/packages/**/.rpt2_cache
|
||||
|
||||
@@ -1,9 +0,0 @@
|
||||
.git
|
||||
.github
|
||||
dist/
|
||||
pkg/
|
||||
node_modules
|
||||
public/vendor/
|
||||
vendor/
|
||||
data/
|
||||
|
||||
273
CHANGELOG.md
273
CHANGELOG.md
@@ -1,255 +1,4 @@
|
||||
# 6.1.0 (unreleased)
|
||||
|
||||
# 6.1.0-beta1 (unreleased)
|
||||
|
||||
### New Features
|
||||
* **Prometheus**: adhoc filter support [#8253](https://github.com/grafana/grafana/issues/8253), thx [@mtanda](https://github.com/mtanda)
|
||||
* **Permissions**: Editors can become admin for dashboards, folders and teams they create. [#15977](https://github.com/grafana/grafana/pull/15977), [@xlson](https://github.com/xlson)
|
||||
|
||||
### Minor
|
||||
|
||||
* **Auth**: Support listing and revoking auth tokens via API [#15836](https://github.com/grafana/grafana/issues/15836)
|
||||
* **Alerting**: DingDing notification channel now includes alert values. [#13825](https://github.com/grafana/grafana/pull/13825), [@athurg](https://github.com/athurg)
|
||||
* **Alerting**: Notification channel http api enhancements. [#16219](https://github.com/grafana/grafana/pull/16219), [@marefr](https://github.com/marefr)
|
||||
* **CloudWatch**: Update metrics/dimensions list. [#16137](https://github.com/grafana/grafana/pull/16137), [@mtanda](https://github.com/mtanda)
|
||||
* **Cloudwatch**: Add AWS RDS MaximumUsedTransactionIDs metric [#15077](https://github.com/grafana/grafana/pull/15077), thx [@activeshadow](https://github.com/activeshadow)
|
||||
* **Cache**: Adds support for using out of proc caching in the backend [#10816](https://github.com/grafana/grafana/issues/10816)
|
||||
* **Dashboard**: New keyboard shortcut `d l` toggles all Graph legends in a dashboard. [#15770](https://github.com/grafana/grafana/pull/15770), [@jsferrei](https://github.com/jsferrei)
|
||||
* **Datasource**: Only log connection string in dev environment [#16001](https://github.com/grafana/grafana/issues/16001)
|
||||
* **DataProxy**: Add custom header (X-Grafana-User) to data source requests with the current username. [#15998](https://github.com/grafana/grafana/pull/15998), [@aocenas](https://github.com/aocenas)
|
||||
* **DataProxy**: Make it possible to add user details to requests sent to the dataproxy [#6359](https://github.com/grafana/grafana/issues/6359) and [#15931](https://github.com/grafana/grafana/issues/15931)
|
||||
* **DataProxy**: Adds oauth pass-through option for datasources. [#15205](https://github.com/grafana/grafana/pull/15205), [@seanlaff](https://github.com/seanlaff)
|
||||
* **Explore**: Hide empty duplicates column in logs viewer. [#15982](https://github.com/grafana/grafana/pull/15982), [@steven-sheehy](https://github.com/steven-sheehy)
|
||||
* **Explore**: Make it possible to close left pane of split view. [#16155](https://github.com/grafana/grafana/pull/16155), [@dprokop](https://github.com/dprokop)
|
||||
* **Explore**: Move back / forward with browser buttons now works. [#16150](https://github.com/grafana/grafana/pull/16150), [@hugohaggmark](https://github.com/hugohaggmark)
|
||||
* **Explore**: Update Loki labels when label selector is opened. [#16131](https://github.com/grafana/grafana/pull/16131), [@dprokop](https://github.com/dprokop)
|
||||
* **Graph Panel**: New options for X-axis Min & Max (for histograms). [#14877](https://github.com/grafana/grafana/pull/14877), [@papagian](https://github.com/papagian)
|
||||
* **Heatmap**: You can now choose to hide buckets with zero value. [#15934](https://github.com/grafana/grafana/pull/15934), [@alexanderzobnin](https://github.com/alexanderzobnin)
|
||||
* **Heatmap**: `Middle` bucket bound option [#15683](https://github.com/grafana/grafana/issues/15683)
|
||||
* **Heatmap**: `Reverse order` option for changing order of buckets [#15683](https://github.com/grafana/grafana/issues/15683)
|
||||
* **Prometheus**: Change alignment of range queries to end before now and not in future. [#16110](https://github.com/grafana/grafana/pull/16110), [@davkal](https://github.com/davkal)
|
||||
* **Prometheus**: Dedup annotations events with same timestamp . [#16152](https://github.com/grafana/grafana/pull/16152), [@torkelo](https://github.com/torkelo)
|
||||
* **SQL**: Use default min interval of 1m for all SQL data sources. [#15799](https://github.com/grafana/grafana/pull/15799), [@marefr](https://github.com/marefr)
|
||||
* **TablePanel**: Column color style now works even after removing columns. [#16227](https://github.com/grafana/grafana/pull/16227), [@torkelo](https://github.com/torkelo)
|
||||
* **Templating**: Custom variable value now escapes all backslashes properly. [#15980](https://github.com/grafana/grafana/pull/15980), [@srid12](https://github.com/srid12)
|
||||
* **Templating**: Data source variable now supports multi-value for uses cases that involve repeating panels & rows. [#15914](https://github.com/grafana/grafana/pull/15914), [@torkelo](https://github.com/torkelo)
|
||||
* **VictorOps**: Adds more information to the victor ops notifiers [#15744](https://github.com/grafana/grafana/issues/15744), thx [@zhulongcheng](https://github.com/zhulongcheng)
|
||||
|
||||
### Bug Fixes
|
||||
* **Alerting**: Don't include non-existing image in MS Teams notifications. [#16116](https://github.com/grafana/grafana/pull/16116), [@SGI495](https://github.com/SGI495)
|
||||
* **Api**: Invalid org invite code [#10506](https://github.com/grafana/grafana/issues/10506)
|
||||
* **Annotations**: Fix for native annotations filtered by template variable with pipe. [#15515](https://github.com/grafana/grafana/pull/15515), [@marefr](https://github.com/marefr)
|
||||
* **Dashboard**: Fix for time regions spanning across midnight. [#16201](https://github.com/grafana/grafana/pull/16201), [@marefr](https://github.com/marefr)
|
||||
* **Datasource**: Handles nil jsondata field gracefully [#14239](https://github.com/grafana/grafana/issues/14239)
|
||||
* **Datasource**: Empty user/password was not updated when updating datasources [#15608](https://github.com/grafana/grafana/pull/15608), thx [@Maddin-619](https://github.com/Maddin-619)
|
||||
* **Elasticsearch**: Fixes using template variables in the alias field. [#16229](https://github.com/grafana/grafana/pull/16229), [@daniellee](https://github.com/daniellee)
|
||||
* **Elasticsearch**: Fix incorrect index pattern padding in alerting queries. [#15892](https://github.com/grafana/grafana/pull/15892), [@sandlis](https://github.com/sandlis)
|
||||
* **Explore**: Fix for Prometheus autocomplete not working in Firefox. [#16192](https://github.com/grafana/grafana/pull/16192), [@hugohaggmark](https://github.com/hugohaggmark)
|
||||
* **Explore**: Fix for url does not keep query after browser refresh. [#16189](https://github.com/grafana/grafana/pull/16189), [@hugohaggmark](https://github.com/hugohaggmark)
|
||||
* **Gauge**: Interpolate scoped variables in repeated gauges [#15739](https://github.com/grafana/grafana/issues/15739)
|
||||
* **Graphite**: Fixed issue with using series ref and series by tag. [#16111](https://github.com/grafana/grafana/pull/16111), [@torkelo](https://github.com/torkelo)
|
||||
* **Graphite**: Fixed variable quoting when variable value is nummeric. [#16149](https://github.com/grafana/grafana/pull/16149), [@torkelo](https://github.com/torkelo)
|
||||
* **Heatmap**: Fixes Y-axis tick labels being in wrong order for some Prometheus queries. [#15932](https://github.com/grafana/grafana/pull/15932), [@alexanderzobnin](https://github.com/alexanderzobnin)
|
||||
* **Heatmap**: Negative values are now displayed correctly in graph & legend. [#15953](https://github.com/grafana/grafana/pull/15953), [@alexanderzobnin](https://github.com/alexanderzobnin)
|
||||
* **Heatmap**: legend shows wrong colors for small values [#14019](https://github.com/grafana/grafana/issues/14019)
|
||||
* **InfluxDB**: Always close request body even for error status codes. [#16207](https://github.com/grafana/grafana/pull/16207), [@ramongtx](https://github.com/ramongtx)
|
||||
* **ManageDashboards**: Fix for checkboxes not appearing properly Firefox . [#15981](https://github.com/grafana/grafana/pull/15981), [@srid12](https://github.com/srid12)
|
||||
* **Playlist**: Leaving playlist now always stops playlist . [#15791](https://github.com/grafana/grafana/pull/15791), [@peterholmberg](https://github.com/peterholmberg)
|
||||
* **Prometheus**: fixes regex ad-hoc filters variables with wildcards. [#16234](https://github.com/grafana/grafana/pull/16234), [@daniellee](https://github.com/daniellee)
|
||||
* **TablePanel**: Column color style now works even after removing columns. [#16227](https://github.com/grafana/grafana/pull/16227), [@torkelo](https://github.com/torkelo)
|
||||
* **TablePanel**: Fix for white text on white background when value is null. [#16199](https://github.com/grafana/grafana/pull/16199), [@peterholmberg](https://github.com/peterholmberg)
|
||||
|
||||
# 6.0.2 (2019-03-19)
|
||||
|
||||
### Bug Fixes
|
||||
* **Alerting**: Fixed issue with AlertList panel links resulting in panel not found errors. [#15975](https://github.com/grafana/grafana/pull/15975), [@torkelo](https://github.com/torkelo)
|
||||
* **Dashboard**: Improved error handling when rendering dashboard panels. [#15970](https://github.com/grafana/grafana/pull/15970), [@torkelo](https://github.com/torkelo)
|
||||
* **LDAP**: Fix allow anonymous server bind for ldap search. [#15872](https://github.com/grafana/grafana/pull/15872), [@marefr](https://github.com/marefr)
|
||||
* **Discord**: Fix discord notifier so it doesn't crash when there are no image generated. [#15833](https://github.com/grafana/grafana/pull/15833), [@marefr](https://github.com/marefr)
|
||||
* **Panel Edit**: Prevent search in VizPicker from stealing focus. [#15802](https://github.com/grafana/grafana/pull/15802), [@peterholmberg](https://github.com/peterholmberg)
|
||||
* **Datasource admin**: Fixed url of back button in datasource edit page, when root_url configured. [#15759](https://github.com/grafana/grafana/pull/15759), [@dprokop](https://github.com/dprokop)
|
||||
|
||||
# 6.0.1 (2019-03-06)
|
||||
|
||||
### Bug Fixes
|
||||
* **Metrics**: Fixes broken usagestats metrics for /metrics [#15651](https://github.com/grafana/grafana/issues/15651)
|
||||
* **Dashboard**: Fixes kiosk mode should have &kiosk appended to the url [#15765](https://github.com/grafana/grafana/issues/15765)
|
||||
* **Dashboard**: Fixes kiosk=tv mode with autofitpanels should respect header [#15650](https://github.com/grafana/grafana/issues/15650)
|
||||
* **Image rendering**: Fixed image rendering issue for dashboards with auto refresh, . [#15818](https://github.com/grafana/grafana/pull/15818), [@torkelo](https://github.com/torkelo)
|
||||
* **Dashboard**: Fix only users that can edit a dashboard should be able to update panel json. [#15805](https://github.com/grafana/grafana/pull/15805), [@marefr](https://github.com/marefr)
|
||||
* **LDAP**: fix allow anonymous initial bind for ldap search. [#15803](https://github.com/grafana/grafana/pull/15803), [@marefr](https://github.com/marefr)
|
||||
* **UX**: Fixed scrollbar not visible initially (only after manual scroll). [#15798](https://github.com/grafana/grafana/pull/15798), [@torkelo](https://github.com/torkelo)
|
||||
* **Datasource admin** TestData [#15793](https://github.com/grafana/grafana/pull/15793), [@hugohaggmark](https://github.com/hugohaggmark)
|
||||
* **Dashboard**: Fixed scrolling issue that caused scroll to be locked to bottom. [#15792](https://github.com/grafana/grafana/pull/15792), [@torkelo](https://github.com/torkelo)
|
||||
* **Explore**: Viewers with viewers_can_edit should be able to access /explore. [#15787](https://github.com/grafana/grafana/pull/15787), [@jschill](https://github.com/jschill)
|
||||
* **Security** fix: limit access to org admin and alerting pages. [#15761](https://github.com/grafana/grafana/pull/15761), [@marefr](https://github.com/marefr)
|
||||
* **Panel Edit** minInterval changes did not persist [#15757](https://github.com/grafana/grafana/pull/15757), [@hugohaggmark](https://github.com/hugohaggmark)
|
||||
* **Teams**: Fixed bug when getting teams for user. [#15595](https://github.com/grafana/grafana/pull/15595), [@hugohaggmark](https://github.com/hugohaggmark)
|
||||
* **Stackdriver**: fix for float64 bounds for distribution metrics [#14509](https://github.com/grafana/grafana/issues/14509)
|
||||
* **Stackdriver**: no reducers available for distribution type [#15179](https://github.com/grafana/grafana/issues/15179)
|
||||
|
||||
# 6.0.0 stable (2019-02-25)
|
||||
|
||||
### Bug Fixes
|
||||
* **Dashboard**: fixes click after scroll in series override menu [#15621](https://github.com/grafana/grafana/issues/15621)
|
||||
* **MySQL**: fix mysql query using _interval_ms variable throws error [#14507](https://github.com/grafana/grafana/issues/14507)
|
||||
|
||||
# 6.0.0-beta3 (2019-02-19)
|
||||
|
||||
### Minor
|
||||
* **CLI**: Grafana CLI should preserve permissions for backend binaries for Linux and Darwin [#15500](https://github.com/grafana/grafana/issues/15500)
|
||||
* **Alerting**: Allow image rendering 90 percent of alertTimeout [#15395](https://github.com/grafana/grafana/pull/15395)
|
||||
|
||||
### Bug fixes
|
||||
* **Influxdb**: Add support for alerting on InfluxDB queries that use the non_negative_difference function [#15415](https://github.com/grafana/grafana/issues/15415), thx [@kiran3394](https://github.com/kiran3394)
|
||||
* **Alerting**: Fix percent_diff calculation when points are nulls [#15443](https://github.com/grafana/grafana/issues/15443), thx [@max-neverov](https://github.com/max-neverov)
|
||||
* **Alerting**: Fixed handling of alert urls with true flags [#15454](https://github.com/grafana/grafana/issues/15454)
|
||||
|
||||
# 6.0.0-beta2 (2019-02-11)
|
||||
|
||||
### New Features
|
||||
* **AzureMonitor**: Enable alerting by converting Azure Monitor API to Go [#14623](https://github.com/grafana/grafana/issues/14623)
|
||||
|
||||
### Minor
|
||||
* **Alerting**: Adds support for images in pushover notifier [#10780](https://github.com/grafana/grafana/issues/10780), thx [@jpenalbae](https://github.com/jpenalbae)
|
||||
* **Graphite/InfluxDB/OpenTSDB**: Fix always take dashboard timezone into consideration when handle custom time ranges [#15284](https://github.com/grafana/grafana/issues/15284)
|
||||
* **Stackdriver**: Template variables in filters using globbing format [#15182](https://github.com/grafana/grafana/issues/15182)
|
||||
* **Cloudwatch**: Add `resource_arns` template variable query function [#8207](https://github.com/grafana/grafana/issues/8207), thx [@jeroenvollenbrock](https://github.com/jeroenvollenbrock)
|
||||
* **Cloudwatch**: Add AWS/Neptune metrics [#14231](https://github.com/grafana/grafana/issues/14231), thx [@tcpatterson](https://github.com/tcpatterson)
|
||||
* **Cloudwatch**: Add AWS/EC2/API metrics [#14233](https://github.com/grafana/grafana/issues/14233), thx [@tcpatterson](https://github.com/tcpatterson)
|
||||
* **Cloudwatch**: Add AWS RDS ServerlessDatabaseCapacity metric [#15265](https://github.com/grafana/grafana/pull/15265), thx [@larsjoergensen](https://github.com/larsjoergensen)
|
||||
* **MySQL**: Adds datasource SSL CA/client certificates support [#8570](https://github.com/grafana/grafana/issues/8570), thx [@bugficks](https://github.com/bugficks)
|
||||
* **MSSQL**: Timerange are now passed for template variable queries [#13324](https://github.com/grafana/grafana/issues/13324), thx [@thatsparesh](https://github.com/thatsparesh)
|
||||
* **Annotations**: Support PATCH verb in annotations http api [#12546](https://github.com/grafana/grafana/issues/12546), thx [@SamuelToh](https://github.com/SamuelToh)
|
||||
* **Templating**: Add json formatting to variable interpolation [#15291](https://github.com/grafana/grafana/issues/15291), thx [@mtanda](https://github.com/mtanda)
|
||||
* **Login**: Anonymous usage stats for token auth [#15288](https://github.com/grafana/grafana/issues/15288)
|
||||
* **AzureMonitor**: improve autocomplete for Log Analytics and App Insights editor [#15131](https://github.com/grafana/grafana/issues/15131)
|
||||
* **LDAP**: Fix IPA/FreeIPA v4.6.4 does not allow LDAP searches with empty attributes [#14432](https://github.com/grafana/grafana/issues/14432)
|
||||
* **Provisioning**: Allow testing data sources that were added by config [#12164](https://github.com/grafana/grafana/issues/12164)
|
||||
* **Security**: Fix CSRF Token validation for POSTs [#1441](https://github.com/grafana/grafana/issues/1441)
|
||||
|
||||
### Breaking changes
|
||||
|
||||
* **Internal Metrics** Edition has been added to the build_info metric. This will break any Graphite queries using this metric. Edition will be a new label for the Prometheus metric. [#15363](https://github.com/grafana/grafana/pull/15363)
|
||||
|
||||
### Bug fixes
|
||||
|
||||
* **Gauge**: Fix issue with gauge requests being cancelled [#15366](https://github.com/grafana/grafana/issues/15366)
|
||||
* **Gauge**: Accept decimal inputs for thresholds [#15372](https://github.com/grafana/grafana/issues/15372)
|
||||
* **UI**: Fix error caused by named colors that are not part of named colors palette [#15373](https://github.com/grafana/grafana/issues/15373)
|
||||
* **Search**: Bug pressing special regexp chars in input fields [#12972](https://github.com/grafana/grafana/issues/12972)
|
||||
* **Permissions**: No need to have edit permissions to be able to "Save as" [#13066](https://github.com/grafana/grafana/issues/13066)
|
||||
|
||||
# 6.0.0-beta1 (2019-01-30)
|
||||
|
||||
### New Features
|
||||
|
||||
* **Alerting**: Adds support for Google Hangouts Chat notifications [#11221](https://github.com/grafana/grafana/issues/11221), thx [@PatrickSchuster](https://github.com/PatrickSchuster)
|
||||
* **Elasticsearch**: Support bucket script pipeline aggregations [#5968](https://github.com/grafana/grafana/issues/5968)
|
||||
* **Influxdb**: Add support for time zone (`tz`) clause [#10322](https://github.com/grafana/grafana/issues/10322), thx [@cykl](https://github.com/cykl)
|
||||
* **Snapshots**: Enable deletion of public snapshot [#14109](https://github.com/grafana/grafana/issues/14109)
|
||||
* **Provisioning**: Provisioning support for alert notifiers [#10487](https://github.com/grafana/grafana/issues/10487), thx [@pbakulev](https://github.com/pbakulev)
|
||||
* **Explore**: A whole new way to do ad-hoc metric queries and exploration. Split view in half and compare metrics & logs and much much more. [Read more here](http://docs.grafana.org/features/explore/)
|
||||
* **Auth**: Replace remember me cookie solution for Grafana's builtin, LDAP and OAuth authentication with a solution based on short-lived tokens [#15303](https://github.com/grafana/grafana/issues/15303)
|
||||
|
||||
### Minor
|
||||
|
||||
* **Templating**: Built in time range variables `$__from` and `$__to`, [#1909](https://github.com/grafana/grafana/issues/1909)
|
||||
* **Alerting**: Use separate timeouts for alert evals and notifications [#14701](https://github.com/grafana/grafana/issues/14701), thx [@sharkpc0813](https://github.com/sharkpc0813)
|
||||
* **Elasticsearch**: Add support for offset in date histogram aggregation [#12653](https://github.com/grafana/grafana/issues/12653), thx [@mattiarossi](https://github.com/mattiarossi)
|
||||
* **Elasticsearch**: Add support for moving average and derivative using doc count (metric count) [#8843](https://github.com/grafana/grafana/issues/8843) [#11175](https://github.com/grafana/grafana/issues/11175)
|
||||
* **Elasticsearch**: Add support for template variable interpolation in alias field [#4075](https://github.com/grafana/grafana/issues/4075), thx [@SamuelToh](https://github.com/SamuelToh)
|
||||
* **Influxdb**: Fix autocomplete of measurements does not escape search string properly [#11503](https://github.com/grafana/grafana/issues/11503), thx [@SamuelToh](https://github.com/SamuelToh)
|
||||
* **Stackdriver**: Aggregating series returns more than one series [#14581](https://github.com/grafana/grafana/issues/14581) and [#13914](https://github.com/grafana/grafana/issues/13914), thx [@kinok](https://github.com/kinok)
|
||||
* **Cloudwatch**: Fix Assume Role Arn [#14722](https://github.com/grafana/grafana/issues/14722), thx [@jaken551](https://github.com/jaken551)
|
||||
* **Postgres/MySQL/MSSQL**: Nanosecond timestamp support (`$__unixEpochNanoFilter`, `$__unixEpochNanoFrom`, `$__unixEpochNanoTo`) [#14711](https://github.com/grafana/grafana/pull/14711), thx [@ander26](https://github.com/ander26)
|
||||
* **Provisioning**: Fixes bug causing infinite growth in dashboard_version table. [#12864](https://github.com/grafana/grafana/issues/12864)
|
||||
* **Auth**: Prevent password reset when login form is disabled or either LDAP or Auth Proxy is enabled [#14246](https://github.com/grafana/grafana/issues/14246), thx [@SilverFire](https://github.com/SilverFire)
|
||||
* **Admin**: Fix prevent removing last grafana admin permissions [#11067](https://github.com/grafana/grafana/issues/11067), thx [@danielbh](https://github.com/danielbh)
|
||||
* **Admin**: When multiple user invitations, all links are the same as the first user who was invited [#14483](https://github.com/grafana/grafana/issues/14483)
|
||||
* **LDAP**: Upgrade go-ldap to v3 [#14548](https://github.com/grafana/grafana/issues/14548)
|
||||
* **OAuth**: Support OAuth providers that are not RFC6749 compliant [#14562](https://github.com/grafana/grafana/issues/14562), thx [@tdabasinskas](https://github.com/tdabasinskas)
|
||||
* **Proxy whitelist**: Add CIDR capability to auth_proxy whitelist [#14546](https://github.com/grafana/grafana/issues/14546), thx [@jacobrichard](https://github.com/jacobrichard)
|
||||
* **Dashboard**: `Min width` changed to `Max per row` for repeating panels. This lets you specify the maximum number of panels to show per row and by that repeated panels will always take up full width of row [#12991](https://github.com/grafana/grafana/pull/12991), thx [@pgiraud](https://github.com/pgiraud)
|
||||
* **Dashboard**: Retain decimal precision when exporting CSV [#13929](https://github.com/grafana/grafana/issues/13929), thx [@cinaglia](https://github.com/cinaglia)
|
||||
* **Templating**: Escaping "Custom" template variables [#13754](https://github.com/grafana/grafana/issues/13754), thx [@IntegersOfK](https://github.com/IntegersOfK)
|
||||
* **Templating**: Add percentencode formatting to variable interpolation to be used mainly for url escaping [#12764](https://github.com/grafana/grafana/issues/12764), thx [@cxcv](https://github.com/cxcv)
|
||||
* **Units**: Add blood glucose level units mg/dL and mmol/L [#14519](https://github.com/grafana/grafana/issues/14519), thx [@kjedamzik](https://github.com/kjedamzik)
|
||||
* **Units**: Add Floating Point Operations per Second units [#14558](https://github.com/grafana/grafana/pull/14558), thx [@hahnjo](https://github.com/hahnjo)
|
||||
* **Table**: Renders epoch string as date if date column style [#14484](https://github.com/grafana/grafana/issues/14484)
|
||||
* **Dataproxy**: Override incoming Authorization header [#13815](https://github.com/grafana/grafana/issues/13815), thx [@kornholi](https://github.com/kornholi)
|
||||
* **Dataproxy**: Add global datasource proxy timeout setting [#5699](https://github.com/grafana/grafana/issues/5699), thx [@RangerRick](https://github.com/RangerRick)
|
||||
* **Database**: Support specifying database host using IPV6 for backend database and sql datasources [#13711](https://github.com/grafana/grafana/issues/13711), thx [@ellisvlad](https://github.com/ellisvlad)
|
||||
* **Database**: Support defining additonal database connection string args when using `url` property in database settings [#14709](https://github.com/grafana/grafana/pull/14709), thx [@tpetr](https://github.com/tpetr)
|
||||
* **Stackdriver**: crossSeriesAggregation not being sent with the query [#15129](https://github.com/grafana/grafana/issues/15129), thx [@Legogris](https://github.com/Legogris)
|
||||
|
||||
### Bug fixes
|
||||
* **Search**: Fix for issue with scrolling the "tags filter" dropdown, fixes [#14486](https://github.com/grafana/grafana/issues/14486)
|
||||
* **Prometheus**: Query for annotation always uses 60s step regardless of dashboard range, fixes [#14795](https://github.com/grafana/grafana/issues/14795)
|
||||
* **Annotations**: Fix creating annotation when graph panel has no data points position the popup outside viewport [#13765](https://github.com/grafana/grafana/issues/13765), thx [@banjeremy](https://github.com/banjeremy)
|
||||
* **Piechart/Flot**: Fixes multiple piechart instances with donut bug [#15062](https://github.com/grafana/grafana/pull/15062)
|
||||
* **Postgres**: Fix default port not added when port not configured [#15189](https://github.com/grafana/grafana/issues/15189)
|
||||
* **Alerting**: Fixes crash bug when alert notifier folders are missing [#15295](https://github.com/grafana/grafana/issues/15295)
|
||||
* **Dashboard**: Fix save provisioned dashboard modal [#15219](https://github.com/grafana/grafana/pull/15219)
|
||||
* **Dashboard**: Fix having a long query in prometheus dashboard query editor blocks 30% of the query field when on OSX and having native scrollbars [#15122](https://github.com/grafana/grafana/issues/15122)
|
||||
* **Explore**: Fix issue with wrapping on long queries [#15222](https://github.com/grafana/grafana/issues/15222)
|
||||
* **Explore**: Fix cut & paste adds newline before and after selection [#15223](https://github.com/grafana/grafana/issues/15223)
|
||||
* **Dataproxy**: Fix global datasource proxy timeout not added to correct http client [#15258](https://github.com/grafana/grafana/issues/15258) [#5699](https://github.com/grafana/grafana/issues/5699)
|
||||
|
||||
### Breaking changes
|
||||
* **Text Panel**: The text panel does no longer by default allow unsantizied HTML. [#4117](https://github.com/grafana/grafana/issues/4117). This means that if you have text panels with scripts tags they will no longer work as before. To enable unsafe javascript execution in text panels enable the settings `disable_sanitize_html` under the section `[panels]` in your Grafana ini file, or set env variable `GF_PANELS_DISABLE_SANITIZE_HTML=true`.
|
||||
* **Dashboard**: Panel property `minSpan` replaced by `maxPerRow`. Dashboard migration will automatically migrate all dashboard panels using the `minSpan` property to the new `maxPerRow` property [#12991](https://github.com/grafana/grafana/pull/12991)
|
||||
|
||||
# 5.4.3 (2019-01-14)
|
||||
|
||||
### Tech
|
||||
|
||||
* **Docker**: Build and publish docker images for armv7 and arm64 [#14617](https://github.com/grafana/grafana/pull/14617), thx [@johanneswuerbach](https://github.com/johanneswuerbach)
|
||||
* **Backend**: Upgrade to golang 1.11.4 [#14580](https://github.com/grafana/grafana/issues/14580)
|
||||
* **MySQL** only update session in mysql database when required [#14540](https://github.com/grafana/grafana/pull/14540)
|
||||
|
||||
### Bug fixes
|
||||
* **Alerting** Invalid frequency causes division by zero in alert scheduler [#14810](https://github.com/grafana/grafana/issues/14810)
|
||||
* **Dashboard** Dashboard links do not update when time range changes [#14493](https://github.com/grafana/grafana/issues/14493)
|
||||
* **Limits** Support more than 1000 datasources per org [#13883](https://github.com/grafana/grafana/issues/13883)
|
||||
* **Backend** fix signed in user for orgId=0 result should return active org id [#14574](https://github.com/grafana/grafana/pull/14574)
|
||||
* **Provisioning** Adds orgId to user dto for provisioned dashboards [#14678](https://github.com/grafana/grafana/pull/14678)
|
||||
|
||||
# 5.4.2 (2018-12-13)
|
||||
|
||||
* **Datasource admin**: Fix for issue creating new data source when same name exists [#14467](https://github.com/grafana/grafana/issues/14467)
|
||||
* **OAuth**: Fix for oauth auto login setting, can now be set using env variable [#14435](https://github.com/grafana/grafana/issues/14435)
|
||||
* **Dashboard search**: Fix for searching tags in tags filter dropdown.
|
||||
|
||||
# 5.4.1 (2018-12-10)
|
||||
|
||||
* **Stackdriver**: Fixes issue with data proxy and Authorization header [#14262](https://github.com/grafana/grafana/issues/14262)
|
||||
* **Units**: fixedUnit for Flow:l/min and mL/min [#14294](https://github.com/grafana/grafana/issues/14294), thx [@flopp999](https://github.com/flopp999).
|
||||
* **Logging**: Fix for issue where data proxy logged a secret when debug logging was enabled, now redacted. [#14319](https://github.com/grafana/grafana/issues/14319)
|
||||
* TSDB**: Fix always take dashboard timezone into consideration when handle custom time ranges**: Add support for alerting on InfluxDB queries that use the cumulative_sum function. [#14314](https://github.com/grafana/grafana/pull/14314), thx [@nitti](https://github.com/nitti)
|
||||
* **Plugins**: Panel plugins should no receive the panel-initialized event again as usual.
|
||||
* **Embedded Graphs**: Iframe graph panels should now work as usual. [#14284](https://github.com/grafana/grafana/issues/14284)
|
||||
* **Postgres**: Improve PostgreSQL Query Editor if using different Schemas, [#14313](
|
||||
https://github.com/grafana/grafana/pull/14313)
|
||||
* **Quotas**: Fixed for updating org & user quotas. [#14347](https://github.com/grafana/grafana/pull/14347), thx [#moznion](https://github.com/moznion)
|
||||
* **Cloudwatch**: Add the AWS/SES Cloudwatch metrics of BounceRate and ComplaintRate to auto complete list. [#14401](https://github.com/grafana/grafana/pull/14401), thx [@sglajchEG](https://github.com/sglajchEG)
|
||||
* **Dashboard Search**: Fixed filtering by tag issues.
|
||||
* **Graph**: Fixed time region issues, [#14425](https://github.com/grafana/grafana/issues/14425), [#14280](https://github.com/grafana/grafana/issues/14280)
|
||||
* **Graph**: Fixed issue with series color picker popover being placed outside window.
|
||||
|
||||
|
||||
|
||||
# 5.4.0 (2018-12-03)
|
||||
|
||||
* **Cloudwatch**: Fix invalid time range causes segmentation fault [#14150](https://github.com/grafana/grafana/issues/14150)
|
||||
* **Cloudwatch**: AWS/CodeBuild metrics and dimensions [#14167](https://github.com/grafana/grafana/issues/14167), thx [@mmcoltman](https://github.com/mmcoltman)
|
||||
* **MySQL**: Fix `$__timeFrom()` and `$__timeTo()` should respect local time zone [#14228](https://github.com/grafana/grafana/issues/14228)
|
||||
|
||||
### 5.4.0-beta1 fixes
|
||||
* **Graph**: Fix legend always visible even if configured to be hidden [#14144](https://github.com/grafana/grafana/issues/14144)
|
||||
* **Elasticsearch**: Fix regression when using datasource version 6.0+ and alerting [#14175](https://github.com/grafana/grafana/pull/14175)
|
||||
|
||||
# 5.4.0-beta1 (2018-11-20)
|
||||
# 5.4.0 (unreleased)
|
||||
|
||||
### New Features
|
||||
|
||||
@@ -403,7 +152,7 @@ See [security announcement](https://community.grafana.com/t/grafana-5-3-3-and-4-
|
||||
* **Alerting**: Fix rendering timeout which could cause notifications to not be sent due to rendering timing out [#12151](https://github.com/grafana/grafana/issues/12151)
|
||||
* **Docker**: Make it possible to set a specific plugin url [#12861](https://github.com/grafana/grafana/pull/12861), thx [ClementGautier](https://github.com/ClementGautier)
|
||||
* **GrafanaCli**: Fixed issue with grafana-cli install plugin resulting in corrupt http response from source error. Fixes [#13079](https://github.com/grafana/grafana/issues/13079)
|
||||
* **Provisioning**: Should allow one default datasource per organization [#12229](https://github.com/grafana/grafana/issues/12229)
|
||||
* **Provisioning**: Should allow one default datasource per organisation [#12229](https://github.com/grafana/grafana/issues/12229)
|
||||
* **Github OAuth**: Allow changes of user info at Github to be synched to Grafana when signing in [#11818](https://github.com/grafana/grafana/issues/11818), thx [@rwaweber](https://github.com/rwaweber)
|
||||
* **OAuth**: Fix overriding tls_skip_verify_insecure using environment variable [#12747](https://github.com/grafana/grafana/issues/12747), thx [@jangaraj](https://github.com/jangaraj)
|
||||
* **Prometheus**: Fix graph panel bar width issue in aligned prometheus queries [#12379](https://github.com/grafana/grafana/issues/12379)
|
||||
@@ -526,7 +275,7 @@ See [security announcement](https://community.grafana.com/t/grafana-5-2-3-and-4-
|
||||
* **Dashboard**: Prevent double-click when saving dashboard [#11963](https://github.com/grafana/grafana/issues/11963)
|
||||
* **Dashboard**: AutoFocus the add-panel search filter [#12189](https://github.com/grafana/grafana/pull/12189) thx [@ryantxu](https://github.com/ryantxu)
|
||||
* **Units**: W/m2 (energy), l/h (flow) and kPa (pressure) [#11233](https://github.com/grafana/grafana/pull/11233), thx [@flopp999](https://github.com/flopp999)
|
||||
* **Units**: Liter/min (flow) and milliLiter/min (flow) [#12282](https://github.com/grafana/grafana/pull/12282), thx [@flopp999](https://github.com/flopp999)
|
||||
* **Units**: Litre/min (flow) and milliLitre/min (flow) [#12282](https://github.com/grafana/grafana/pull/12282), thx [@flopp999](https://github.com/flopp999)
|
||||
* **Alerting**: Fix mobile notifications for Microsoft Teams alert notifier [#11484](https://github.com/grafana/grafana/pull/11484), thx [@manacker](https://github.com/manacker)
|
||||
* **Influxdb**: Add support for mode function [#12286](https://github.com/grafana/grafana/issues/12286)
|
||||
* **Cloudwatch**: Fixes panic caused by bad timerange settings [#12199](https://github.com/grafana/grafana/issues/12199)
|
||||
@@ -661,7 +410,7 @@ See [security announcement](https://community.grafana.com/t/grafana-5-2-3-and-4-
|
||||
* **Units**: Use B/s instead Bps for Bytes per second [#9342](https://github.com/grafana/grafana/pull/9342), thx [@mayli](https://github.com/mayli)
|
||||
* **Units**: Radiation units [#11001](https://github.com/grafana/grafana/issues/11001), thx [@victorclaessen](https://github.com/victorclaessen)
|
||||
* **Units**: Timeticks unit [#11183](https://github.com/grafana/grafana/pull/11183), thx [@jtyr](https://github.com/jtyr)
|
||||
* **Units**: Concentration units and "Normal cubic meter" [#11211](https://github.com/grafana/grafana/issues/11211), thx [@flopp999](https://github.com/flopp999)
|
||||
* **Units**: Concentration units and "Normal cubic metre" [#11211](https://github.com/grafana/grafana/issues/11211), thx [@flopp999](https://github.com/flopp999)
|
||||
* **Units**: New currency - Czech koruna [#11384](https://github.com/grafana/grafana/pull/11384), thx [@Rohlik](https://github.com/Rohlik)
|
||||
* **Avatar**: Fix DISABLE_GRAVATAR option [#11095](https://github.com/grafana/grafana/issues/11095)
|
||||
* **Heatmap**: Disable log scale when using time time series buckets [#10792](https://github.com/grafana/grafana/issues/10792)
|
||||
@@ -978,7 +727,7 @@ See [security announcement](https://community.grafana.com/t/grafana-5-2-3-and-4-
|
||||
## Enhancements
|
||||
|
||||
* **GitHub OAuth**: Support for GitHub organizations with 100+ teams. [#8846](https://github.com/grafana/grafana/issues/8846), thx [@skwashd](https://github.com/skwashd)
|
||||
* **Graphite**: Calls to Graphite api /metrics/find now include panel or dashboard time range (from & until) in most cases, [#8055](https://github.com/grafana/grafana/issues/8055)
|
||||
* **Graphite**: Calls to Graphite api /metrics/find now include panel or dashboad time range (from & until) in most cases, [#8055](https://github.com/grafana/grafana/issues/8055)
|
||||
* **Graphite**: Added new graphite 1.0 functions, available if you set version to 1.0.x in data source settings. New Functions: mapSeries, reduceSeries, isNonNull, groupByNodes, offsetToZero, grep, weightedAverage, removeEmptySeries, aggregateLine, averageOutsidePercentile, delay, exponentialMovingAverage, fallbackSeries, integralByInterval, interpolate, invert, linearRegression, movingMin, movingMax, movingSum, multiplySeriesWithWildcards, pow, powSeries, removeBetweenPercentile, squareRoot, timeSlice, closes [#8261](https://github.com/grafana/grafana/issues/8261)
|
||||
- **Elasticsearch**: Ad-hoc filters now use query phrase match filters instead of term filters, works on non keyword/raw fields [#9095](https://github.com/grafana/grafana/issues/9095).
|
||||
|
||||
@@ -1143,7 +892,7 @@ Pull Request: [#8472](https://github.com/grafana/grafana/pull/8472)
|
||||
* **InfluxDB**: Influxb Datasource test passes even if the Database doesn't exist [#7864](https://github.com/grafana/grafana/issues/7864)
|
||||
* **Prometheus**: Displaying Prometheus annotations is incredibly slow [#7750](https://github.com/grafana/grafana/issues/7750), thx [@mtanda](https://github.com/mtanda)
|
||||
* **Graphite**: grafana generates empty find query to graphite -> 422 Unprocessable Entity [#7740](https://github.com/grafana/grafana/issues/7740)
|
||||
* **Admin**: make organization filter case insensitive [#8194](https://github.com/grafana/grafana/issues/8194), thx [@Alexander-N](https://github.com/Alexander-N)
|
||||
* **Admin**: make organisation filter case insensitive [#8194](https://github.com/grafana/grafana/issues/8194), thx [@Alexander-N](https://github.com/Alexander-N)
|
||||
|
||||
## Changes
|
||||
* **Elasticsearch**: Changed elasticsearch Terms aggregation to default to Min Doc Count to 1, and sort order to Top [#8321](https://github.com/grafana/grafana/issues/8321)
|
||||
@@ -1161,7 +910,7 @@ Pull Request: [#8472](https://github.com/grafana/grafana/pull/8472)
|
||||
* **Docs**: Added some details about Sessions in Postgres [#7694](https://github.com/grafana/grafana/pull/7694) thx [@rickard-von-essen](https://github.com/rickard-von-essen)
|
||||
* **Influxdb**: Allow commas in template variables [#7681](https://github.com/grafana/grafana/issues/7681) thx [@thuck](https://github.com/thuck)
|
||||
* **Cloudwatch**: stop using deprecated session.New() [#7736](https://github.com/grafana/grafana/issues/7736) thx [@mtanda](https://github.com/mtanda)
|
||||
*TSDB**: Fix always take dashboard timezone into consideration when handle custom time ranges**: Pass dropcounter rate option if no max counter and no reset value or reset value as 0 is specified [#7743](https://github.com/grafana/grafana/pull/7743) thx [@r4um](https://github.com/r4um)
|
||||
* **OpenTSDB**: Pass dropcounter rate option if no max counter and no reset value or reset value as 0 is specified [#7743](https://github.com/grafana/grafana/pull/7743) thx [@r4um](https://github.com/r4um)
|
||||
* **Templating**: support full resolution for $interval variable [#7696](https://github.com/grafana/grafana/pull/7696) thx [@mtanda](https://github.com/mtanda)
|
||||
* **Elasticsearch**: Unique Count on string fields in ElasticSearch [#3536](https://github.com/grafana/grafana/issues/3536), thx [@pyro2927](https://github.com/pyro2927)
|
||||
* **Templating**: Data source template variable that refers to other variable in regex filter [#6365](https://github.com/grafana/grafana/issues/6365) thx [@rlodge](https://github.com/rlodge)
|
||||
@@ -1271,7 +1020,7 @@ Pull Request: [#8472](https://github.com/grafana/grafana/pull/8472)
|
||||
* **CLI**: Make it possible to reset the admin password using the grafana-cli. [#5479](https://github.com/grafana/grafana/issues/5479)
|
||||
* **Influxdb**: Support multiple tags in InfluxDB annotations. [#4550](https://github.com/grafana/grafana/pull/4550), thx [@adrianlzt](https://github.com/adrianlzt)
|
||||
* **LDAP**: Basic Auth now supports LDAP username and password, [#6940](https://github.com/grafana/grafana/pull/6940), thx [@utkarshcmu](https://github.com/utkarshcmu)
|
||||
* **LDAP**: Now works with Auth Proxy, role and organization mapping & sync will regularly be performed. [#6895](https://github.com/grafana/grafana/pull/6895), thx [@Seuf](https://github.com/seuf)
|
||||
* **LDAP**: Now works with Auth Proxy, role and organisation mapping & sync will regularly be performed. [#6895](https://github.com/grafana/grafana/pull/6895), thx [@Seuf](https://github.com/seuf)
|
||||
* **Alerting**: Adds OK as no data option. [#6866](https://github.com/grafana/grafana/issues/6866)
|
||||
* **Alert list**: Order alerts based on state. [#6676](https://github.com/grafana/grafana/issues/6676)
|
||||
* **Alerting**: Add api endpoint for pausing all alerts. [#6589](https://github.com/grafana/grafana/issues/6589)
|
||||
@@ -1410,7 +1159,7 @@ due to too many connections/file handles on the data source backend. This proble
|
||||
* **Scripts**: Use restart instead of start for deb package script, closes [#5282](https://github.com/grafana/grafana/pull/5282)
|
||||
* **Logging**: Moved to structured logging lib, and moved to component specific level filters via config file, closes [#4590](https://github.com/grafana/grafana/issues/4590)
|
||||
* **OpenTSDB**: Support nested template variables in tag_values function, closes [#4398](https://github.com/grafana/grafana/issues/4398)
|
||||
* **Datasource**: Pending data source requests are canceled before new ones are issues (Graphite & Prometheus), closes [#5321](https://github.com/grafana/grafana/issues/5321)
|
||||
* **Datasource**: Pending data source requests are cancelled before new ones are issues (Graphite & Prometheus), closes [#5321](https://github.com/grafana/grafana/issues/5321)
|
||||
|
||||
### Breaking changes
|
||||
* **Logging** : Changed default logging output format (now structured into message, and key value pairs, with logger key acting as component). You can also no change in config to json log output.
|
||||
@@ -2114,7 +1863,7 @@ Read this [blog post](https://grafana.com/blog/2014/09/11/grafana-1.8.0-rc1-rele
|
||||
|
||||
#### Fixes
|
||||
- [Issue #126](https://github.com/grafana/grafana/issues/126). Graphite query lexer change, can now handle regex parameters for aliasSub function
|
||||
- [Issue #447](https://github.com/grafana/grafana/issues/447). Filter option loading when having multiple nested filters now works better. Options are now reloaded correctly and there are no multiple renders/refresh in between.
|
||||
- [Issue #447](https://github.com/grafana/grafana/issues/447). Filter option loading when having muliple nested filters now works better. Options are now reloaded correctly and there are no multiple renders/refresh in between.
|
||||
- [Issue #412](https://github.com/grafana/grafana/issues/412). After a filter option is changed and a nested template param is reloaded, if the current value exists after the options are reloaded the current selected value is kept.
|
||||
- [Issue #460](https://github.com/grafana/grafana/issues/460). Legend Current value did not display when value was zero
|
||||
- [Issue #328](https://github.com/grafana/grafana/issues/328). Fix to series toggling bug that caused annotations to be hidden when toggling/hiding series.
|
||||
@@ -2149,7 +1898,7 @@ Read this [blog post](https://grafana.com/blog/2014/09/11/grafana-1.8.0-rc1-rele
|
||||
- Graphite errors are now much easier to see and troubleshoot with the new inspector ([Issue #265](https://github.com/grafana/grafana/issues/265))
|
||||
- Use influxdb aliases to distinguish between multiple columns ([Issue #283](https://github.com/grafana/grafana/issues/283))
|
||||
- Correction to ms axis formater, now formats days correctly. ([Issue #189](https://github.com/grafana/grafana/issues/189))
|
||||
- Css fix for Firefox and using top menu dropdowns in panel fullscreen / edit mode ([Issue #106](https://github.com/grafana/grafana/issues/106))
|
||||
- Css fix for Firefox and using top menu dropdowns in panel fullscren / edit mode ([Issue #106](https://github.com/grafana/grafana/issues/106))
|
||||
- Browser page title is now Grafana - {{dashboard title}} ([Issue #294](https://github.com/grafana/grafana/issues/294))
|
||||
- Disable auto refresh zooming in (every time you change to an absolute time range), refresh will be restored when you change time range back to relative ([Issue #282](https://github.com/grafana/grafana/issues/282))
|
||||
- More graphite functions
|
||||
|
||||
@@ -2,7 +2,7 @@
|
||||
|
||||
## Our Pledge
|
||||
|
||||
In the interest of fostering an open and welcoming environment, we as contributors and maintainers pledge to make participation in our project and our community a harassment-free experience for everyone, regardless of age, body size, disability, ethnicity, gender identity and expression, level of experience, nationality, personal appearance, race, religion, or sexual identity and orientation.
|
||||
In the interest of fostering an open and welcoming environment, we as contributors and maintainers pledge to making participation in our project and our community a harassment-free experience for everyone, regardless of age, body size, disability, ethnicity, gender identity and expression, level of experience, nationality, personal appearance, race, religion, or sexual identity and orientation.
|
||||
|
||||
## Our Standards
|
||||
|
||||
|
||||
@@ -8,47 +8,49 @@ Contributions take the form of pull requests that will be reviewed by the core t
|
||||
|
||||
* If you have a trivial fix or improvement, go ahead and create a pull request.
|
||||
|
||||
* If you plan to do something more involved, discuss your idea on the respective [issue](https://github.com/grafana/grafana/issues) or create a [new issue](https://github.com/grafana/grafana/issues/new) if it does not exist. This will avoid unnecessary work and surely give you and us a good deal of inspiration.
|
||||
|
||||
* Sign our [CLA](http://docs.grafana.org/contribute/cla/).
|
||||
|
||||
* For changes in the backend, follow the style guides used in Go [Code Review Comments](https://code.google.com/p/go-wiki/wiki/CodeReviewComments) and Peter Bourgon's [Go: Best Practices for Production Environments](http://peter.bourgon.org/go-in-production/#formatting-and-style)
|
||||
|
||||
## Steps to Contribute
|
||||
|
||||
Should you wish to work on a GitHub issue, check first if it is not already assigned to someone. If it is free, you claim it by commenting on the issue that you want to work on it. This is to prevent duplicated efforts from contributors on the same issue.
|
||||
|
||||
Please check the [`beginner friendly`](https://github.com/grafana/grafana/issues?q=is%3Aopen+is%3Aissue+label%3A%22beginner+friendly%22) and [`help wanted`](https://github.com/grafana/grafana/issues?q=is%3Aopen+is%3Aissue+label%3A%22help+wanted%22) labels to find issues that are good for getting started. If you have questions about one of the issues, with or without the tag, please comment on them and one of the core team or the original poster will clarify it.
|
||||
Please check the [`beginner friendly`](https://github.com/grafana/grafana/issues?q=is%3Aopen+is%3Aissue+label%3A%22beginner+friendly%22) label to find issues that are good for getting started. If you have questions about one of the issues, with or without the tag, please comment on them and one of the core team or the original poster will clarify it.
|
||||
|
||||
To setup a local development environment we recommend reading [Building Grafana from source](http://docs.grafana.org/project/building_from_source/)
|
||||
|
||||
|
||||
## Setup
|
||||
|
||||
Follow the setup guide in README.md
|
||||
|
||||
### Rebuild frontend assets on source change
|
||||
```
|
||||
yarn watch
|
||||
```
|
||||
|
||||
### Rerun tests on source change
|
||||
```
|
||||
yarn jest
|
||||
```
|
||||
|
||||
### Run tests for backend assets before commit
|
||||
```
|
||||
test -z "$(gofmt -s -l . | grep -v -E 'vendor/(github.com|golang.org|gopkg.in)' | tee /dev/stderr)"
|
||||
```
|
||||
|
||||
### Run tests for frontend assets before commit
|
||||
```
|
||||
yarn test
|
||||
go test -v ./pkg/...
|
||||
```
|
||||
|
||||
|
||||
## Pull Request Checklist
|
||||
|
||||
* Branch from the master branch and, if needed, rebase to the current master branch before submitting your pull request. If it doesn't merge cleanly with master you may be asked to rebase your changes.
|
||||
|
||||
* Commits should be as small as possible, while ensuring that each commit is correct independently (i.e., each commit should compile and pass tests).
|
||||
|
||||
* If your patch is not getting reviewed or you need a specific person to review it, you can @-reply a reviewer asking for a review in the pull request or a comment.
|
||||
|
||||
* Add tests relevant to the fixed bug or new feature.
|
||||
|
||||
### Pull requests with new features
|
||||
Commits should be as small as possible, while ensuring that each commit is correct independently (i.e., each commit should compile and pass tests).
|
||||
|
||||
Make sure to include `Closes #<issue number>` or `Fixes #<issue number>` in the pull request description.
|
||||
|
||||
### Pull requests with bug fixes
|
||||
Please make all changes in one commit if possible. Include `Closes #<issue number>` in bottom of the commit message.
|
||||
A commit message for a bug fix should look something like this.
|
||||
|
||||
```
|
||||
avoid infinite loop in the dashboard provisioner
|
||||
|
||||
if one dashboard with an uid is refered to by two
|
||||
provsioners each provisioner overwrite each other.
|
||||
filling up dashboard_versions quite fast if using
|
||||
default settings.
|
||||
|
||||
Closes #12864
|
||||
```
|
||||
|
||||
If the pull request needs changes before its merged the new commits should be rebased into one commit before its merged.
|
||||
|
||||
@@ -1,5 +1,5 @@
|
||||
# Golang build container
|
||||
FROM golang:1.11.5
|
||||
FROM golang:1.11.4
|
||||
|
||||
WORKDIR $GOPATH/src/github.com/grafana/grafana
|
||||
|
||||
@@ -19,13 +19,11 @@ COPY package.json package.json
|
||||
RUN go run build.go build
|
||||
|
||||
# Node build container
|
||||
FROM node:10.14.2
|
||||
FROM node:8
|
||||
|
||||
WORKDIR /usr/src/app/
|
||||
|
||||
COPY package.json yarn.lock ./
|
||||
COPY packages packages
|
||||
|
||||
RUN yarn install --pure-lockfile --no-progress
|
||||
|
||||
COPY Gruntfile.js tsconfig.json tslint.json ./
|
||||
@@ -64,7 +62,6 @@ RUN mkdir -p "$GF_PATHS_HOME/.aws" && \
|
||||
useradd -r -u $GF_UID -g grafana grafana && \
|
||||
mkdir -p "$GF_PATHS_PROVISIONING/datasources" \
|
||||
"$GF_PATHS_PROVISIONING/dashboards" \
|
||||
"$GF_PATHS_PROVISIONING/notifiers" \
|
||||
"$GF_PATHS_LOGS" \
|
||||
"$GF_PATHS_PLUGINS" \
|
||||
"$GF_PATHS_DATA" && \
|
||||
|
||||
64
Gopkg.lock
generated
64
Gopkg.lock
generated
@@ -34,7 +34,7 @@
|
||||
revision = "6c6b55f8796f578c870b7e19bafb16103bc40095"
|
||||
|
||||
[[projects]]
|
||||
digest = "1:ebe102b61c1615d2954734e3cfe1b6b06a5088c25a41055b38661d41ad7b8f27"
|
||||
digest = "1:58294d68772aab5a8941b7d5d228eff7cccf63f895e914bc9bc38fda80471ea5"
|
||||
name = "github.com/aws/aws-sdk-go"
|
||||
packages = [
|
||||
"aws",
|
||||
@@ -46,7 +46,6 @@
|
||||
"aws/credentials",
|
||||
"aws/credentials/ec2rolecreds",
|
||||
"aws/credentials/endpointcreds",
|
||||
"aws/credentials/processcreds",
|
||||
"aws/credentials/stscreds",
|
||||
"aws/csm",
|
||||
"aws/defaults",
|
||||
@@ -55,18 +54,13 @@
|
||||
"aws/request",
|
||||
"aws/session",
|
||||
"aws/signer/v4",
|
||||
"internal/ini",
|
||||
"internal/s3err",
|
||||
"internal/sdkio",
|
||||
"internal/sdkrand",
|
||||
"internal/sdkuri",
|
||||
"internal/shareddefaults",
|
||||
"private/protocol",
|
||||
"private/protocol/ec2query",
|
||||
"private/protocol/eventstream",
|
||||
"private/protocol/eventstream/eventstreamapi",
|
||||
"private/protocol/json/jsonutil",
|
||||
"private/protocol/jsonrpc",
|
||||
"private/protocol/query",
|
||||
"private/protocol/query/queryutil",
|
||||
"private/protocol/rest",
|
||||
@@ -75,14 +69,12 @@
|
||||
"service/cloudwatch",
|
||||
"service/ec2",
|
||||
"service/ec2/ec2iface",
|
||||
"service/resourcegroupstaggingapi",
|
||||
"service/resourcegroupstaggingapi/resourcegroupstaggingapiiface",
|
||||
"service/s3",
|
||||
"service/sts",
|
||||
]
|
||||
pruneopts = "NUT"
|
||||
revision = "62936e15518acb527a1a9cb4a39d96d94d0fd9a2"
|
||||
version = "v1.16.15"
|
||||
revision = "fde4ded7becdeae4d26bf1212916aabba79349b4"
|
||||
version = "v1.14.12"
|
||||
|
||||
[[projects]]
|
||||
branch = "master"
|
||||
@@ -174,6 +166,22 @@
|
||||
revision = "5b77d2a35fb0ede96d138fc9a99f5c9b6aef11b4"
|
||||
version = "v1.7.0"
|
||||
|
||||
[[projects]]
|
||||
digest = "1:e05711632e1515319b014e8fe4cbe1d30ab024c473403f60cf0fdeb4c586a474"
|
||||
name = "github.com/go-ini/ini"
|
||||
packages = ["."]
|
||||
pruneopts = "NUT"
|
||||
revision = "6529cf7c58879c08d927016dde4477f18a0634cb"
|
||||
version = "v1.36.0"
|
||||
|
||||
[[projects]]
|
||||
digest = "1:7e1c00b9959544fa1ccca7cf0407a5b29ac6d5201059c4fac6f599cb99bfd24d"
|
||||
name = "github.com/go-ldap/ldap"
|
||||
packages = ["."]
|
||||
pruneopts = "NUT"
|
||||
revision = "bb7a9ca6e4fbc2129e3db588a34bc970ffe811a9"
|
||||
version = "v2.5.1"
|
||||
|
||||
[[projects]]
|
||||
branch = "master"
|
||||
digest = "1:682a0aca743a1a4a36697f3d7f86c0ed403c4e3a780db9935f633242855eac9c"
|
||||
@@ -227,28 +235,28 @@
|
||||
version = "v1.7.0"
|
||||
|
||||
[[projects]]
|
||||
digest = "1:06d21295033f211588d0ad7ff391cc1b27e72b60cb6d4b7db0d70cffae4cf228"
|
||||
digest = "1:b9d4f09cdaaa9e7dca5ed0b501ca5519eb2168dd01fc5d174c54edfe42a7d5ed"
|
||||
name = "github.com/go-xorm/builder"
|
||||
packages = ["."]
|
||||
pruneopts = "NUT"
|
||||
revision = "1d658d7596c25394aab557ef5b50ef35bf706384"
|
||||
version = "v0.3.4"
|
||||
revision = "bad0a612f0d6277b953910822ab5dfb30dd18237"
|
||||
version = "v0.2.0"
|
||||
|
||||
[[projects]]
|
||||
digest = "1:b26928aab0fff92592e8728c5bc9d6e404fa2017d6a8e841ae5e60a42237f6fc"
|
||||
digest = "1:30fb106b0cd6d64ea6fccded579c8f7d788460092f885fcc8f3edd02fc2085a4"
|
||||
name = "github.com/go-xorm/core"
|
||||
packages = ["."]
|
||||
pruneopts = "NUT"
|
||||
revision = "ccc80c1adf1f6172bbc548877f50a1163041a40a"
|
||||
version = "v0.6.2"
|
||||
revision = "da1adaf7a28ca792961721a34e6e04945200c890"
|
||||
version = "v0.5.7"
|
||||
|
||||
[[projects]]
|
||||
digest = "1:407316703b32d68ccf5d39bdae57d411b6954e253e07d0fff0988a3f39861f2f"
|
||||
digest = "1:007d1354e4f44e6a393337e7623bcf911dfe75d6ef30fb767a6a0b65d302f5ed"
|
||||
name = "github.com/go-xorm/xorm"
|
||||
packages = ["."]
|
||||
pruneopts = "NUT"
|
||||
revision = "1f39c590c64924f358c0d89016ac9b2bb84e9125"
|
||||
version = "v0.7.1"
|
||||
revision = "1933dd69e294c0a26c0266637067f24dbb25770c"
|
||||
version = "v0.6.4"
|
||||
|
||||
[[projects]]
|
||||
branch = "master"
|
||||
@@ -339,11 +347,11 @@
|
||||
version = "v2.13"
|
||||
|
||||
[[projects]]
|
||||
digest = "1:1f2aebae7e7c856562355ec0198d8ca2fa222fb05e5b1b66632a1fce39631885"
|
||||
digest = "1:ac6d01547ec4f7f673311b4663909269bfb8249952de3279799289467837c3cc"
|
||||
name = "github.com/jmespath/go-jmespath"
|
||||
packages = ["."]
|
||||
pruneopts = "NUT"
|
||||
revision = "c2b33e84"
|
||||
revision = "0b12d6b5"
|
||||
|
||||
[[projects]]
|
||||
digest = "1:6ddab442e52381bab82fb6c07ef3f4b565ff7ec4b8fae96d8dd4b8573a460597"
|
||||
@@ -806,14 +814,6 @@
|
||||
revision = "6529cf7c58879c08d927016dde4477f18a0634cb"
|
||||
version = "v1.36.0"
|
||||
|
||||
[[projects]]
|
||||
digest = "1:c847b7fea4c7e6db5281a37dffc4620cb78c1227403a79e5aa290db517657ac1"
|
||||
name = "gopkg.in/ldap.v3"
|
||||
packages = ["."]
|
||||
pruneopts = "NUT"
|
||||
revision = "5c2c0f997205c29de14cb6c35996370c2c5dfab1"
|
||||
version = "v3"
|
||||
|
||||
[[projects]]
|
||||
digest = "1:3b0cf3a465fd07f76e5fc1a9d0783c662dac0de9fc73d713ebe162768fd87b5f"
|
||||
name = "gopkg.in/macaron.v1"
|
||||
@@ -879,8 +879,6 @@
|
||||
"github.com/aws/aws-sdk-go/service/cloudwatch",
|
||||
"github.com/aws/aws-sdk-go/service/ec2",
|
||||
"github.com/aws/aws-sdk-go/service/ec2/ec2iface",
|
||||
"github.com/aws/aws-sdk-go/service/resourcegroupstaggingapi",
|
||||
"github.com/aws/aws-sdk-go/service/resourcegroupstaggingapi/resourcegroupstaggingapiiface",
|
||||
"github.com/aws/aws-sdk-go/service/s3",
|
||||
"github.com/aws/aws-sdk-go/service/sts",
|
||||
"github.com/benbjohnson/clock",
|
||||
@@ -890,6 +888,7 @@
|
||||
"github.com/denisenkom/go-mssqldb",
|
||||
"github.com/facebookgo/inject",
|
||||
"github.com/fatih/color",
|
||||
"github.com/go-ldap/ldap",
|
||||
"github.com/go-macaron/binding",
|
||||
"github.com/go-macaron/gzip",
|
||||
"github.com/go-macaron/session",
|
||||
@@ -934,7 +933,6 @@
|
||||
"golang.org/x/oauth2/jwt",
|
||||
"golang.org/x/sync/errgroup",
|
||||
"gopkg.in/ini.v1",
|
||||
"gopkg.in/ldap.v3",
|
||||
"gopkg.in/macaron.v1",
|
||||
"gopkg.in/mail.v2",
|
||||
"gopkg.in/square/go-jose.v2",
|
||||
|
||||
16
Gopkg.toml
16
Gopkg.toml
@@ -58,6 +58,10 @@ ignored = [
|
||||
name = "github.com/fatih/color"
|
||||
version = "1.5.0"
|
||||
|
||||
[[constraint]]
|
||||
name = "github.com/go-ldap/ldap"
|
||||
version = "2.5.1"
|
||||
|
||||
[[constraint]]
|
||||
branch = "master"
|
||||
name = "github.com/go-macaron/binding"
|
||||
@@ -81,15 +85,11 @@ ignored = [
|
||||
|
||||
[[constraint]]
|
||||
name = "github.com/go-xorm/core"
|
||||
version = "=0.6.2"
|
||||
|
||||
[[override]]
|
||||
name = "github.com/go-xorm/builder"
|
||||
version = "=0.3.4"
|
||||
version = "=0.5.7"
|
||||
|
||||
[[constraint]]
|
||||
name = "github.com/go-xorm/xorm"
|
||||
version = "=0.7.1"
|
||||
version = "=0.6.4"
|
||||
|
||||
[[constraint]]
|
||||
name = "github.com/gorilla/websocket"
|
||||
@@ -211,7 +211,3 @@ ignored = [
|
||||
[[constraint]]
|
||||
name = "gopkg.in/square/go-jose.v2"
|
||||
version = "2.1.9"
|
||||
|
||||
[[constraint]]
|
||||
name = "gopkg.in/ldap.v3"
|
||||
version = "3.0.0"
|
||||
|
||||
@@ -187,7 +187,7 @@
|
||||
same "printed page" as the copyright notice for easier
|
||||
identification within third-party archives.
|
||||
|
||||
Copyright 2015 Grafana Labs
|
||||
Copyright [yyyy] [name of copyright owner]
|
||||
|
||||
Licensed under the Apache License, Version 2.0 (the "License");
|
||||
you may not use this file except in compliance with the License.
|
||||
@@ -1,7 +1,7 @@
|
||||
# Plugin Development
|
||||
|
||||
This document is not meant as a complete guide for developing plugins but more as a changelog for changes in
|
||||
Grafana that can impact plugin development. Whenever you as a plugin author encounter an issue with your plugin after
|
||||
This document is not meant as complete guide for developing plugins but more as a changelog for changes in
|
||||
Grafana that can impact plugin development. When ever you as plugin author encounter an issue with your plugin after
|
||||
upgrading Grafana please check here before creating an issue.
|
||||
|
||||
## Links
|
||||
@@ -27,8 +27,3 @@ If you think we missed exposing a crucial lib or Grafana component let us know b
|
||||
The angular directive `<spectrum-picker>` is now deprecated (will still work for a version more) but we recommend plugin authors
|
||||
to upgrade to new `<color-picker color="ctrl.color" onChange="ctrl.onSparklineColorChange"></color-picker>`
|
||||
|
||||
## Changes in v6.0
|
||||
|
||||
### DashboardSrv.ts
|
||||
|
||||
If you utilize [DashboardSrv](https://github.com/grafana/grafana/commit/8574dca081002f36e482b572517d8f05fd44453f#diff-1ab99561f9f6a10e1fafcddc39bc1d65) in your plugin code, `dash` was renamed to `dashboard`
|
||||
|
||||
90
README.md
90
README.md
@@ -7,92 +7,71 @@
|
||||
Grafana is an open source, feature rich metrics dashboard and graph editor for
|
||||
Graphite, Elasticsearch, OpenTSDB, Prometheus and InfluxDB.
|
||||
|
||||
<!---
|
||||

|
||||
-->
|
||||
|
||||
## Installation
|
||||
Head to [docs.grafana.org](http://docs.grafana.org/installation/) for documentation or [download](https://grafana.com/get) to get the latest release.
|
||||
Head to [docs.grafana.org](http://docs.grafana.org/installation/) and [download](https://grafana.com/get)
|
||||
the latest release.
|
||||
|
||||
If you have any problems please read the [troubleshooting guide](http://docs.grafana.org/installation/troubleshooting/).
|
||||
|
||||
## Documentation & Support
|
||||
Be sure to read the [getting started guide](http://docs.grafana.org/guides/gettingstarted/) and the other feature guides.
|
||||
|
||||
## Run from master
|
||||
If you want to build a package yourself, or contribute - here is a guide for how to do that. You can always find
|
||||
If you want to build a package yourself, or contribute - Here is a guide for how to do that. You can always find
|
||||
the latest master builds [here](https://grafana.com/grafana/download)
|
||||
|
||||
### Dependencies
|
||||
|
||||
- Go (Latest Stable)
|
||||
- bra [`go get github.com/Unknwon/bra`]
|
||||
- Node.js LTS
|
||||
- yarn [`npm install -g yarn`]
|
||||
|
||||
### Get the project
|
||||
|
||||
**The project located in the go-path will be your working directory.**
|
||||
- NodeJS LTS
|
||||
|
||||
### Building the backend
|
||||
```bash
|
||||
go get github.com/grafana/grafana
|
||||
cd $GOPATH/src/github.com/grafana/grafana
|
||||
```
|
||||
|
||||
### Building
|
||||
|
||||
#### The backend
|
||||
|
||||
```bash
|
||||
go run build.go setup
|
||||
go run build.go build
|
||||
```
|
||||
|
||||
#### Frontend assets
|
||||
### Building frontend assets
|
||||
|
||||
*For this you need Node.js (LTS version).*
|
||||
For this you need nodejs (v.6+).
|
||||
|
||||
To build the assets, rebuild on file change, and serve them by Grafana's webserver (http://localhost:3000):
|
||||
```bash
|
||||
npm install -g yarn
|
||||
yarn install --pure-lockfile
|
||||
```
|
||||
|
||||
### Run and rebuild on source change
|
||||
|
||||
#### Backend
|
||||
|
||||
To run the backend and rebuild on source change:
|
||||
|
||||
```bash
|
||||
$GOPATH/bin/bra run
|
||||
```
|
||||
|
||||
#### Frontend
|
||||
|
||||
Rebuild on file change, and serve them by Grafana's webserver (http://localhost:3000):
|
||||
|
||||
```bash
|
||||
yarn start
|
||||
yarn watch
|
||||
```
|
||||
|
||||
Build the assets, rebuild on file change with Hot Module Replacement (HMR), and serve them by webpack-dev-server (http://localhost:3333):
|
||||
|
||||
```bash
|
||||
yarn start:hot
|
||||
yarn start
|
||||
# OR set a theme
|
||||
env GRAFANA_THEME=light yarn start:hot
|
||||
env GRAFANA_THEME=light yarn start
|
||||
```
|
||||
Note: HMR for Angular is not supported. If you edit files in the Angular part of the app, the whole page will reload.
|
||||
|
||||
*Note: HMR for Angular is not supported. If you edit files in the Angular part of the app, the whole page will reload.*
|
||||
|
||||
Run tests and rebuild on source change:
|
||||
|
||||
Run tests
|
||||
```bash
|
||||
yarn jest
|
||||
```
|
||||
|
||||
**Open grafana in your browser (default: e.g. `http://localhost:3000`) and login with admin user (default: `user/pass = admin/admin`).**
|
||||
### Recompile backend on source change
|
||||
|
||||
To rebuild on source change.
|
||||
```bash
|
||||
go get github.com/Unknwon/bra
|
||||
bra run
|
||||
```
|
||||
|
||||
Open grafana in your browser (default: `http://localhost:3000`) and login with admin user (default: `user/pass = admin/admin`).
|
||||
|
||||
### Building a Docker image
|
||||
|
||||
There are two different ways to build a Grafana docker image. If your machine is setup for Grafana development and you run linux/amd64 you can build just the image. Otherwise, there is the option to build Grafana completely within Docker.
|
||||
There are two different ways to build a Grafana docker image. If you're machine is setup for Grafana development and you run linux/amd64 you can build just the image. Otherwise, there is the option to build Grafana completely within Docker.
|
||||
|
||||
Run the image you have built using: `docker run --rm -p 3000:3000 grafana/grafana:dev`
|
||||
|
||||
@@ -111,10 +90,6 @@ Choose this option to build on platforms other than linux/amd64 and/or not have
|
||||
|
||||
The resulting image will be tagged as `grafana/grafana:dev`
|
||||
|
||||
Notice: If you are using Docker for MacOS, be sure to set the memory limit to be larger than 2 GiB (at docker -> Preferences -> Advanced), otherwise `grunt build` may fail.
|
||||
|
||||
## Development
|
||||
|
||||
### Dev config
|
||||
|
||||
Create a custom.ini in the conf directory to override default configuration options.
|
||||
@@ -150,19 +125,12 @@ GRAFANA_TEST_DB=mysql go test ./pkg/...
|
||||
GRAFANA_TEST_DB=postgres go test ./pkg/...
|
||||
```
|
||||
|
||||
### Datasource and dashboard provisioning
|
||||
|
||||
[Here](https://github.com/grafana/grafana/tree/master/devenv) you can find helpful scripts and docker-compose setup
|
||||
that will populate your dev environment for quicker testing end experimenting.
|
||||
|
||||
## Contribute
|
||||
|
||||
If you have any ideas for improvement or have found a bug, do not hesitate to open an issue.
|
||||
And if you have time, clone this repo and submit a pull request to help me make Grafana
|
||||
If you have any idea for an improvement or found a bug, do not hesitate to open an issue.
|
||||
And if you have time clone this repo and submit a pull request and help me make Grafana
|
||||
the kickass metrics & devops dashboard we all dream about!
|
||||
|
||||
Read the [contributing](https://github.com/grafana/grafana/blob/master/CONTRIBUTING.md) guide then check the [`beginner friendly`](https://github.com/grafana/grafana/issues?q=is%3Aopen+is%3Aissue+label%3A%22beginner+friendly%22) label to find issues that are easy and that we would like help with.
|
||||
|
||||
## Plugin development
|
||||
|
||||
Checkout the [Plugin Development Guide](http://docs.grafana.org/plugins/developing/development/) and checkout the [PLUGIN_DEV.md](https://github.com/grafana/grafana/blob/master/PLUGIN_DEV.md) file for changes in Grafana that relate to
|
||||
@@ -170,5 +138,5 @@ plugin development.
|
||||
|
||||
## License
|
||||
|
||||
Grafana is distributed under [Apache 2.0 License](https://github.com/grafana/grafana/blob/master/LICENSE).
|
||||
Grafana is distributed under [Apache 2.0 License](https://github.com/grafana/grafana/blob/master/LICENSE.md).
|
||||
|
||||
|
||||
18
ROADMAP.md
18
ROADMAP.md
@@ -5,22 +5,18 @@ But it will give you an idea of our current vision and plan.
|
||||
|
||||
### Short term (1-2 months)
|
||||
- PRs & Bugs
|
||||
- React Panel Support
|
||||
- React Query Editor Support
|
||||
- Multi-Stat panel
|
||||
- Metrics & Log Explore UI
|
||||
- Grafana UI library shared between grafana & plugins
|
||||
- Seperate visualization from panels
|
||||
- More reuse between Explore & dashboard
|
||||
- Explore logging support for more data sources
|
||||
|
||||
|
||||
### Mid term (2-4 months)
|
||||
- Drilldown links
|
||||
- Dashboards as code workflows
|
||||
- React migration
|
||||
- New panels
|
||||
- React Panels
|
||||
- Change visualization (panel type) on the fly.
|
||||
- Templating Query Editor UI Plugin hook
|
||||
- Backend plugins
|
||||
|
||||
### Long term (4 - 8 months)
|
||||
- Alerting improvements (silence, per series tracking, etc)
|
||||
- Progress on React migration
|
||||
|
||||
### In a distant future far far away
|
||||
- Meta queries
|
||||
|
||||
@@ -47,7 +47,7 @@ Our builds run on CircleCI through our build script.
|
||||
|
||||
### grafana/build-container
|
||||
|
||||
The main build step (in CircleCI) is built using a custom build container that comes pre-baked with some of the necessary dependencies.
|
||||
The main build step (in CircleCI) is built using a custom build container that comes pre-baked with some of the neccesary dependencies.
|
||||
|
||||
Link: [grafana-build-container](https://github.com/grafana/grafana-build-container)
|
||||
|
||||
@@ -86,4 +86,4 @@ There is a Docker build for Grafana in the root of the project that allows anyon
|
||||
|
||||
### Local developer environments
|
||||
|
||||
Please send out a notice in the grafana-dev slack channel when updating Go or Node.js to make it easier for everyone to update their local developer environments.
|
||||
Please send out a notice in the grafana-dev slack channel when updating Go or Node.js to make it easier for everyone to update their local developer environments.
|
||||
@@ -7,7 +7,7 @@ clone_folder: c:\gopath\src\github.com\grafana\grafana
|
||||
environment:
|
||||
nodejs_version: "8"
|
||||
GOPATH: C:\gopath
|
||||
GOVERSION: 1.11.5
|
||||
GOVERSION: 1.11.4
|
||||
|
||||
install:
|
||||
- rmdir c:\go /s /q
|
||||
|
||||
65
build.go
65
build.go
@@ -46,9 +46,6 @@ var (
|
||||
binaries []string = []string{"grafana-server", "grafana-cli"}
|
||||
isDev bool = false
|
||||
enterprise bool = false
|
||||
skipRpmGen bool = false
|
||||
skipDebGen bool = false
|
||||
printGenVersion bool = false
|
||||
)
|
||||
|
||||
func main() {
|
||||
@@ -70,9 +67,6 @@ func main() {
|
||||
flag.BoolVar(&enterprise, "enterprise", enterprise, "Build enterprise version of Grafana")
|
||||
flag.StringVar(&buildIdRaw, "buildId", "0", "Build ID from CI system")
|
||||
flag.BoolVar(&isDev, "dev", isDev, "optimal for development, skips certain steps")
|
||||
flag.BoolVar(&skipRpmGen, "skipRpm", skipRpmGen, "skip rpm package generation (default: false)")
|
||||
flag.BoolVar(&skipDebGen, "skipDeb", skipDebGen, "skip deb package generation (default: false)")
|
||||
flag.BoolVar(&printGenVersion, "gen-version", printGenVersion, "generate Grafana version and output (default: false)")
|
||||
flag.Parse()
|
||||
|
||||
buildId = shortenBuildId(buildIdRaw)
|
||||
@@ -83,11 +77,6 @@ func main() {
|
||||
pkgArch = goarch
|
||||
}
|
||||
|
||||
if printGenVersion {
|
||||
printGeneratedVersion()
|
||||
return
|
||||
}
|
||||
|
||||
log.Printf("Version: %s, Linux Version: %s, Package Iteration: %s\n", version, linuxPackageVersion, linuxPackageIteration)
|
||||
|
||||
if flag.NArg() == 0 {
|
||||
@@ -176,7 +165,6 @@ func makeLatestDistCopies() {
|
||||
".x86_64.rpm": "dist/grafana-latest-1.x86_64.rpm",
|
||||
".linux-amd64.tar.gz": "dist/grafana-latest.linux-x64.tar.gz",
|
||||
".linux-armv7.tar.gz": "dist/grafana-latest.linux-armv7.tar.gz",
|
||||
".linux-armv6.tar.gz": "dist/grafana-latest.linux-armv6.tar.gz",
|
||||
".linux-arm64.tar.gz": "dist/grafana-latest.linux-arm64.tar.gz",
|
||||
}
|
||||
|
||||
@@ -228,7 +216,6 @@ func readVersionFromPackageJson() {
|
||||
|
||||
type linuxPackageOptions struct {
|
||||
packageType string
|
||||
packageArch string
|
||||
homeDir string
|
||||
binPath string
|
||||
serverBinPath string
|
||||
@@ -249,14 +236,12 @@ type linuxPackageOptions struct {
|
||||
}
|
||||
|
||||
func createDebPackages() {
|
||||
debPkgArch := pkgArch
|
||||
if pkgArch == "armv7" || pkgArch == "armv6" {
|
||||
debPkgArch = "armhf"
|
||||
previousPkgArch := pkgArch
|
||||
if pkgArch == "armv7" {
|
||||
pkgArch = "armhf"
|
||||
}
|
||||
|
||||
createPackage(linuxPackageOptions{
|
||||
packageType: "deb",
|
||||
packageArch: debPkgArch,
|
||||
homeDir: "/usr/share/grafana",
|
||||
binPath: "/usr/sbin",
|
||||
configDir: "/etc/grafana",
|
||||
@@ -272,19 +257,19 @@ func createDebPackages() {
|
||||
|
||||
depends: []string{"adduser", "libfontconfig"},
|
||||
})
|
||||
pkgArch = previousPkgArch
|
||||
}
|
||||
|
||||
func createRpmPackages() {
|
||||
rpmPkgArch := pkgArch
|
||||
previousPkgArch := pkgArch
|
||||
switch {
|
||||
case pkgArch == "armv7":
|
||||
rpmPkgArch = "armhfp"
|
||||
pkgArch = "armhfp"
|
||||
case pkgArch == "arm64":
|
||||
rpmPkgArch = "aarch64"
|
||||
pkgArch = "aarch64"
|
||||
}
|
||||
createPackage(linuxPackageOptions{
|
||||
packageType: "rpm",
|
||||
packageArch: rpmPkgArch,
|
||||
homeDir: "/usr/share/grafana",
|
||||
binPath: "/usr/sbin",
|
||||
configDir: "/etc/grafana",
|
||||
@@ -300,16 +285,12 @@ func createRpmPackages() {
|
||||
|
||||
depends: []string{"/sbin/service", "fontconfig", "freetype", "urw-fonts"},
|
||||
})
|
||||
pkgArch = previousPkgArch
|
||||
}
|
||||
|
||||
func createLinuxPackages() {
|
||||
if !skipDebGen {
|
||||
createDebPackages()
|
||||
}
|
||||
|
||||
if !skipRpmGen {
|
||||
createRpmPackages()
|
||||
}
|
||||
createDebPackages()
|
||||
createRpmPackages()
|
||||
}
|
||||
|
||||
func createPackage(options linuxPackageOptions) {
|
||||
@@ -358,10 +339,6 @@ func createPackage(options linuxPackageOptions) {
|
||||
name += "-enterprise"
|
||||
args = append(args, "--replaces", "grafana")
|
||||
}
|
||||
fmt.Printf("pkgArch is set to '%s', generated arch is '%s'\n", pkgArch, options.packageArch)
|
||||
if pkgArch == "armv6" {
|
||||
name += "-rpi"
|
||||
}
|
||||
args = append(args, "--name", name)
|
||||
|
||||
description := "Grafana"
|
||||
@@ -382,8 +359,8 @@ func createPackage(options linuxPackageOptions) {
|
||||
args = append(args, "--deb-no-default-config-files")
|
||||
}
|
||||
|
||||
if options.packageArch != "" {
|
||||
args = append(args, "-a", options.packageArch)
|
||||
if pkgArch != "" {
|
||||
args = append(args, "-a", pkgArch)
|
||||
}
|
||||
|
||||
if linuxPackageIteration != "" {
|
||||
@@ -421,17 +398,13 @@ func grunt(params ...string) {
|
||||
}
|
||||
}
|
||||
|
||||
func genPackageVersion() string {
|
||||
if includeBuildId {
|
||||
return fmt.Sprintf("%v-%v", linuxPackageVersion, linuxPackageIteration)
|
||||
} else {
|
||||
return version
|
||||
}
|
||||
}
|
||||
|
||||
func gruntBuildArg(task string) []string {
|
||||
args := []string{task}
|
||||
args = append(args, fmt.Sprintf("--pkgVer=%v", genPackageVersion()))
|
||||
if includeBuildId {
|
||||
args = append(args, fmt.Sprintf("--pkgVer=%v-%v", linuxPackageVersion, linuxPackageIteration))
|
||||
} else {
|
||||
args = append(args, fmt.Sprintf("--pkgVer=%v", version))
|
||||
}
|
||||
if pkgArch != "" {
|
||||
args = append(args, fmt.Sprintf("--arch=%v", pkgArch))
|
||||
}
|
||||
@@ -452,10 +425,6 @@ func setup() {
|
||||
runPrint("go", "install", "-v", "./pkg/cmd/grafana-server")
|
||||
}
|
||||
|
||||
func printGeneratedVersion() {
|
||||
fmt.Print(genPackageVersion())
|
||||
}
|
||||
|
||||
func test(pkg string) {
|
||||
setBuildEnv()
|
||||
runPrint("go", "test", "-short", "-timeout", "60s", pkg)
|
||||
|
||||
@@ -34,7 +34,7 @@ protocol = http
|
||||
# The ip address to bind to, empty will bind to all interfaces
|
||||
http_addr =
|
||||
|
||||
# The http port to use
|
||||
# The http port to use
|
||||
http_port = 3000
|
||||
|
||||
# The public facing domain name used to access grafana from a browser
|
||||
@@ -103,20 +103,6 @@ server_cert_name =
|
||||
# For "sqlite3" only, path relative to data_path setting
|
||||
path = grafana.db
|
||||
|
||||
# For "sqlite3" only. cache mode setting used for connecting to the database
|
||||
cache_mode = private
|
||||
|
||||
#################################### Cache server #############################
|
||||
[remote_cache]
|
||||
# Either "redis", "memcached" or "database" default is "database"
|
||||
type = database
|
||||
|
||||
# cache connectionstring options
|
||||
# database: will use Grafana primary database.
|
||||
# redis: config like redis server e.g. `addr=127.0.0.1:6379,pool_size=100,db=grafana`
|
||||
# memcache: 127.0.0.1:11211
|
||||
connstr =
|
||||
|
||||
#################################### Session #############################
|
||||
[session]
|
||||
# Either "memory", "file", "redis", "mysql", "postgres", "memcache", default is "file"
|
||||
@@ -154,12 +140,6 @@ conn_max_lifetime = 14400
|
||||
# This enables data proxy logging, default is false
|
||||
logging = false
|
||||
|
||||
# How long the data proxy should wait before timing out default is 30 (seconds)
|
||||
timeout = 30
|
||||
|
||||
# If enabled and user is not anonymous, data proxy will add X-Grafana-User header with username into the request, default is false.
|
||||
send_user_header = false
|
||||
|
||||
#################################### Analytics ###########################
|
||||
[analytics]
|
||||
# Server reporting, sends usage counters to stats.grafana.org every 24 hours.
|
||||
@@ -186,12 +166,17 @@ google_tag_manager_id =
|
||||
# default admin user, created on startup
|
||||
admin_user = admin
|
||||
|
||||
# default admin password, can be changed before first start of grafana, or in profile settings
|
||||
# default admin password, can be changed before first start of grafana, or in profile settings
|
||||
admin_password = admin
|
||||
|
||||
# used for signing
|
||||
secret_key = SW2YcwTIb9zpOOhoPsMm
|
||||
|
||||
# Auto-login remember days
|
||||
login_remember_days = 7
|
||||
cookie_username = grafana_user
|
||||
cookie_remember_name = grafana_remember
|
||||
|
||||
# disable gravatar profile images
|
||||
disable_gravatar = false
|
||||
|
||||
@@ -201,12 +186,6 @@ data_source_proxy_whitelist =
|
||||
# disable protection against brute force login attempts
|
||||
disable_brute_force_login_protection = false
|
||||
|
||||
# set to true if you host Grafana behind HTTPS. default is false.
|
||||
cookie_secure = false
|
||||
|
||||
# set cookie SameSite attribute. defaults to `lax`. can be set to "lax", "strict" and "none"
|
||||
cookie_samesite = lax
|
||||
|
||||
#################################### Snapshots ###########################
|
||||
[snapshots]
|
||||
# snapshot sharing options
|
||||
@@ -214,6 +193,10 @@ external_enabled = true
|
||||
external_snapshot_url = https://snapshots-origin.raintank.io
|
||||
external_snapshot_name = Publish to snapshot.raintank.io
|
||||
|
||||
# Set to true to enable this Grafana instance act as an external snapshot server and allow unauthenticated requests for
|
||||
# creating and deleting snapshots.
|
||||
public_mode = false
|
||||
|
||||
# remove expired snapshot
|
||||
snapshot_remove_expired = true
|
||||
|
||||
@@ -245,7 +228,6 @@ verify_email_enabled = false
|
||||
|
||||
# Background text for the user field on the login page
|
||||
login_hint = email or username
|
||||
password_hint = password
|
||||
|
||||
# Default UI theme ("dark" or "light")
|
||||
default_theme = dark
|
||||
@@ -258,22 +240,7 @@ external_manage_info =
|
||||
# Viewers can edit/inspect dashboard settings in the browser. But not save the dashboard.
|
||||
viewers_can_edit = false
|
||||
|
||||
# Editors can administrate dashboard, folders and teams they create
|
||||
editors_can_admin = false
|
||||
|
||||
[auth]
|
||||
# Login cookie name
|
||||
login_cookie_name = grafana_session
|
||||
|
||||
# The lifetime (days) an authenticated user can be inactive before being required to login at next visit. Default is 7 days.
|
||||
login_maximum_inactive_lifetime_days = 7
|
||||
|
||||
# The maximum lifetime (days) an authenticated user can be logged in since login time before being required to login. Default is 30 days.
|
||||
login_maximum_lifetime_days = 30
|
||||
|
||||
# How often should auth tokens be rotated for authenticated users when being active. The default is each 10 minutes.
|
||||
token_rotation_interval_minutes = 10
|
||||
|
||||
# Set to true to disable (hide) the login form, useful if you use OAuth
|
||||
disable_login_form = false
|
||||
|
||||
@@ -372,7 +339,6 @@ tls_skip_verify_insecure = false
|
||||
tls_client_cert =
|
||||
tls_client_key =
|
||||
tls_client_ca =
|
||||
send_client_credentials_via_post = false
|
||||
|
||||
#################################### Basic Auth ##########################
|
||||
[auth.basic]
|
||||
@@ -414,7 +380,7 @@ templates_pattern = emails/*.html
|
||||
|
||||
#################################### Logging ##########################
|
||||
[log]
|
||||
# Either "console", "file", "syslog". Default is console and file
|
||||
# Either "console", "file", "syslog". Default is console and file
|
||||
# Use space to separate multiple modes, e.g. "console file"
|
||||
mode = console file
|
||||
|
||||
@@ -524,7 +490,7 @@ concurrent_render_limit = 5
|
||||
#################################### Explore #############################
|
||||
[explore]
|
||||
# Enable the Explore section
|
||||
enabled = true
|
||||
enabled = false
|
||||
|
||||
#################################### Internal Grafana Metrics ############
|
||||
# Metrics available at HTTP API Url /metrics
|
||||
@@ -604,7 +570,7 @@ callback_url =
|
||||
|
||||
[panels]
|
||||
enable_alpha = false
|
||||
disable_sanitize_html = false
|
||||
|
||||
[enterprise]
|
||||
license_path =
|
||||
|
||||
|
||||
@@ -7,7 +7,7 @@ apiVersion: 1
|
||||
# orgId: 1
|
||||
|
||||
# # list of datasources to insert/update depending
|
||||
# # on what's available in the database
|
||||
# # on what's available in the datbase
|
||||
#datasources:
|
||||
# # <string, required> name of the datasource. Required
|
||||
# - name: Graphite
|
||||
|
||||
@@ -1,25 +0,0 @@
|
||||
# # config file version
|
||||
apiVersion: 1
|
||||
|
||||
# notifiers:
|
||||
# - name: default-slack-temp
|
||||
# type: slack
|
||||
# org_name: Main Org.
|
||||
# is_default: true
|
||||
# uid: notifier1
|
||||
# settings:
|
||||
# recipient: "XXX"
|
||||
# token: "xoxb"
|
||||
# uploadImage: true
|
||||
# url: https://slack.com
|
||||
# - name: default-email
|
||||
# type: email
|
||||
# org_id: 1
|
||||
# uid: notifier2
|
||||
# is_default: false
|
||||
# settings:
|
||||
# addresses: example11111@example.com
|
||||
# delete_notifiers:
|
||||
# - name: default-slack-temp
|
||||
# org_name: Main Org.
|
||||
# uid: notifier1
|
||||
@@ -99,20 +99,6 @@
|
||||
# Set to true to log the sql calls and execution times.
|
||||
log_queries =
|
||||
|
||||
# For "sqlite3" only. cache mode setting used for connecting to the database. (private, shared)
|
||||
;cache_mode = private
|
||||
|
||||
#################################### Cache server #############################
|
||||
[remote_cache]
|
||||
# Either "redis", "memcached" or "database" default is "database"
|
||||
;type = database
|
||||
|
||||
# cache connectionstring options
|
||||
# database: will use Grafana primary database.
|
||||
# redis: config like redis server e.g. `addr=127.0.0.1:6379,pool_size=100,db=grafana`
|
||||
# memcache: 127.0.0.1:11211
|
||||
;connstr =
|
||||
|
||||
#################################### Session ####################################
|
||||
[session]
|
||||
# Either "memory", "file", "redis", "mysql", "postgres", default is "file"
|
||||
@@ -141,12 +127,6 @@ log_queries =
|
||||
# This enables data proxy logging, default is false
|
||||
;logging = false
|
||||
|
||||
# How long the data proxy should wait before timing out default is 30 (seconds)
|
||||
;timeout = 30
|
||||
|
||||
# If enabled and user is not anonymous, data proxy will add X-Grafana-User header with username into the request, default is false.
|
||||
;send_user_header = false
|
||||
|
||||
#################################### Analytics ####################################
|
||||
[analytics]
|
||||
# Server reporting, sends usage counters to stats.grafana.org every 24 hours.
|
||||
@@ -165,9 +145,6 @@ log_queries =
|
||||
# Google Analytics universal tracking code, only enabled if you specify an id here
|
||||
;google_analytics_ua_id =
|
||||
|
||||
# Google Tag Manager ID, only enabled if you specify an id here
|
||||
;google_tag_manager_id =
|
||||
|
||||
#################################### Security ####################################
|
||||
[security]
|
||||
# default admin user, created on startup
|
||||
@@ -179,6 +156,11 @@ log_queries =
|
||||
# used for signing
|
||||
;secret_key = SW2YcwTIb9zpOOhoPsMm
|
||||
|
||||
# Auto-login remember days
|
||||
;login_remember_days = 7
|
||||
;cookie_username = grafana_user
|
||||
;cookie_remember_name = grafana_remember
|
||||
|
||||
# disable gravatar profile images
|
||||
;disable_gravatar = false
|
||||
|
||||
@@ -188,12 +170,6 @@ log_queries =
|
||||
# disable protection against brute force login attempts
|
||||
;disable_brute_force_login_protection = false
|
||||
|
||||
# set to true if you host Grafana behind HTTPS. default is false.
|
||||
;cookie_secure = false
|
||||
|
||||
# set cookie SameSite attribute. defaults to `lax`. can be set to "lax", "strict" and "none"
|
||||
;cookie_samesite = lax
|
||||
|
||||
#################################### Snapshots ###########################
|
||||
[snapshots]
|
||||
# snapshot sharing options
|
||||
@@ -201,6 +177,10 @@ log_queries =
|
||||
;external_snapshot_url = https://snapshots-origin.raintank.io
|
||||
;external_snapshot_name = Publish to snapshot.raintank.io
|
||||
|
||||
# Set to true to enable this Grafana instance act as an external snapshot server and allow unauthenticated requests for
|
||||
# creating and deleting snapshots.
|
||||
;public_mode = false
|
||||
|
||||
# remove expired snapshot
|
||||
;snapshot_remove_expired = true
|
||||
|
||||
@@ -225,7 +205,6 @@ log_queries =
|
||||
|
||||
# Background text for the user field on the login page
|
||||
;login_hint = email or username
|
||||
;password_hint = password
|
||||
|
||||
# Default UI theme ("dark" or "light")
|
||||
;default_theme = dark
|
||||
@@ -238,22 +217,7 @@ log_queries =
|
||||
# Viewers can edit/inspect dashboard settings in the browser. But not save the dashboard.
|
||||
;viewers_can_edit = false
|
||||
|
||||
# Editors can administrate dashboard, folders and teams they create
|
||||
;editors_can_admin = false
|
||||
|
||||
[auth]
|
||||
# Login cookie name
|
||||
;login_cookie_name = grafana_session
|
||||
|
||||
# The lifetime (days) an authenticated user can be inactive before being required to login at next visit. Default is 7 days,
|
||||
;login_maximum_inactive_lifetime_days = 7
|
||||
|
||||
# The maximum lifetime (days) an authenticated user can be logged in since login time before being required to login. Default is 30 days.
|
||||
;login_maximum_lifetime_days = 30
|
||||
|
||||
# How often should auth tokens be rotated for authenticated users when being active. The default is each 10 minutes.
|
||||
;token_rotation_interval_minutes = 10
|
||||
|
||||
# Set to true to disable (hide) the login form, useful if you use OAuth, defaults to false
|
||||
;disable_login_form = false
|
||||
|
||||
@@ -267,7 +231,7 @@ log_queries =
|
||||
# This setting is ignored if multiple OAuth providers are configured.
|
||||
;oauth_auto_login = false
|
||||
|
||||
#################################### Anonymous Auth ######################
|
||||
#################################### Anonymous Auth ##########################
|
||||
[auth.anonymous]
|
||||
# enable anonymous access
|
||||
;enabled = false
|
||||
@@ -321,10 +285,6 @@ log_queries =
|
||||
;tls_client_key =
|
||||
;tls_client_ca =
|
||||
|
||||
; Set to true to enable sending client_id and client_secret via POST body instead of Basic authentication HTTP header
|
||||
; This might be required if the OAuth provider is not RFC6749 compliant, only supporting credentials passed via POST payload
|
||||
;send_client_credentials_via_post = false
|
||||
|
||||
#################################### Grafana.com Auth ####################
|
||||
[auth.grafana_com]
|
||||
;enabled = false
|
||||
@@ -449,7 +409,7 @@ log_queries =
|
||||
#################################### Explore #############################
|
||||
[explore]
|
||||
# Enable the Explore section
|
||||
;enabled = true
|
||||
;enabled = false
|
||||
|
||||
#################################### Internal Grafana Metrics ##########################
|
||||
# Metrics available at HTTP API Url /metrics
|
||||
@@ -529,8 +489,3 @@ log_queries =
|
||||
# Path to a valid Grafana Enterprise license.jwt file
|
||||
;license_path =
|
||||
|
||||
[panels]
|
||||
;enable_alpha = false
|
||||
# If set to true Grafana will allow script tags in text panels. Not recommended as it enable XSS vulnerabilities.
|
||||
;disable_sanitize_html = false
|
||||
|
||||
|
||||
@@ -2,32 +2,15 @@ This folder contains useful scripts and configuration for...
|
||||
|
||||
* Configuring dev datasources in Grafana
|
||||
* Configuring dev & test scenarios dashboards.
|
||||
* Creating docker-compose file with DBs and fake data.
|
||||
|
||||
|
||||
# Dev dashboards and data sources
|
||||
|
||||
```bash
|
||||
./setup.sh
|
||||
```
|
||||
|
||||
After restarting grafana server there should now be a number of datasources named `gdev-<type>` provisioned as well as
|
||||
a dashboard folder named `gdev dashboards`. This folder contains dashboard & panel features tests dashboards.
|
||||
After restarting grafana server there should now be a number of datasources named `gdev-<type>` provisioned as well as a dashboard folder named `gdev dashboards`. This folder contains dashboard & panel features tests dashboards.
|
||||
|
||||
#### Dev dashboards
|
||||
# Dev dashboards
|
||||
|
||||
Please update these dashboards or make new ones as new panels & dashboards features are developed or new bugs are
|
||||
found. The dashboards are located in the `devenv/dev-dashboards` folder.
|
||||
Please update these dashboards or make new ones as new panels & dashboards features are developed or new bugs are found. The dashboards are located in the `devenv/dev-dashboards` folder.
|
||||
|
||||
# docker-compose with databases
|
||||
|
||||
```bash
|
||||
./create_docker_compose.sh influxdb prometheus2 elastic5
|
||||
docker-compose up
|
||||
```
|
||||
|
||||
This command will create a docker compose file with specified databases configured and ready to run. Each database has
|
||||
a prepared image with some fake data ready to use. For available databases see `docker/blocks` directory. Mind that
|
||||
for some databases there are multiple images, for example there is prometheus_mac specifically for Macs or different
|
||||
version.
|
||||
|
||||
|
||||
@@ -4,6 +4,6 @@ providers:
|
||||
- name: 'gdev dashboards'
|
||||
folder: 'gdev dashboards'
|
||||
type: file
|
||||
updateIntervalSeconds: 15
|
||||
options:
|
||||
path: devenv/dev-dashboards
|
||||
|
||||
|
||||
@@ -11,11 +11,11 @@ datasources:
|
||||
- name: gdev-prometheus
|
||||
type: prometheus
|
||||
access: proxy
|
||||
isDefault: true
|
||||
url: http://localhost:9090
|
||||
|
||||
- name: gdev-testdata
|
||||
type: testdata
|
||||
isDefault: true
|
||||
|
||||
- name: gdev-influxdb
|
||||
type: influxdb
|
||||
@@ -35,7 +35,7 @@ datasources:
|
||||
tsdbResolution: 1
|
||||
tsdbVersion: 1
|
||||
|
||||
- name: gdev-elasticsearch-v2-metrics
|
||||
- name: gdev-elasticsearch-metrics
|
||||
type: elasticsearch
|
||||
access: proxy
|
||||
database: "[metrics-]YYYY.MM.DD"
|
||||
@@ -43,57 +43,6 @@ datasources:
|
||||
jsonData:
|
||||
interval: Daily
|
||||
timeField: "@timestamp"
|
||||
esVersion: 2
|
||||
|
||||
- name: gdev-elasticsearch-v2-logs
|
||||
type: elasticsearch
|
||||
access: proxy
|
||||
database: "[logs-]YYYY.MM.DD"
|
||||
url: http://localhost:9200
|
||||
jsonData:
|
||||
interval: Daily
|
||||
timeField: "@timestamp"
|
||||
esVersion: 2
|
||||
|
||||
- name: gdev-elasticsearch-v5-metrics
|
||||
type: elasticsearch
|
||||
access: proxy
|
||||
database: "[metrics-]YYYY.MM.DD"
|
||||
url: http://localhost:10200
|
||||
jsonData:
|
||||
interval: Daily
|
||||
timeField: "@timestamp"
|
||||
esVersion: 5
|
||||
|
||||
- name: gdev-elasticsearch-v5-logs
|
||||
type: elasticsearch
|
||||
access: proxy
|
||||
database: "[logs-]YYYY.MM.DD"
|
||||
url: http://localhost:10200
|
||||
jsonData:
|
||||
interval: Daily
|
||||
timeField: "@timestamp"
|
||||
esVersion: 5
|
||||
|
||||
- name: gdev-elasticsearch-v6-metrics
|
||||
type: elasticsearch
|
||||
access: proxy
|
||||
database: "[metrics-]YYYY.MM.DD"
|
||||
url: http://localhost:11200
|
||||
jsonData:
|
||||
interval: Daily
|
||||
timeField: "@timestamp"
|
||||
esVersion: 60
|
||||
|
||||
- name: gdev-elasticsearch-v6-logs
|
||||
type: elasticsearch
|
||||
access: proxy
|
||||
database: "[logs-]YYYY.MM.DD"
|
||||
url: http://localhost:11200
|
||||
jsonData:
|
||||
interval: Daily
|
||||
timeField: "@timestamp"
|
||||
esVersion: 60
|
||||
|
||||
- name: gdev-mysql
|
||||
type: mysql
|
||||
@@ -152,10 +101,4 @@ datasources:
|
||||
authType: credentials
|
||||
defaultRegion: eu-west-2
|
||||
|
||||
- name: gdev-loki
|
||||
type: loki
|
||||
access: proxy
|
||||
url: http://localhost:3100
|
||||
editable: false
|
||||
|
||||
|
||||
|
||||
File diff suppressed because it is too large
Load Diff
@@ -1,510 +0,0 @@
|
||||
{
|
||||
"annotations": {
|
||||
"list": [
|
||||
{
|
||||
"builtIn": 1,
|
||||
"datasource": "-- Grafana --",
|
||||
"enable": true,
|
||||
"hide": true,
|
||||
"iconColor": "rgba(0, 211, 255, 1)",
|
||||
"name": "Annotations & Alerts",
|
||||
"type": "dashboard"
|
||||
}
|
||||
]
|
||||
},
|
||||
"editable": true,
|
||||
"gnetId": null,
|
||||
"graphTooltip": 0,
|
||||
"links": [],
|
||||
"panels": [
|
||||
{
|
||||
"aliasColors": {},
|
||||
"bars": false,
|
||||
"dashLength": 10,
|
||||
"dashes": false,
|
||||
"datasource": "gdev-testdata",
|
||||
"fill": 2,
|
||||
"gridPos": {
|
||||
"h": 8,
|
||||
"w": 24,
|
||||
"x": 0,
|
||||
"y": 0
|
||||
},
|
||||
"id": 2,
|
||||
"legend": {
|
||||
"avg": false,
|
||||
"current": false,
|
||||
"max": false,
|
||||
"min": false,
|
||||
"show": true,
|
||||
"total": false,
|
||||
"values": false
|
||||
},
|
||||
"lines": true,
|
||||
"linewidth": 2,
|
||||
"links": [],
|
||||
"nullPointMode": "null",
|
||||
"percentage": false,
|
||||
"pointradius": 5,
|
||||
"points": false,
|
||||
"renderer": "flot",
|
||||
"seriesOverrides": [],
|
||||
"spaceLength": 10,
|
||||
"stack": false,
|
||||
"steppedLine": false,
|
||||
"targets": [
|
||||
{
|
||||
"refId": "A",
|
||||
"scenarioId": "random_walk",
|
||||
"target": ""
|
||||
}
|
||||
],
|
||||
"thresholds": [],
|
||||
"timeFrom": null,
|
||||
"timeRegions": [
|
||||
{
|
||||
"colorMode": "gray",
|
||||
"fill": true,
|
||||
"fillColor": "rgba(255, 255, 255, 0.03)",
|
||||
"from": "08:30",
|
||||
"fromDayOfWeek": 1,
|
||||
"line": false,
|
||||
"lineColor": "rgba(255, 255, 255, 0.2)",
|
||||
"op": "time",
|
||||
"to": "16:45",
|
||||
"toDayOfWeek": 5
|
||||
}
|
||||
],
|
||||
"timeShift": null,
|
||||
"title": "Business Hours",
|
||||
"tooltip": {
|
||||
"shared": true,
|
||||
"sort": 0,
|
||||
"value_type": "individual"
|
||||
},
|
||||
"type": "graph",
|
||||
"xaxis": {
|
||||
"buckets": null,
|
||||
"mode": "time",
|
||||
"name": null,
|
||||
"show": true,
|
||||
"values": []
|
||||
},
|
||||
"yaxes": [
|
||||
{
|
||||
"format": "short",
|
||||
"label": null,
|
||||
"logBase": 1,
|
||||
"max": null,
|
||||
"min": null,
|
||||
"show": true
|
||||
},
|
||||
{
|
||||
"format": "short",
|
||||
"label": null,
|
||||
"logBase": 1,
|
||||
"max": null,
|
||||
"min": null,
|
||||
"show": true
|
||||
}
|
||||
],
|
||||
"yaxis": {
|
||||
"align": false,
|
||||
"alignLevel": null
|
||||
}
|
||||
},
|
||||
{
|
||||
"aliasColors": {},
|
||||
"bars": false,
|
||||
"dashLength": 10,
|
||||
"dashes": false,
|
||||
"datasource": "gdev-testdata",
|
||||
"fill": 2,
|
||||
"gridPos": {
|
||||
"h": 8,
|
||||
"w": 24,
|
||||
"x": 0,
|
||||
"y": 8
|
||||
},
|
||||
"id": 4,
|
||||
"legend": {
|
||||
"avg": false,
|
||||
"current": false,
|
||||
"max": false,
|
||||
"min": false,
|
||||
"show": true,
|
||||
"total": false,
|
||||
"values": false
|
||||
},
|
||||
"lines": true,
|
||||
"linewidth": 2,
|
||||
"links": [],
|
||||
"nullPointMode": "null",
|
||||
"percentage": false,
|
||||
"pointradius": 5,
|
||||
"points": false,
|
||||
"renderer": "flot",
|
||||
"seriesOverrides": [],
|
||||
"spaceLength": 10,
|
||||
"stack": false,
|
||||
"steppedLine": false,
|
||||
"targets": [
|
||||
{
|
||||
"expr": "",
|
||||
"format": "time_series",
|
||||
"intervalFactor": 1,
|
||||
"refId": "A",
|
||||
"scenarioId": "random_walk",
|
||||
"target": ""
|
||||
}
|
||||
],
|
||||
"thresholds": [],
|
||||
"timeFrom": null,
|
||||
"timeRegions": [
|
||||
{
|
||||
"colorMode": "red",
|
||||
"fill": true,
|
||||
"fillColor": "rgba(255, 255, 255, 0.03)",
|
||||
"from": "20:00",
|
||||
"fromDayOfWeek": 7,
|
||||
"line": false,
|
||||
"lineColor": "rgba(255, 255, 255, 0.2)",
|
||||
"op": "time",
|
||||
"to": "23:00",
|
||||
"toDayOfWeek": 7
|
||||
}
|
||||
],
|
||||
"timeShift": null,
|
||||
"title": "Sunday's 20-23",
|
||||
"tooltip": {
|
||||
"shared": true,
|
||||
"sort": 0,
|
||||
"value_type": "individual"
|
||||
},
|
||||
"type": "graph",
|
||||
"xaxis": {
|
||||
"buckets": null,
|
||||
"mode": "time",
|
||||
"name": null,
|
||||
"show": true,
|
||||
"values": []
|
||||
},
|
||||
"yaxes": [
|
||||
{
|
||||
"format": "short",
|
||||
"label": null,
|
||||
"logBase": 1,
|
||||
"max": null,
|
||||
"min": null,
|
||||
"show": true
|
||||
},
|
||||
{
|
||||
"format": "short",
|
||||
"label": null,
|
||||
"logBase": 1,
|
||||
"max": null,
|
||||
"min": null,
|
||||
"show": true
|
||||
}
|
||||
],
|
||||
"yaxis": {
|
||||
"align": false,
|
||||
"alignLevel": null
|
||||
}
|
||||
},
|
||||
{
|
||||
"aliasColors": {
|
||||
"A-series": "#d683ce"
|
||||
},
|
||||
"bars": false,
|
||||
"dashLength": 10,
|
||||
"dashes": false,
|
||||
"datasource": "gdev-testdata",
|
||||
"fill": 2,
|
||||
"gridPos": {
|
||||
"h": 8,
|
||||
"w": 24,
|
||||
"x": 0,
|
||||
"y": 16
|
||||
},
|
||||
"id": 3,
|
||||
"legend": {
|
||||
"avg": false,
|
||||
"current": false,
|
||||
"max": false,
|
||||
"min": false,
|
||||
"show": true,
|
||||
"total": false,
|
||||
"values": false
|
||||
},
|
||||
"lines": true,
|
||||
"linewidth": 2,
|
||||
"links": [],
|
||||
"nullPointMode": "null",
|
||||
"percentage": false,
|
||||
"pointradius": 0.5,
|
||||
"points": false,
|
||||
"renderer": "flot",
|
||||
"seriesOverrides": [],
|
||||
"spaceLength": 10,
|
||||
"stack": false,
|
||||
"steppedLine": false,
|
||||
"targets": [
|
||||
{
|
||||
"refId": "A",
|
||||
"scenarioId": "random_walk",
|
||||
"target": ""
|
||||
}
|
||||
],
|
||||
"thresholds": [],
|
||||
"timeFrom": null,
|
||||
"timeRegions": [
|
||||
{
|
||||
"colorMode": "custom",
|
||||
"fill": true,
|
||||
"fillColor": "rgba(255, 0, 0, 0.22)",
|
||||
"from": "",
|
||||
"fromDayOfWeek": 1,
|
||||
"line": true,
|
||||
"lineColor": "rgba(255, 0, 0, 0.32)",
|
||||
"op": "time",
|
||||
"to": "",
|
||||
"toDayOfWeek": 1
|
||||
},
|
||||
{
|
||||
"colorMode": "custom",
|
||||
"fill": true,
|
||||
"fillColor": "rgba(255, 127, 0, 0.22)",
|
||||
"fromDayOfWeek": 2,
|
||||
"line": true,
|
||||
"lineColor": "rgba(255, 127, 0, 0.32)",
|
||||
"op": "time",
|
||||
"toDayOfWeek": 2
|
||||
},
|
||||
{
|
||||
"colorMode": "custom",
|
||||
"fill": true,
|
||||
"fillColor": "rgba(255, 255, 0, 0.22)",
|
||||
"fromDayOfWeek": 3,
|
||||
"line": true,
|
||||
"lineColor": "rgba(255, 255, 0, 0.22)",
|
||||
"op": "time",
|
||||
"toDayOfWeek": 3
|
||||
},
|
||||
{
|
||||
"colorMode": "custom",
|
||||
"fill": true,
|
||||
"fillColor": "rgba(0, 255, 0, 0.22)",
|
||||
"fromDayOfWeek": 4,
|
||||
"line": true,
|
||||
"lineColor": "rgba(0, 255, 0, 0.32)",
|
||||
"op": "time",
|
||||
"toDayOfWeek": 4
|
||||
},
|
||||
{
|
||||
"colorMode": "custom",
|
||||
"fill": true,
|
||||
"fillColor": "rgba(0, 0, 255, 0.22)",
|
||||
"fromDayOfWeek": 5,
|
||||
"line": true,
|
||||
"lineColor": "rgba(0, 0, 255, 0.32)",
|
||||
"op": "time",
|
||||
"toDayOfWeek": 5
|
||||
},
|
||||
{
|
||||
"colorMode": "custom",
|
||||
"fill": true,
|
||||
"fillColor": "rgba(75, 0, 130, 0.22)",
|
||||
"fromDayOfWeek": 6,
|
||||
"line": true,
|
||||
"lineColor": "rgba(75, 0, 130, 0.32)",
|
||||
"op": "time",
|
||||
"toDayOfWeek": 6
|
||||
},
|
||||
{
|
||||
"colorMode": "custom",
|
||||
"fill": true,
|
||||
"fillColor": "rgba(148, 0, 211, 0.22)",
|
||||
"fromDayOfWeek": 7,
|
||||
"line": true,
|
||||
"lineColor": "rgba(148, 0, 211, 0.32)",
|
||||
"op": "time",
|
||||
"toDayOfWeek": 7
|
||||
}
|
||||
],
|
||||
"timeShift": null,
|
||||
"title": "Each day of week",
|
||||
"tooltip": {
|
||||
"shared": true,
|
||||
"sort": 0,
|
||||
"value_type": "individual"
|
||||
},
|
||||
"type": "graph",
|
||||
"xaxis": {
|
||||
"buckets": null,
|
||||
"mode": "time",
|
||||
"name": null,
|
||||
"show": true,
|
||||
"values": []
|
||||
},
|
||||
"yaxes": [
|
||||
{
|
||||
"format": "short",
|
||||
"label": null,
|
||||
"logBase": 1,
|
||||
"max": null,
|
||||
"min": null,
|
||||
"show": true
|
||||
},
|
||||
{
|
||||
"format": "short",
|
||||
"label": null,
|
||||
"logBase": 1,
|
||||
"max": null,
|
||||
"min": null,
|
||||
"show": true
|
||||
}
|
||||
],
|
||||
"yaxis": {
|
||||
"align": false,
|
||||
"alignLevel": null
|
||||
}
|
||||
},
|
||||
{
|
||||
"aliasColors": {},
|
||||
"bars": false,
|
||||
"dashLength": 10,
|
||||
"dashes": false,
|
||||
"datasource": "gdev-testdata",
|
||||
"fill": 2,
|
||||
"gridPos": {
|
||||
"h": 8,
|
||||
"w": 24,
|
||||
"x": 0,
|
||||
"y": 24
|
||||
},
|
||||
"id": 5,
|
||||
"legend": {
|
||||
"avg": false,
|
||||
"current": false,
|
||||
"max": false,
|
||||
"min": false,
|
||||
"show": true,
|
||||
"total": false,
|
||||
"values": false
|
||||
},
|
||||
"lines": true,
|
||||
"linewidth": 2,
|
||||
"links": [],
|
||||
"nullPointMode": "null",
|
||||
"percentage": false,
|
||||
"pointradius": 5,
|
||||
"points": false,
|
||||
"renderer": "flot",
|
||||
"seriesOverrides": [],
|
||||
"spaceLength": 10,
|
||||
"stack": false,
|
||||
"steppedLine": false,
|
||||
"targets": [
|
||||
{
|
||||
"expr": "",
|
||||
"format": "time_series",
|
||||
"intervalFactor": 1,
|
||||
"refId": "A",
|
||||
"scenarioId": "random_walk",
|
||||
"target": ""
|
||||
}
|
||||
],
|
||||
"thresholds": [],
|
||||
"timeFrom": null,
|
||||
"timeRegions": [
|
||||
{
|
||||
"colorMode": "red",
|
||||
"fill": false,
|
||||
"from": "05:00",
|
||||
"line": true,
|
||||
"op": "time"
|
||||
}
|
||||
],
|
||||
"timeShift": null,
|
||||
"title": "05:00",
|
||||
"tooltip": {
|
||||
"shared": true,
|
||||
"sort": 0,
|
||||
"value_type": "individual"
|
||||
},
|
||||
"type": "graph",
|
||||
"xaxis": {
|
||||
"buckets": null,
|
||||
"mode": "time",
|
||||
"name": null,
|
||||
"show": true,
|
||||
"values": []
|
||||
},
|
||||
"yaxes": [
|
||||
{
|
||||
"format": "short",
|
||||
"label": null,
|
||||
"logBase": 1,
|
||||
"max": null,
|
||||
"min": null,
|
||||
"show": true
|
||||
},
|
||||
{
|
||||
"format": "short",
|
||||
"label": null,
|
||||
"logBase": 1,
|
||||
"max": null,
|
||||
"min": null,
|
||||
"show": true
|
||||
}
|
||||
],
|
||||
"yaxis": {
|
||||
"align": false,
|
||||
"alignLevel": null
|
||||
}
|
||||
}
|
||||
],
|
||||
"refresh": false,
|
||||
"schemaVersion": 16,
|
||||
"style": "dark",
|
||||
"tags": [
|
||||
"gdev",
|
||||
"panel-tests"
|
||||
],
|
||||
"templating": {
|
||||
"list": []
|
||||
},
|
||||
"time": {
|
||||
"from": "now-30d",
|
||||
"to": "now"
|
||||
},
|
||||
"timepicker": {
|
||||
"refresh_intervals": [
|
||||
"5s",
|
||||
"10s",
|
||||
"30s",
|
||||
"1m",
|
||||
"5m",
|
||||
"15m",
|
||||
"30m",
|
||||
"1h",
|
||||
"2h",
|
||||
"1d"
|
||||
],
|
||||
"time_options": [
|
||||
"5m",
|
||||
"15m",
|
||||
"1h",
|
||||
"6h",
|
||||
"12h",
|
||||
"24h",
|
||||
"2d",
|
||||
"7d",
|
||||
"30d"
|
||||
]
|
||||
},
|
||||
"timezone": "browser",
|
||||
"title": "Panel Tests - Graph (Time Regions)",
|
||||
"version": 1
|
||||
}
|
||||
File diff suppressed because it is too large
Load Diff
File diff suppressed because it is too large
Load Diff
@@ -1,649 +0,0 @@
|
||||
{
|
||||
"annotations": {
|
||||
"list": [
|
||||
{
|
||||
"builtIn": 1,
|
||||
"datasource": "-- Grafana --",
|
||||
"enable": false,
|
||||
"hide": true,
|
||||
"iconColor": "rgba(0, 211, 255, 1)",
|
||||
"limit": 100,
|
||||
"name": "Annotations & Alerts",
|
||||
"showIn": 0,
|
||||
"type": "dashboard"
|
||||
},
|
||||
{
|
||||
"datasource": "Elastic 5 Logs",
|
||||
"enable": false,
|
||||
"iconColor": "rgba(255, 96, 96, 1)",
|
||||
"limit": 100,
|
||||
"name": "test",
|
||||
"query": "",
|
||||
"showIn": 0,
|
||||
"textField": "description",
|
||||
"type": "alert"
|
||||
}
|
||||
]
|
||||
},
|
||||
"editable": true,
|
||||
"gnetId": null,
|
||||
"graphTooltip": 0,
|
||||
"iteration": 1542303970887,
|
||||
"links": [
|
||||
{
|
||||
"icon": "external link",
|
||||
"tags": [
|
||||
"gdev",
|
||||
"elasticsearch"
|
||||
],
|
||||
"type": "dashboards"
|
||||
}
|
||||
],
|
||||
"panels": [
|
||||
{
|
||||
"aliasColors": {},
|
||||
"bars": false,
|
||||
"dashLength": 10,
|
||||
"dashes": false,
|
||||
"datasource": "gdev-elasticsearch-v2-metrics",
|
||||
"editable": true,
|
||||
"error": false,
|
||||
"fill": 1,
|
||||
"grid": {},
|
||||
"gridPos": {
|
||||
"h": 7,
|
||||
"w": 24,
|
||||
"x": 0,
|
||||
"y": 0
|
||||
},
|
||||
"id": 1,
|
||||
"legend": {
|
||||
"alignAsTable": true,
|
||||
"avg": false,
|
||||
"current": false,
|
||||
"max": true,
|
||||
"min": false,
|
||||
"rightSide": true,
|
||||
"show": true,
|
||||
"total": false,
|
||||
"values": true
|
||||
},
|
||||
"lines": true,
|
||||
"linewidth": 2,
|
||||
"links": [],
|
||||
"nullPointMode": "connected",
|
||||
"percentage": false,
|
||||
"pointradius": 5,
|
||||
"points": false,
|
||||
"renderer": "flot",
|
||||
"seriesOverrides": [],
|
||||
"spaceLength": 10,
|
||||
"stack": false,
|
||||
"steppedLine": false,
|
||||
"targets": [
|
||||
{
|
||||
"bucketAggs": [
|
||||
{
|
||||
"field": "@hostname",
|
||||
"id": "3",
|
||||
"settings": {
|
||||
"min_doc_count": 1,
|
||||
"order": "asc",
|
||||
"orderBy": "1",
|
||||
"size": "5"
|
||||
},
|
||||
"type": "terms"
|
||||
},
|
||||
{
|
||||
"field": "@timestamp",
|
||||
"id": "2",
|
||||
"settings": {
|
||||
"interval": "auto",
|
||||
"min_doc_count": 0,
|
||||
"trimEdges": 0
|
||||
},
|
||||
"type": "date_histogram"
|
||||
}
|
||||
],
|
||||
"dsType": "elasticsearch",
|
||||
"metrics": [
|
||||
{
|
||||
"field": "@value",
|
||||
"id": "1",
|
||||
"meta": {},
|
||||
"settings": {},
|
||||
"type": "max"
|
||||
}
|
||||
],
|
||||
"query": "*",
|
||||
"refId": "A",
|
||||
"target": "",
|
||||
"timeField": "@timestamp"
|
||||
}
|
||||
],
|
||||
"thresholds": [],
|
||||
"timeFrom": null,
|
||||
"timeRegions": [],
|
||||
"timeShift": null,
|
||||
"title": "Top 5 servers",
|
||||
"tooltip": {
|
||||
"msResolution": true,
|
||||
"shared": true,
|
||||
"sort": 0,
|
||||
"value_type": "cumulative"
|
||||
},
|
||||
"type": "graph",
|
||||
"xaxis": {
|
||||
"buckets": null,
|
||||
"mode": "time",
|
||||
"name": null,
|
||||
"show": true,
|
||||
"values": []
|
||||
},
|
||||
"yaxes": [
|
||||
{
|
||||
"format": "short",
|
||||
"logBase": 1,
|
||||
"max": null,
|
||||
"min": null,
|
||||
"show": true
|
||||
},
|
||||
{
|
||||
"format": "short",
|
||||
"logBase": 1,
|
||||
"max": null,
|
||||
"min": null,
|
||||
"show": true
|
||||
}
|
||||
],
|
||||
"yaxis": {
|
||||
"align": false,
|
||||
"alignLevel": null
|
||||
}
|
||||
},
|
||||
{
|
||||
"aliasColors": {
|
||||
"Count": "#6ED0E0"
|
||||
},
|
||||
"bars": false,
|
||||
"dashLength": 10,
|
||||
"dashes": false,
|
||||
"datasource": "gdev-elasticsearch-v2-metrics",
|
||||
"editable": true,
|
||||
"error": false,
|
||||
"fill": 1,
|
||||
"grid": {},
|
||||
"gridPos": {
|
||||
"h": 6,
|
||||
"w": 12,
|
||||
"x": 0,
|
||||
"y": 7
|
||||
},
|
||||
"id": 2,
|
||||
"legend": {
|
||||
"alignAsTable": true,
|
||||
"avg": true,
|
||||
"current": false,
|
||||
"max": false,
|
||||
"min": false,
|
||||
"rightSide": true,
|
||||
"show": true,
|
||||
"total": false,
|
||||
"values": true
|
||||
},
|
||||
"lines": true,
|
||||
"linewidth": 2,
|
||||
"links": [],
|
||||
"nullPointMode": "connected",
|
||||
"percentage": false,
|
||||
"pointradius": 5,
|
||||
"points": false,
|
||||
"renderer": "flot",
|
||||
"seriesOverrides": [
|
||||
{
|
||||
"alias": "Count",
|
||||
"lines": false,
|
||||
"yaxis": 2,
|
||||
"zindex": -1
|
||||
}
|
||||
],
|
||||
"spaceLength": 10,
|
||||
"stack": false,
|
||||
"steppedLine": false,
|
||||
"targets": [
|
||||
{
|
||||
"alias": "{{metric}}",
|
||||
"bucketAggs": [
|
||||
{
|
||||
"field": "@timestamp",
|
||||
"id": "2",
|
||||
"settings": {
|
||||
"interval": "5m",
|
||||
"min_doc_count": 0,
|
||||
"trimEdges": 0
|
||||
},
|
||||
"type": "date_histogram"
|
||||
}
|
||||
],
|
||||
"dsType": "elasticsearch",
|
||||
"metrics": [
|
||||
{
|
||||
"field": "@value",
|
||||
"id": "1",
|
||||
"meta": {},
|
||||
"settings": {
|
||||
"percents": [
|
||||
25,
|
||||
50,
|
||||
75,
|
||||
95,
|
||||
99
|
||||
]
|
||||
},
|
||||
"type": "percentiles"
|
||||
}
|
||||
],
|
||||
"query": "@metric:cpu",
|
||||
"refId": "A",
|
||||
"target": "",
|
||||
"timeField": "@timestamp"
|
||||
}
|
||||
],
|
||||
"thresholds": [],
|
||||
"timeFrom": null,
|
||||
"timeRegions": [],
|
||||
"timeShift": null,
|
||||
"title": "Percentiles & Metric filter",
|
||||
"tooltip": {
|
||||
"msResolution": false,
|
||||
"shared": true,
|
||||
"sort": 0,
|
||||
"value_type": "cumulative"
|
||||
},
|
||||
"type": "graph",
|
||||
"xaxis": {
|
||||
"buckets": null,
|
||||
"mode": "time",
|
||||
"name": null,
|
||||
"show": true,
|
||||
"values": []
|
||||
},
|
||||
"yaxes": [
|
||||
{
|
||||
"format": "short",
|
||||
"logBase": 1,
|
||||
"max": null,
|
||||
"min": null,
|
||||
"show": true
|
||||
},
|
||||
{
|
||||
"format": "short",
|
||||
"logBase": 1,
|
||||
"max": null,
|
||||
"min": null,
|
||||
"show": true
|
||||
}
|
||||
],
|
||||
"yaxis": {
|
||||
"align": false,
|
||||
"alignLevel": null
|
||||
}
|
||||
},
|
||||
{
|
||||
"aliasColors": {
|
||||
"Count": "#6ED0E0"
|
||||
},
|
||||
"bars": false,
|
||||
"dashLength": 10,
|
||||
"dashes": false,
|
||||
"datasource": "gdev-elasticsearch-v2-metrics",
|
||||
"editable": true,
|
||||
"error": false,
|
||||
"fill": 1,
|
||||
"grid": {},
|
||||
"gridPos": {
|
||||
"h": 6,
|
||||
"w": 12,
|
||||
"x": 12,
|
||||
"y": 7
|
||||
},
|
||||
"id": 3,
|
||||
"legend": {
|
||||
"alignAsTable": true,
|
||||
"avg": true,
|
||||
"current": false,
|
||||
"max": false,
|
||||
"min": false,
|
||||
"rightSide": true,
|
||||
"show": true,
|
||||
"total": false,
|
||||
"values": true
|
||||
},
|
||||
"lines": true,
|
||||
"linewidth": 2,
|
||||
"links": [],
|
||||
"nullPointMode": "connected",
|
||||
"percentage": false,
|
||||
"pointradius": 5,
|
||||
"points": false,
|
||||
"renderer": "flot",
|
||||
"seriesOverrides": [
|
||||
{
|
||||
"alias": "Count",
|
||||
"lines": false,
|
||||
"yaxis": 2,
|
||||
"zindex": -1
|
||||
}
|
||||
],
|
||||
"spaceLength": 10,
|
||||
"stack": false,
|
||||
"steppedLine": false,
|
||||
"targets": [
|
||||
{
|
||||
"alias": "{{metric}}",
|
||||
"bucketAggs": [
|
||||
{
|
||||
"field": "@timestamp",
|
||||
"id": "2",
|
||||
"settings": {
|
||||
"interval": "auto",
|
||||
"min_doc_count": 0,
|
||||
"trimEdges": 0
|
||||
},
|
||||
"type": "date_histogram"
|
||||
}
|
||||
],
|
||||
"dsType": "elasticsearch",
|
||||
"metrics": [
|
||||
{
|
||||
"field": "@value",
|
||||
"id": "1",
|
||||
"meta": {
|
||||
"std_deviation_bounds_lower": true,
|
||||
"std_deviation_bounds_upper": true
|
||||
},
|
||||
"settings": {},
|
||||
"type": "extended_stats"
|
||||
}
|
||||
],
|
||||
"query": "@metric:cpu",
|
||||
"refId": "A",
|
||||
"target": "",
|
||||
"timeField": "@timestamp"
|
||||
}
|
||||
],
|
||||
"thresholds": [],
|
||||
"timeFrom": null,
|
||||
"timeRegions": [],
|
||||
"timeShift": null,
|
||||
"title": "Standard dev",
|
||||
"tooltip": {
|
||||
"msResolution": true,
|
||||
"shared": true,
|
||||
"sort": 0,
|
||||
"value_type": "cumulative"
|
||||
},
|
||||
"type": "graph",
|
||||
"xaxis": {
|
||||
"buckets": null,
|
||||
"mode": "time",
|
||||
"name": null,
|
||||
"show": true,
|
||||
"values": []
|
||||
},
|
||||
"yaxes": [
|
||||
{
|
||||
"format": "short",
|
||||
"logBase": 1,
|
||||
"max": null,
|
||||
"min": null,
|
||||
"show": true
|
||||
},
|
||||
{
|
||||
"format": "short",
|
||||
"logBase": 1,
|
||||
"max": null,
|
||||
"min": null,
|
||||
"show": true
|
||||
}
|
||||
],
|
||||
"yaxis": {
|
||||
"align": false,
|
||||
"alignLevel": null
|
||||
}
|
||||
},
|
||||
{
|
||||
"columns": [
|
||||
{
|
||||
"text": "@hostname",
|
||||
"value": "@hostname"
|
||||
},
|
||||
{
|
||||
"text": "Average",
|
||||
"value": "Average"
|
||||
},
|
||||
{
|
||||
"text": "Max",
|
||||
"value": "Max"
|
||||
},
|
||||
{
|
||||
"text": "Sum",
|
||||
"value": "Sum"
|
||||
}
|
||||
],
|
||||
"datasource": "gdev-elasticsearch-v2-metrics",
|
||||
"editable": true,
|
||||
"error": false,
|
||||
"fontSize": "100%",
|
||||
"gridPos": {
|
||||
"h": 7,
|
||||
"w": 24,
|
||||
"x": 0,
|
||||
"y": 13
|
||||
},
|
||||
"id": 6,
|
||||
"links": [],
|
||||
"pageSize": null,
|
||||
"scroll": true,
|
||||
"showHeader": true,
|
||||
"sort": {
|
||||
"col": 0,
|
||||
"desc": true
|
||||
},
|
||||
"styles": [
|
||||
{
|
||||
"dateFormat": "YYYY-MM-DD HH:mm:ss",
|
||||
"pattern": "@timestamp",
|
||||
"type": "date"
|
||||
},
|
||||
{
|
||||
"colorMode": null,
|
||||
"colors": [
|
||||
"rgba(245, 54, 54, 0.9)",
|
||||
"rgba(237, 129, 40, 0.89)",
|
||||
"rgba(50, 172, 45, 0.97)"
|
||||
],
|
||||
"dateFormat": "YYYY-MM-DD HH:mm:ss",
|
||||
"decimals": 2,
|
||||
"pattern": "/.*/",
|
||||
"thresholds": [],
|
||||
"type": "number",
|
||||
"unit": "short"
|
||||
}
|
||||
],
|
||||
"targets": [
|
||||
{
|
||||
"bucketAggs": [
|
||||
{
|
||||
"field": "@hostname",
|
||||
"id": "2",
|
||||
"settings": {
|
||||
"min_doc_count": 1,
|
||||
"order": "asc",
|
||||
"orderBy": "_term",
|
||||
"size": "0"
|
||||
},
|
||||
"type": "terms"
|
||||
}
|
||||
],
|
||||
"dsType": "elasticsearch",
|
||||
"metrics": [
|
||||
{
|
||||
"field": "@value",
|
||||
"id": "1",
|
||||
"meta": {},
|
||||
"settings": {},
|
||||
"type": "avg"
|
||||
},
|
||||
{
|
||||
"field": "@value",
|
||||
"id": "3",
|
||||
"meta": {},
|
||||
"settings": {},
|
||||
"type": "max"
|
||||
},
|
||||
{
|
||||
"field": "@value",
|
||||
"id": "4",
|
||||
"meta": {},
|
||||
"settings": {},
|
||||
"type": "sum"
|
||||
}
|
||||
],
|
||||
"refId": "B",
|
||||
"timeField": "@timestamp"
|
||||
}
|
||||
],
|
||||
"title": "ES Metrics",
|
||||
"transform": "table",
|
||||
"type": "table"
|
||||
},
|
||||
{
|
||||
"columns": [
|
||||
{
|
||||
"text": "@timestamp",
|
||||
"value": "@timestamp"
|
||||
},
|
||||
{
|
||||
"text": "@message",
|
||||
"value": "@message"
|
||||
},
|
||||
{
|
||||
"text": "tags",
|
||||
"value": "tags"
|
||||
},
|
||||
{
|
||||
"text": "description",
|
||||
"value": "description"
|
||||
}
|
||||
],
|
||||
"datasource": "gdev-elasticsearch-v2-logs",
|
||||
"editable": true,
|
||||
"error": false,
|
||||
"fontSize": "100%",
|
||||
"gridPos": {
|
||||
"h": 7,
|
||||
"w": 24,
|
||||
"x": 0,
|
||||
"y": 20
|
||||
},
|
||||
"id": 5,
|
||||
"links": [],
|
||||
"pageSize": null,
|
||||
"scroll": true,
|
||||
"showHeader": true,
|
||||
"sort": {
|
||||
"col": 0,
|
||||
"desc": true
|
||||
},
|
||||
"styles": [
|
||||
{
|
||||
"dateFormat": "YYYY-MM-DD HH:mm:ss",
|
||||
"pattern": "@timestamp",
|
||||
"type": "date"
|
||||
}
|
||||
],
|
||||
"targets": [
|
||||
{
|
||||
"bucketAggs": [],
|
||||
"dsType": "elasticsearch",
|
||||
"metrics": [
|
||||
{
|
||||
"field": "select field",
|
||||
"id": "1",
|
||||
"meta": {},
|
||||
"settings": {
|
||||
"size": 500
|
||||
},
|
||||
"type": "raw_document"
|
||||
}
|
||||
],
|
||||
"refId": "A",
|
||||
"target": "",
|
||||
"timeField": "@timestamp"
|
||||
}
|
||||
],
|
||||
"title": "ES Log query",
|
||||
"transform": "json",
|
||||
"type": "table"
|
||||
}
|
||||
],
|
||||
"schemaVersion": 16,
|
||||
"style": "dark",
|
||||
"tags": [
|
||||
"elasticsearch",
|
||||
"gdev"
|
||||
],
|
||||
"templating": {
|
||||
"list": [
|
||||
{
|
||||
"datasource": "gdev-elasticsearch-v2-metrics",
|
||||
"filters": [],
|
||||
"hide": 0,
|
||||
"label": "",
|
||||
"name": "Filters",
|
||||
"skipUrlSync": false,
|
||||
"type": "adhoc"
|
||||
}
|
||||
]
|
||||
},
|
||||
"time": {
|
||||
"from": "now-30m",
|
||||
"to": "now"
|
||||
},
|
||||
"timepicker": {
|
||||
"collapse": false,
|
||||
"enable": true,
|
||||
"notice": false,
|
||||
"now": true,
|
||||
"refresh_intervals": [
|
||||
"5s",
|
||||
"10s",
|
||||
"30s",
|
||||
"1m",
|
||||
"5m",
|
||||
"15m",
|
||||
"30m",
|
||||
"1h",
|
||||
"2h",
|
||||
"1d"
|
||||
],
|
||||
"status": "Stable",
|
||||
"time_options": [
|
||||
"5m",
|
||||
"15m",
|
||||
"1h",
|
||||
"6h",
|
||||
"12h",
|
||||
"24h",
|
||||
"2d",
|
||||
"7d",
|
||||
"30d"
|
||||
],
|
||||
"type": "timepicker"
|
||||
},
|
||||
"timezone": "browser",
|
||||
"title": "Datasource tests - Elasticsearch v2",
|
||||
"uid": "RlqLq2fiz",
|
||||
"version": 2
|
||||
}
|
||||
@@ -1,651 +0,0 @@
|
||||
{
|
||||
"annotations": {
|
||||
"list": [
|
||||
{
|
||||
"builtIn": 1,
|
||||
"datasource": "-- Grafana --",
|
||||
"enable": false,
|
||||
"hide": true,
|
||||
"iconColor": "rgba(0, 211, 255, 1)",
|
||||
"limit": 100,
|
||||
"name": "Annotations & Alerts",
|
||||
"showIn": 0,
|
||||
"type": "dashboard"
|
||||
},
|
||||
{
|
||||
"datasource": "Elastic 5 Logs",
|
||||
"enable": false,
|
||||
"iconColor": "rgba(255, 96, 96, 1)",
|
||||
"limit": 100,
|
||||
"name": "test",
|
||||
"query": "",
|
||||
"showIn": 0,
|
||||
"textField": "description",
|
||||
"type": "alert"
|
||||
}
|
||||
]
|
||||
},
|
||||
"editable": true,
|
||||
"gnetId": null,
|
||||
"graphTooltip": 0,
|
||||
"iteration": 1542303896062,
|
||||
"links": [
|
||||
{
|
||||
"asDropdown": false,
|
||||
"icon": "external link",
|
||||
"tags": [
|
||||
"gdev",
|
||||
"elasticsearch"
|
||||
],
|
||||
"title": "Dashboard",
|
||||
"type": "dashboards"
|
||||
}
|
||||
],
|
||||
"panels": [
|
||||
{
|
||||
"aliasColors": {},
|
||||
"bars": false,
|
||||
"dashLength": 10,
|
||||
"dashes": false,
|
||||
"datasource": "gdev-elasticsearch-v5-metrics",
|
||||
"editable": true,
|
||||
"error": false,
|
||||
"fill": 1,
|
||||
"grid": {},
|
||||
"gridPos": {
|
||||
"h": 7,
|
||||
"w": 24,
|
||||
"x": 0,
|
||||
"y": 0
|
||||
},
|
||||
"id": 1,
|
||||
"legend": {
|
||||
"alignAsTable": true,
|
||||
"avg": false,
|
||||
"current": false,
|
||||
"max": true,
|
||||
"min": false,
|
||||
"rightSide": true,
|
||||
"show": true,
|
||||
"total": false,
|
||||
"values": true
|
||||
},
|
||||
"lines": true,
|
||||
"linewidth": 2,
|
||||
"links": [],
|
||||
"nullPointMode": "connected",
|
||||
"percentage": false,
|
||||
"pointradius": 5,
|
||||
"points": false,
|
||||
"renderer": "flot",
|
||||
"seriesOverrides": [],
|
||||
"spaceLength": 10,
|
||||
"stack": false,
|
||||
"steppedLine": false,
|
||||
"targets": [
|
||||
{
|
||||
"bucketAggs": [
|
||||
{
|
||||
"field": "@hostname",
|
||||
"id": "3",
|
||||
"settings": {
|
||||
"min_doc_count": 1,
|
||||
"order": "asc",
|
||||
"orderBy": "1",
|
||||
"size": "5"
|
||||
},
|
||||
"type": "terms"
|
||||
},
|
||||
{
|
||||
"field": "@timestamp",
|
||||
"id": "2",
|
||||
"settings": {
|
||||
"interval": "auto",
|
||||
"min_doc_count": 0,
|
||||
"trimEdges": 0
|
||||
},
|
||||
"type": "date_histogram"
|
||||
}
|
||||
],
|
||||
"dsType": "elasticsearch",
|
||||
"metrics": [
|
||||
{
|
||||
"field": "@value",
|
||||
"id": "1",
|
||||
"meta": {},
|
||||
"settings": {},
|
||||
"type": "max"
|
||||
}
|
||||
],
|
||||
"query": "*",
|
||||
"refId": "A",
|
||||
"target": "",
|
||||
"timeField": "@timestamp"
|
||||
}
|
||||
],
|
||||
"thresholds": [],
|
||||
"timeFrom": null,
|
||||
"timeRegions": [],
|
||||
"timeShift": null,
|
||||
"title": "Top 5 servers",
|
||||
"tooltip": {
|
||||
"msResolution": true,
|
||||
"shared": true,
|
||||
"sort": 0,
|
||||
"value_type": "cumulative"
|
||||
},
|
||||
"type": "graph",
|
||||
"xaxis": {
|
||||
"buckets": null,
|
||||
"mode": "time",
|
||||
"name": null,
|
||||
"show": true,
|
||||
"values": []
|
||||
},
|
||||
"yaxes": [
|
||||
{
|
||||
"format": "short",
|
||||
"logBase": 1,
|
||||
"max": null,
|
||||
"min": null,
|
||||
"show": true
|
||||
},
|
||||
{
|
||||
"format": "short",
|
||||
"logBase": 1,
|
||||
"max": null,
|
||||
"min": null,
|
||||
"show": true
|
||||
}
|
||||
],
|
||||
"yaxis": {
|
||||
"align": false,
|
||||
"alignLevel": null
|
||||
}
|
||||
},
|
||||
{
|
||||
"aliasColors": {
|
||||
"Count": "#6ED0E0"
|
||||
},
|
||||
"bars": false,
|
||||
"dashLength": 10,
|
||||
"dashes": false,
|
||||
"datasource": "gdev-elasticsearch-v5-metrics",
|
||||
"editable": true,
|
||||
"error": false,
|
||||
"fill": 1,
|
||||
"grid": {},
|
||||
"gridPos": {
|
||||
"h": 6,
|
||||
"w": 12,
|
||||
"x": 0,
|
||||
"y": 7
|
||||
},
|
||||
"id": 2,
|
||||
"legend": {
|
||||
"alignAsTable": true,
|
||||
"avg": true,
|
||||
"current": false,
|
||||
"max": false,
|
||||
"min": false,
|
||||
"rightSide": true,
|
||||
"show": true,
|
||||
"total": false,
|
||||
"values": true
|
||||
},
|
||||
"lines": true,
|
||||
"linewidth": 2,
|
||||
"links": [],
|
||||
"nullPointMode": "connected",
|
||||
"percentage": false,
|
||||
"pointradius": 5,
|
||||
"points": false,
|
||||
"renderer": "flot",
|
||||
"seriesOverrides": [
|
||||
{
|
||||
"alias": "Count",
|
||||
"lines": false,
|
||||
"yaxis": 2,
|
||||
"zindex": -1
|
||||
}
|
||||
],
|
||||
"spaceLength": 10,
|
||||
"stack": false,
|
||||
"steppedLine": false,
|
||||
"targets": [
|
||||
{
|
||||
"alias": "{{metric}}",
|
||||
"bucketAggs": [
|
||||
{
|
||||
"field": "@timestamp",
|
||||
"id": "2",
|
||||
"settings": {
|
||||
"interval": "5m",
|
||||
"min_doc_count": 0,
|
||||
"trimEdges": 0
|
||||
},
|
||||
"type": "date_histogram"
|
||||
}
|
||||
],
|
||||
"dsType": "elasticsearch",
|
||||
"metrics": [
|
||||
{
|
||||
"field": "@value",
|
||||
"id": "1",
|
||||
"meta": {},
|
||||
"settings": {
|
||||
"percents": [
|
||||
25,
|
||||
50,
|
||||
75,
|
||||
95,
|
||||
99
|
||||
]
|
||||
},
|
||||
"type": "percentiles"
|
||||
}
|
||||
],
|
||||
"query": "@metric:cpu",
|
||||
"refId": "A",
|
||||
"target": "",
|
||||
"timeField": "@timestamp"
|
||||
}
|
||||
],
|
||||
"thresholds": [],
|
||||
"timeFrom": null,
|
||||
"timeRegions": [],
|
||||
"timeShift": null,
|
||||
"title": "Percentiles & Metric filter",
|
||||
"tooltip": {
|
||||
"msResolution": false,
|
||||
"shared": true,
|
||||
"sort": 0,
|
||||
"value_type": "cumulative"
|
||||
},
|
||||
"type": "graph",
|
||||
"xaxis": {
|
||||
"buckets": null,
|
||||
"mode": "time",
|
||||
"name": null,
|
||||
"show": true,
|
||||
"values": []
|
||||
},
|
||||
"yaxes": [
|
||||
{
|
||||
"format": "short",
|
||||
"logBase": 1,
|
||||
"max": null,
|
||||
"min": null,
|
||||
"show": true
|
||||
},
|
||||
{
|
||||
"format": "short",
|
||||
"logBase": 1,
|
||||
"max": null,
|
||||
"min": null,
|
||||
"show": true
|
||||
}
|
||||
],
|
||||
"yaxis": {
|
||||
"align": false,
|
||||
"alignLevel": null
|
||||
}
|
||||
},
|
||||
{
|
||||
"aliasColors": {
|
||||
"Count": "#6ED0E0"
|
||||
},
|
||||
"bars": false,
|
||||
"dashLength": 10,
|
||||
"dashes": false,
|
||||
"datasource": "gdev-elasticsearch-v5-metrics",
|
||||
"editable": true,
|
||||
"error": false,
|
||||
"fill": 1,
|
||||
"grid": {},
|
||||
"gridPos": {
|
||||
"h": 6,
|
||||
"w": 12,
|
||||
"x": 12,
|
||||
"y": 7
|
||||
},
|
||||
"id": 3,
|
||||
"legend": {
|
||||
"alignAsTable": true,
|
||||
"avg": true,
|
||||
"current": false,
|
||||
"max": false,
|
||||
"min": false,
|
||||
"rightSide": true,
|
||||
"show": true,
|
||||
"total": false,
|
||||
"values": true
|
||||
},
|
||||
"lines": true,
|
||||
"linewidth": 2,
|
||||
"links": [],
|
||||
"nullPointMode": "connected",
|
||||
"percentage": false,
|
||||
"pointradius": 5,
|
||||
"points": false,
|
||||
"renderer": "flot",
|
||||
"seriesOverrides": [
|
||||
{
|
||||
"alias": "Count",
|
||||
"lines": false,
|
||||
"yaxis": 2,
|
||||
"zindex": -1
|
||||
}
|
||||
],
|
||||
"spaceLength": 10,
|
||||
"stack": false,
|
||||
"steppedLine": false,
|
||||
"targets": [
|
||||
{
|
||||
"alias": "{{metric}}",
|
||||
"bucketAggs": [
|
||||
{
|
||||
"field": "@timestamp",
|
||||
"id": "2",
|
||||
"settings": {
|
||||
"interval": "auto",
|
||||
"min_doc_count": 0,
|
||||
"trimEdges": 0
|
||||
},
|
||||
"type": "date_histogram"
|
||||
}
|
||||
],
|
||||
"dsType": "elasticsearch",
|
||||
"metrics": [
|
||||
{
|
||||
"field": "@value",
|
||||
"id": "1",
|
||||
"meta": {
|
||||
"std_deviation_bounds_lower": true,
|
||||
"std_deviation_bounds_upper": true
|
||||
},
|
||||
"settings": {},
|
||||
"type": "extended_stats"
|
||||
}
|
||||
],
|
||||
"query": "@metric:cpu",
|
||||
"refId": "A",
|
||||
"target": "",
|
||||
"timeField": "@timestamp"
|
||||
}
|
||||
],
|
||||
"thresholds": [],
|
||||
"timeFrom": null,
|
||||
"timeRegions": [],
|
||||
"timeShift": null,
|
||||
"title": "Standard dev",
|
||||
"tooltip": {
|
||||
"msResolution": true,
|
||||
"shared": true,
|
||||
"sort": 0,
|
||||
"value_type": "cumulative"
|
||||
},
|
||||
"type": "graph",
|
||||
"xaxis": {
|
||||
"buckets": null,
|
||||
"mode": "time",
|
||||
"name": null,
|
||||
"show": true,
|
||||
"values": []
|
||||
},
|
||||
"yaxes": [
|
||||
{
|
||||
"format": "short",
|
||||
"logBase": 1,
|
||||
"max": null,
|
||||
"min": null,
|
||||
"show": true
|
||||
},
|
||||
{
|
||||
"format": "short",
|
||||
"logBase": 1,
|
||||
"max": null,
|
||||
"min": null,
|
||||
"show": true
|
||||
}
|
||||
],
|
||||
"yaxis": {
|
||||
"align": false,
|
||||
"alignLevel": null
|
||||
}
|
||||
},
|
||||
{
|
||||
"columns": [
|
||||
{
|
||||
"text": "@hostname",
|
||||
"value": "@hostname"
|
||||
},
|
||||
{
|
||||
"text": "Average",
|
||||
"value": "Average"
|
||||
},
|
||||
{
|
||||
"text": "Max",
|
||||
"value": "Max"
|
||||
},
|
||||
{
|
||||
"text": "Sum",
|
||||
"value": "Sum"
|
||||
}
|
||||
],
|
||||
"datasource": "gdev-elasticsearch-v5-metrics",
|
||||
"editable": true,
|
||||
"error": false,
|
||||
"fontSize": "100%",
|
||||
"gridPos": {
|
||||
"h": 7,
|
||||
"w": 24,
|
||||
"x": 0,
|
||||
"y": 13
|
||||
},
|
||||
"id": 6,
|
||||
"links": [],
|
||||
"pageSize": null,
|
||||
"scroll": true,
|
||||
"showHeader": true,
|
||||
"sort": {
|
||||
"col": 0,
|
||||
"desc": true
|
||||
},
|
||||
"styles": [
|
||||
{
|
||||
"dateFormat": "YYYY-MM-DD HH:mm:ss",
|
||||
"pattern": "@timestamp",
|
||||
"type": "date"
|
||||
},
|
||||
{
|
||||
"colorMode": null,
|
||||
"colors": [
|
||||
"rgba(245, 54, 54, 0.9)",
|
||||
"rgba(237, 129, 40, 0.89)",
|
||||
"rgba(50, 172, 45, 0.97)"
|
||||
],
|
||||
"dateFormat": "YYYY-MM-DD HH:mm:ss",
|
||||
"decimals": 2,
|
||||
"pattern": "/.*/",
|
||||
"thresholds": [],
|
||||
"type": "number",
|
||||
"unit": "short"
|
||||
}
|
||||
],
|
||||
"targets": [
|
||||
{
|
||||
"bucketAggs": [
|
||||
{
|
||||
"field": "@hostname",
|
||||
"id": "2",
|
||||
"settings": {
|
||||
"min_doc_count": 1,
|
||||
"order": "asc",
|
||||
"orderBy": "_term",
|
||||
"size": "0"
|
||||
},
|
||||
"type": "terms"
|
||||
}
|
||||
],
|
||||
"dsType": "elasticsearch",
|
||||
"metrics": [
|
||||
{
|
||||
"field": "@value",
|
||||
"id": "1",
|
||||
"meta": {},
|
||||
"settings": {},
|
||||
"type": "avg"
|
||||
},
|
||||
{
|
||||
"field": "@value",
|
||||
"id": "3",
|
||||
"meta": {},
|
||||
"settings": {},
|
||||
"type": "max"
|
||||
},
|
||||
{
|
||||
"field": "@value",
|
||||
"id": "4",
|
||||
"meta": {},
|
||||
"settings": {},
|
||||
"type": "sum"
|
||||
}
|
||||
],
|
||||
"refId": "B",
|
||||
"timeField": "@timestamp"
|
||||
}
|
||||
],
|
||||
"title": "ES Metrics",
|
||||
"transform": "table",
|
||||
"type": "table"
|
||||
},
|
||||
{
|
||||
"columns": [
|
||||
{
|
||||
"text": "@timestamp",
|
||||
"value": "@timestamp"
|
||||
},
|
||||
{
|
||||
"text": "@message",
|
||||
"value": "@message"
|
||||
},
|
||||
{
|
||||
"text": "tags",
|
||||
"value": "tags"
|
||||
},
|
||||
{
|
||||
"text": "description",
|
||||
"value": "description"
|
||||
}
|
||||
],
|
||||
"datasource": "gdev-elasticsearch-v5-logs",
|
||||
"editable": true,
|
||||
"error": false,
|
||||
"fontSize": "100%",
|
||||
"gridPos": {
|
||||
"h": 7,
|
||||
"w": 24,
|
||||
"x": 0,
|
||||
"y": 20
|
||||
},
|
||||
"id": 5,
|
||||
"links": [],
|
||||
"pageSize": null,
|
||||
"scroll": true,
|
||||
"showHeader": true,
|
||||
"sort": {
|
||||
"col": 0,
|
||||
"desc": true
|
||||
},
|
||||
"styles": [
|
||||
{
|
||||
"dateFormat": "YYYY-MM-DD HH:mm:ss",
|
||||
"pattern": "@timestamp",
|
||||
"type": "date"
|
||||
}
|
||||
],
|
||||
"targets": [
|
||||
{
|
||||
"bucketAggs": [],
|
||||
"dsType": "elasticsearch",
|
||||
"metrics": [
|
||||
{
|
||||
"field": "select field",
|
||||
"id": "1",
|
||||
"meta": {},
|
||||
"settings": {
|
||||
"size": 500
|
||||
},
|
||||
"type": "raw_document"
|
||||
}
|
||||
],
|
||||
"refId": "A",
|
||||
"target": "",
|
||||
"timeField": "@timestamp"
|
||||
}
|
||||
],
|
||||
"title": "ES Log query",
|
||||
"transform": "json",
|
||||
"type": "table"
|
||||
}
|
||||
],
|
||||
"schemaVersion": 16,
|
||||
"style": "dark",
|
||||
"tags": [
|
||||
"elasticsearch",
|
||||
"gdev"
|
||||
],
|
||||
"templating": {
|
||||
"list": [
|
||||
{
|
||||
"datasource": "gdev-elasticsearch-v5-metrics",
|
||||
"filters": [],
|
||||
"hide": 0,
|
||||
"label": "",
|
||||
"name": "Filters",
|
||||
"skipUrlSync": false,
|
||||
"type": "adhoc"
|
||||
}
|
||||
]
|
||||
},
|
||||
"time": {
|
||||
"from": "now-30m",
|
||||
"to": "now"
|
||||
},
|
||||
"timepicker": {
|
||||
"collapse": false,
|
||||
"enable": true,
|
||||
"notice": false,
|
||||
"now": true,
|
||||
"refresh_intervals": [
|
||||
"5s",
|
||||
"10s",
|
||||
"30s",
|
||||
"1m",
|
||||
"5m",
|
||||
"15m",
|
||||
"30m",
|
||||
"1h",
|
||||
"2h",
|
||||
"1d"
|
||||
],
|
||||
"status": "Stable",
|
||||
"time_options": [
|
||||
"5m",
|
||||
"15m",
|
||||
"1h",
|
||||
"6h",
|
||||
"12h",
|
||||
"24h",
|
||||
"2d",
|
||||
"7d",
|
||||
"30d"
|
||||
],
|
||||
"type": "timepicker"
|
||||
},
|
||||
"timezone": "browser",
|
||||
"title": "Datasource tests - Elasticsearch v5",
|
||||
"uid": "8HjT32Bmz",
|
||||
"version": 27
|
||||
}
|
||||
@@ -1,649 +0,0 @@
|
||||
{
|
||||
"annotations": {
|
||||
"list": [
|
||||
{
|
||||
"builtIn": 1,
|
||||
"datasource": "-- Grafana --",
|
||||
"enable": false,
|
||||
"hide": true,
|
||||
"iconColor": "rgba(0, 211, 255, 1)",
|
||||
"limit": 100,
|
||||
"name": "Annotations & Alerts",
|
||||
"showIn": 0,
|
||||
"type": "dashboard"
|
||||
},
|
||||
{
|
||||
"datasource": "Elastic 5 Logs",
|
||||
"enable": false,
|
||||
"iconColor": "rgba(255, 96, 96, 1)",
|
||||
"limit": 100,
|
||||
"name": "test",
|
||||
"query": "",
|
||||
"showIn": 0,
|
||||
"textField": "description",
|
||||
"type": "alert"
|
||||
}
|
||||
]
|
||||
},
|
||||
"editable": true,
|
||||
"gnetId": null,
|
||||
"graphTooltip": 0,
|
||||
"iteration": 1542303999511,
|
||||
"links": [
|
||||
{
|
||||
"icon": "external link",
|
||||
"tags": [
|
||||
"gdev",
|
||||
"elasticsearch"
|
||||
],
|
||||
"type": "dashboards"
|
||||
}
|
||||
],
|
||||
"panels": [
|
||||
{
|
||||
"aliasColors": {},
|
||||
"bars": false,
|
||||
"dashLength": 10,
|
||||
"dashes": false,
|
||||
"datasource": "gdev-elasticsearch-v6-metrics",
|
||||
"editable": true,
|
||||
"error": false,
|
||||
"fill": 1,
|
||||
"grid": {},
|
||||
"gridPos": {
|
||||
"h": 7,
|
||||
"w": 24,
|
||||
"x": 0,
|
||||
"y": 0
|
||||
},
|
||||
"id": 1,
|
||||
"legend": {
|
||||
"alignAsTable": true,
|
||||
"avg": false,
|
||||
"current": false,
|
||||
"max": true,
|
||||
"min": false,
|
||||
"rightSide": true,
|
||||
"show": true,
|
||||
"total": false,
|
||||
"values": true
|
||||
},
|
||||
"lines": true,
|
||||
"linewidth": 2,
|
||||
"links": [],
|
||||
"nullPointMode": "connected",
|
||||
"percentage": false,
|
||||
"pointradius": 5,
|
||||
"points": false,
|
||||
"renderer": "flot",
|
||||
"seriesOverrides": [],
|
||||
"spaceLength": 10,
|
||||
"stack": false,
|
||||
"steppedLine": false,
|
||||
"targets": [
|
||||
{
|
||||
"bucketAggs": [
|
||||
{
|
||||
"field": "@hostname",
|
||||
"id": "3",
|
||||
"settings": {
|
||||
"min_doc_count": 1,
|
||||
"order": "asc",
|
||||
"orderBy": "1",
|
||||
"size": "5"
|
||||
},
|
||||
"type": "terms"
|
||||
},
|
||||
{
|
||||
"field": "@timestamp",
|
||||
"id": "2",
|
||||
"settings": {
|
||||
"interval": "auto",
|
||||
"min_doc_count": 0,
|
||||
"trimEdges": 0
|
||||
},
|
||||
"type": "date_histogram"
|
||||
}
|
||||
],
|
||||
"dsType": "elasticsearch",
|
||||
"metrics": [
|
||||
{
|
||||
"field": "@value",
|
||||
"id": "1",
|
||||
"meta": {},
|
||||
"settings": {},
|
||||
"type": "max"
|
||||
}
|
||||
],
|
||||
"query": "*",
|
||||
"refId": "A",
|
||||
"target": "",
|
||||
"timeField": "@timestamp"
|
||||
}
|
||||
],
|
||||
"thresholds": [],
|
||||
"timeFrom": null,
|
||||
"timeRegions": [],
|
||||
"timeShift": null,
|
||||
"title": "Top 5 servers",
|
||||
"tooltip": {
|
||||
"msResolution": true,
|
||||
"shared": true,
|
||||
"sort": 0,
|
||||
"value_type": "cumulative"
|
||||
},
|
||||
"type": "graph",
|
||||
"xaxis": {
|
||||
"buckets": null,
|
||||
"mode": "time",
|
||||
"name": null,
|
||||
"show": true,
|
||||
"values": []
|
||||
},
|
||||
"yaxes": [
|
||||
{
|
||||
"format": "short",
|
||||
"logBase": 1,
|
||||
"max": null,
|
||||
"min": null,
|
||||
"show": true
|
||||
},
|
||||
{
|
||||
"format": "short",
|
||||
"logBase": 1,
|
||||
"max": null,
|
||||
"min": null,
|
||||
"show": true
|
||||
}
|
||||
],
|
||||
"yaxis": {
|
||||
"align": false,
|
||||
"alignLevel": null
|
||||
}
|
||||
},
|
||||
{
|
||||
"aliasColors": {
|
||||
"Count": "#6ED0E0"
|
||||
},
|
||||
"bars": false,
|
||||
"dashLength": 10,
|
||||
"dashes": false,
|
||||
"datasource": "gdev-elasticsearch-v6-metrics",
|
||||
"editable": true,
|
||||
"error": false,
|
||||
"fill": 1,
|
||||
"grid": {},
|
||||
"gridPos": {
|
||||
"h": 6,
|
||||
"w": 12,
|
||||
"x": 0,
|
||||
"y": 7
|
||||
},
|
||||
"id": 2,
|
||||
"legend": {
|
||||
"alignAsTable": true,
|
||||
"avg": true,
|
||||
"current": false,
|
||||
"max": false,
|
||||
"min": false,
|
||||
"rightSide": true,
|
||||
"show": true,
|
||||
"total": false,
|
||||
"values": true
|
||||
},
|
||||
"lines": true,
|
||||
"linewidth": 2,
|
||||
"links": [],
|
||||
"nullPointMode": "connected",
|
||||
"percentage": false,
|
||||
"pointradius": 5,
|
||||
"points": false,
|
||||
"renderer": "flot",
|
||||
"seriesOverrides": [
|
||||
{
|
||||
"alias": "Count",
|
||||
"lines": false,
|
||||
"yaxis": 2,
|
||||
"zindex": -1
|
||||
}
|
||||
],
|
||||
"spaceLength": 10,
|
||||
"stack": false,
|
||||
"steppedLine": false,
|
||||
"targets": [
|
||||
{
|
||||
"alias": "{{metric}}",
|
||||
"bucketAggs": [
|
||||
{
|
||||
"field": "@timestamp",
|
||||
"id": "2",
|
||||
"settings": {
|
||||
"interval": "5m",
|
||||
"min_doc_count": 0,
|
||||
"trimEdges": 0
|
||||
},
|
||||
"type": "date_histogram"
|
||||
}
|
||||
],
|
||||
"dsType": "elasticsearch",
|
||||
"metrics": [
|
||||
{
|
||||
"field": "@value",
|
||||
"id": "1",
|
||||
"meta": {},
|
||||
"settings": {
|
||||
"percents": [
|
||||
25,
|
||||
50,
|
||||
75,
|
||||
95,
|
||||
99
|
||||
]
|
||||
},
|
||||
"type": "percentiles"
|
||||
}
|
||||
],
|
||||
"query": "@metric:cpu",
|
||||
"refId": "A",
|
||||
"target": "",
|
||||
"timeField": "@timestamp"
|
||||
}
|
||||
],
|
||||
"thresholds": [],
|
||||
"timeFrom": null,
|
||||
"timeRegions": [],
|
||||
"timeShift": null,
|
||||
"title": "Percentiles & Metric filter",
|
||||
"tooltip": {
|
||||
"msResolution": false,
|
||||
"shared": true,
|
||||
"sort": 0,
|
||||
"value_type": "cumulative"
|
||||
},
|
||||
"type": "graph",
|
||||
"xaxis": {
|
||||
"buckets": null,
|
||||
"mode": "time",
|
||||
"name": null,
|
||||
"show": true,
|
||||
"values": []
|
||||
},
|
||||
"yaxes": [
|
||||
{
|
||||
"format": "short",
|
||||
"logBase": 1,
|
||||
"max": null,
|
||||
"min": null,
|
||||
"show": true
|
||||
},
|
||||
{
|
||||
"format": "short",
|
||||
"logBase": 1,
|
||||
"max": null,
|
||||
"min": null,
|
||||
"show": true
|
||||
}
|
||||
],
|
||||
"yaxis": {
|
||||
"align": false,
|
||||
"alignLevel": null
|
||||
}
|
||||
},
|
||||
{
|
||||
"aliasColors": {
|
||||
"Count": "#6ED0E0"
|
||||
},
|
||||
"bars": false,
|
||||
"dashLength": 10,
|
||||
"dashes": false,
|
||||
"datasource": "gdev-elasticsearch-v6-metrics",
|
||||
"editable": true,
|
||||
"error": false,
|
||||
"fill": 1,
|
||||
"grid": {},
|
||||
"gridPos": {
|
||||
"h": 6,
|
||||
"w": 12,
|
||||
"x": 12,
|
||||
"y": 7
|
||||
},
|
||||
"id": 3,
|
||||
"legend": {
|
||||
"alignAsTable": true,
|
||||
"avg": true,
|
||||
"current": false,
|
||||
"max": false,
|
||||
"min": false,
|
||||
"rightSide": true,
|
||||
"show": true,
|
||||
"total": false,
|
||||
"values": true
|
||||
},
|
||||
"lines": true,
|
||||
"linewidth": 2,
|
||||
"links": [],
|
||||
"nullPointMode": "connected",
|
||||
"percentage": false,
|
||||
"pointradius": 5,
|
||||
"points": false,
|
||||
"renderer": "flot",
|
||||
"seriesOverrides": [
|
||||
{
|
||||
"alias": "Count",
|
||||
"lines": false,
|
||||
"yaxis": 2,
|
||||
"zindex": -1
|
||||
}
|
||||
],
|
||||
"spaceLength": 10,
|
||||
"stack": false,
|
||||
"steppedLine": false,
|
||||
"targets": [
|
||||
{
|
||||
"alias": "{{metric}}",
|
||||
"bucketAggs": [
|
||||
{
|
||||
"field": "@timestamp",
|
||||
"id": "2",
|
||||
"settings": {
|
||||
"interval": "auto",
|
||||
"min_doc_count": 0,
|
||||
"trimEdges": 0
|
||||
},
|
||||
"type": "date_histogram"
|
||||
}
|
||||
],
|
||||
"dsType": "elasticsearch",
|
||||
"metrics": [
|
||||
{
|
||||
"field": "@value",
|
||||
"id": "1",
|
||||
"meta": {
|
||||
"std_deviation_bounds_lower": true,
|
||||
"std_deviation_bounds_upper": true
|
||||
},
|
||||
"settings": {},
|
||||
"type": "extended_stats"
|
||||
}
|
||||
],
|
||||
"query": "@metric:cpu",
|
||||
"refId": "A",
|
||||
"target": "",
|
||||
"timeField": "@timestamp"
|
||||
}
|
||||
],
|
||||
"thresholds": [],
|
||||
"timeFrom": null,
|
||||
"timeRegions": [],
|
||||
"timeShift": null,
|
||||
"title": "Standard dev",
|
||||
"tooltip": {
|
||||
"msResolution": true,
|
||||
"shared": true,
|
||||
"sort": 0,
|
||||
"value_type": "cumulative"
|
||||
},
|
||||
"type": "graph",
|
||||
"xaxis": {
|
||||
"buckets": null,
|
||||
"mode": "time",
|
||||
"name": null,
|
||||
"show": true,
|
||||
"values": []
|
||||
},
|
||||
"yaxes": [
|
||||
{
|
||||
"format": "short",
|
||||
"logBase": 1,
|
||||
"max": null,
|
||||
"min": null,
|
||||
"show": true
|
||||
},
|
||||
{
|
||||
"format": "short",
|
||||
"logBase": 1,
|
||||
"max": null,
|
||||
"min": null,
|
||||
"show": true
|
||||
}
|
||||
],
|
||||
"yaxis": {
|
||||
"align": false,
|
||||
"alignLevel": null
|
||||
}
|
||||
},
|
||||
{
|
||||
"columns": [
|
||||
{
|
||||
"text": "@hostname",
|
||||
"value": "@hostname"
|
||||
},
|
||||
{
|
||||
"text": "Average",
|
||||
"value": "Average"
|
||||
},
|
||||
{
|
||||
"text": "Max",
|
||||
"value": "Max"
|
||||
},
|
||||
{
|
||||
"text": "Sum",
|
||||
"value": "Sum"
|
||||
}
|
||||
],
|
||||
"datasource": "gdev-elasticsearch-v6-metrics",
|
||||
"editable": true,
|
||||
"error": false,
|
||||
"fontSize": "100%",
|
||||
"gridPos": {
|
||||
"h": 7,
|
||||
"w": 24,
|
||||
"x": 0,
|
||||
"y": 13
|
||||
},
|
||||
"id": 6,
|
||||
"links": [],
|
||||
"pageSize": null,
|
||||
"scroll": true,
|
||||
"showHeader": true,
|
||||
"sort": {
|
||||
"col": 0,
|
||||
"desc": true
|
||||
},
|
||||
"styles": [
|
||||
{
|
||||
"dateFormat": "YYYY-MM-DD HH:mm:ss",
|
||||
"pattern": "@timestamp",
|
||||
"type": "date"
|
||||
},
|
||||
{
|
||||
"colorMode": null,
|
||||
"colors": [
|
||||
"rgba(245, 54, 54, 0.9)",
|
||||
"rgba(237, 129, 40, 0.89)",
|
||||
"rgba(50, 172, 45, 0.97)"
|
||||
],
|
||||
"dateFormat": "YYYY-MM-DD HH:mm:ss",
|
||||
"decimals": 2,
|
||||
"pattern": "/.*/",
|
||||
"thresholds": [],
|
||||
"type": "number",
|
||||
"unit": "short"
|
||||
}
|
||||
],
|
||||
"targets": [
|
||||
{
|
||||
"bucketAggs": [
|
||||
{
|
||||
"field": "@hostname",
|
||||
"id": "2",
|
||||
"settings": {
|
||||
"min_doc_count": 1,
|
||||
"order": "asc",
|
||||
"orderBy": "_term",
|
||||
"size": "0"
|
||||
},
|
||||
"type": "terms"
|
||||
}
|
||||
],
|
||||
"dsType": "elasticsearch",
|
||||
"metrics": [
|
||||
{
|
||||
"field": "@value",
|
||||
"id": "1",
|
||||
"meta": {},
|
||||
"settings": {},
|
||||
"type": "avg"
|
||||
},
|
||||
{
|
||||
"field": "@value",
|
||||
"id": "3",
|
||||
"meta": {},
|
||||
"settings": {},
|
||||
"type": "max"
|
||||
},
|
||||
{
|
||||
"field": "@value",
|
||||
"id": "4",
|
||||
"meta": {},
|
||||
"settings": {},
|
||||
"type": "sum"
|
||||
}
|
||||
],
|
||||
"refId": "B",
|
||||
"timeField": "@timestamp"
|
||||
}
|
||||
],
|
||||
"title": "ES Metrics",
|
||||
"transform": "table",
|
||||
"type": "table"
|
||||
},
|
||||
{
|
||||
"columns": [
|
||||
{
|
||||
"text": "@timestamp",
|
||||
"value": "@timestamp"
|
||||
},
|
||||
{
|
||||
"text": "@message",
|
||||
"value": "@message"
|
||||
},
|
||||
{
|
||||
"text": "tags",
|
||||
"value": "tags"
|
||||
},
|
||||
{
|
||||
"text": "description",
|
||||
"value": "description"
|
||||
}
|
||||
],
|
||||
"datasource": "gdev-elasticsearch-v6-logs",
|
||||
"editable": true,
|
||||
"error": false,
|
||||
"fontSize": "100%",
|
||||
"gridPos": {
|
||||
"h": 7,
|
||||
"w": 24,
|
||||
"x": 0,
|
||||
"y": 20
|
||||
},
|
||||
"id": 5,
|
||||
"links": [],
|
||||
"pageSize": null,
|
||||
"scroll": true,
|
||||
"showHeader": true,
|
||||
"sort": {
|
||||
"col": 0,
|
||||
"desc": true
|
||||
},
|
||||
"styles": [
|
||||
{
|
||||
"dateFormat": "YYYY-MM-DD HH:mm:ss",
|
||||
"pattern": "@timestamp",
|
||||
"type": "date"
|
||||
}
|
||||
],
|
||||
"targets": [
|
||||
{
|
||||
"bucketAggs": [],
|
||||
"dsType": "elasticsearch",
|
||||
"metrics": [
|
||||
{
|
||||
"field": "select field",
|
||||
"id": "1",
|
||||
"meta": {},
|
||||
"settings": {
|
||||
"size": 500
|
||||
},
|
||||
"type": "raw_document"
|
||||
}
|
||||
],
|
||||
"refId": "A",
|
||||
"target": "",
|
||||
"timeField": "@timestamp"
|
||||
}
|
||||
],
|
||||
"title": "ES Log query",
|
||||
"transform": "json",
|
||||
"type": "table"
|
||||
}
|
||||
],
|
||||
"schemaVersion": 16,
|
||||
"style": "dark",
|
||||
"tags": [
|
||||
"elasticsearch",
|
||||
"gdev"
|
||||
],
|
||||
"templating": {
|
||||
"list": [
|
||||
{
|
||||
"datasource": "gdev-elasticsearch-v6-metrics",
|
||||
"filters": [],
|
||||
"hide": 0,
|
||||
"label": "",
|
||||
"name": "Filters",
|
||||
"skipUrlSync": false,
|
||||
"type": "adhoc"
|
||||
}
|
||||
]
|
||||
},
|
||||
"time": {
|
||||
"from": "now-30m",
|
||||
"to": "now"
|
||||
},
|
||||
"timepicker": {
|
||||
"collapse": false,
|
||||
"enable": true,
|
||||
"notice": false,
|
||||
"now": true,
|
||||
"refresh_intervals": [
|
||||
"5s",
|
||||
"10s",
|
||||
"30s",
|
||||
"1m",
|
||||
"5m",
|
||||
"15m",
|
||||
"30m",
|
||||
"1h",
|
||||
"2h",
|
||||
"1d"
|
||||
],
|
||||
"status": "Stable",
|
||||
"time_options": [
|
||||
"5m",
|
||||
"15m",
|
||||
"1h",
|
||||
"6h",
|
||||
"12h",
|
||||
"24h",
|
||||
"2d",
|
||||
"7d",
|
||||
"30d"
|
||||
],
|
||||
"type": "timepicker"
|
||||
},
|
||||
"timezone": "browser",
|
||||
"title": "Datasource tests - Elasticsearch v6",
|
||||
"uid": "NF8Pq2Biz",
|
||||
"version": 2
|
||||
}
|
||||
@@ -75,7 +75,7 @@
|
||||
{
|
||||
"alias": "",
|
||||
"format": "time_series",
|
||||
"rawSql": "SELECT\n $__timeGroup(\"createdAt\",'$summarize'),\n min(value) as \"value\",\n 'total avg' as \"metric\"\nFROM \n grafana_metric\nWHERE\n $__timeFilter(\"createdAt\") AND\n measurement = 'logins.count'\nGROUP BY time\nORDER BY time",
|
||||
"rawSql": "SELECT\n $__timeGroup(\"createdAt\",'$summarize'),\n min(value) as \"value\",\n 'total avg' as \"metric\"\nFROM \n grafana_metric\nWHERE\n $__timeFilter(\"createdAt\") AND\n measurement = 'logins.count'\nGROUP BY time",
|
||||
"refId": "B"
|
||||
}
|
||||
],
|
||||
@@ -323,7 +323,11 @@
|
||||
{
|
||||
"alias": "",
|
||||
"colorMode": null,
|
||||
"colors": ["rgba(245, 54, 54, 0.9)", "rgba(237, 129, 40, 0.89)", "rgba(50, 172, 45, 0.97)"],
|
||||
"colors": [
|
||||
"rgba(245, 54, 54, 0.9)",
|
||||
"rgba(237, 129, 40, 0.89)",
|
||||
"rgba(50, 172, 45, 0.97)"
|
||||
],
|
||||
"decimals": 2,
|
||||
"pattern": "/.*/",
|
||||
"thresholds": [],
|
||||
@@ -347,7 +351,11 @@
|
||||
],
|
||||
"schemaVersion": 16,
|
||||
"style": "dark",
|
||||
"tags": ["gdev", "fake-data-gen", "postgres"],
|
||||
"tags": [
|
||||
"gdev",
|
||||
"fake-data-gen",
|
||||
"postgres"
|
||||
],
|
||||
"templating": {
|
||||
"list": [
|
||||
{
|
||||
@@ -493,11 +501,32 @@
|
||||
"to": "now"
|
||||
},
|
||||
"timepicker": {
|
||||
"refresh_intervals": ["5s", "10s", "30s", "1m", "5m", "15m", "30m", "1h", "2h", "1d"],
|
||||
"time_options": ["5m", "15m", "1h", "6h", "12h", "24h", "2d", "7d", "30d"]
|
||||
"refresh_intervals": [
|
||||
"5s",
|
||||
"10s",
|
||||
"30s",
|
||||
"1m",
|
||||
"5m",
|
||||
"15m",
|
||||
"30m",
|
||||
"1h",
|
||||
"2h",
|
||||
"1d"
|
||||
],
|
||||
"time_options": [
|
||||
"5m",
|
||||
"15m",
|
||||
"1h",
|
||||
"6h",
|
||||
"12h",
|
||||
"24h",
|
||||
"2d",
|
||||
"7d",
|
||||
"30d"
|
||||
]
|
||||
},
|
||||
"timezone": "",
|
||||
"title": "Datasource tests - Postgres",
|
||||
"uid": "JYola5qzz",
|
||||
"version": 4
|
||||
}
|
||||
}
|
||||
File diff suppressed because it is too large
Load Diff
@@ -463,105 +463,15 @@
|
||||
"align": false,
|
||||
"alignLevel": null
|
||||
}
|
||||
},
|
||||
{
|
||||
"aliasColors": {},
|
||||
"bars": false,
|
||||
"dashLength": 10,
|
||||
"dashes": false,
|
||||
"datasource": "gdev-testdata",
|
||||
"fill": 1,
|
||||
"gridPos": {
|
||||
"h": 8,
|
||||
"w": 24,
|
||||
"x": 0,
|
||||
"y": 32
|
||||
},
|
||||
"id": 7,
|
||||
"legend": {
|
||||
"avg": false,
|
||||
"current": false,
|
||||
"max": false,
|
||||
"min": false,
|
||||
"show": true,
|
||||
"total": false,
|
||||
"values": false
|
||||
},
|
||||
"lines": true,
|
||||
"linewidth": 1,
|
||||
"links": [],
|
||||
"nullPointMode": "null",
|
||||
"percentage": false,
|
||||
"pointradius": 2,
|
||||
"points": false,
|
||||
"renderer": "flot",
|
||||
"seriesOverrides": [],
|
||||
"spaceLength": 10,
|
||||
"stack": false,
|
||||
"steppedLine": false,
|
||||
"targets": [
|
||||
{
|
||||
"refId": "A",
|
||||
"scenarioId": "random_walk"
|
||||
}
|
||||
],
|
||||
"thresholds": [],
|
||||
"timeFrom": null,
|
||||
"timeRegions": [
|
||||
{
|
||||
"colorMode": "gray",
|
||||
"fill": true,
|
||||
"fillColor": "rgba(234, 112, 112, 0.12)",
|
||||
"from": "22:00",
|
||||
"line": false,
|
||||
"lineColor": "rgba(237, 46, 24, 0.60)",
|
||||
"op": "time",
|
||||
"to": "00:30"
|
||||
}
|
||||
],
|
||||
"timeShift": null,
|
||||
"title": "From 22:00 to 00:30 (crossing midnight)",
|
||||
"tooltip": {
|
||||
"shared": true,
|
||||
"sort": 0,
|
||||
"value_type": "individual"
|
||||
},
|
||||
"type": "graph",
|
||||
"xaxis": {
|
||||
"buckets": null,
|
||||
"mode": "time",
|
||||
"name": null,
|
||||
"show": true,
|
||||
"values": []
|
||||
},
|
||||
"yaxes": [
|
||||
{
|
||||
"format": "short",
|
||||
"label": null,
|
||||
"logBase": 1,
|
||||
"max": null,
|
||||
"min": null,
|
||||
"show": true
|
||||
},
|
||||
{
|
||||
"format": "short",
|
||||
"label": null,
|
||||
"logBase": 1,
|
||||
"max": null,
|
||||
"min": null,
|
||||
"show": true
|
||||
}
|
||||
],
|
||||
"yaxis": {
|
||||
"align": false,
|
||||
"alignLevel": null
|
||||
}
|
||||
}
|
||||
],
|
||||
"refresh": false,
|
||||
"schemaVersion": 18,
|
||||
"schemaVersion": 16,
|
||||
"style": "dark",
|
||||
"tags": ["gdev", "panel-tests"],
|
||||
"tags": [
|
||||
"gdev",
|
||||
"panel-tests"
|
||||
],
|
||||
"templating": {
|
||||
"list": []
|
||||
},
|
||||
@@ -570,11 +480,32 @@
|
||||
"to": "now"
|
||||
},
|
||||
"timepicker": {
|
||||
"refresh_intervals": ["5s", "10s", "30s", "1m", "5m", "15m", "30m", "1h", "2h", "1d"],
|
||||
"time_options": ["5m", "15m", "1h", "6h", "12h", "24h", "2d", "7d", "30d"]
|
||||
"refresh_intervals": [
|
||||
"5s",
|
||||
"10s",
|
||||
"30s",
|
||||
"1m",
|
||||
"5m",
|
||||
"15m",
|
||||
"30m",
|
||||
"1h",
|
||||
"2h",
|
||||
"1d"
|
||||
],
|
||||
"time_options": [
|
||||
"5m",
|
||||
"15m",
|
||||
"1h",
|
||||
"6h",
|
||||
"12h",
|
||||
"24h",
|
||||
"2d",
|
||||
"7d",
|
||||
"30d"
|
||||
]
|
||||
},
|
||||
"timezone": "browser",
|
||||
"title": "Panel Tests - Graph (Time Regions)",
|
||||
"uid": "XMjIZPmik",
|
||||
"version": 9
|
||||
}
|
||||
"version": 1
|
||||
}
|
||||
@@ -1,296 +0,0 @@
|
||||
{
|
||||
"annotations": {
|
||||
"list": [
|
||||
{
|
||||
"builtIn": 1,
|
||||
"datasource": "-- Grafana --",
|
||||
"enable": true,
|
||||
"hide": true,
|
||||
"iconColor": "rgba(0, 211, 255, 1)",
|
||||
"name": "Annotations & Alerts",
|
||||
"type": "dashboard"
|
||||
}
|
||||
]
|
||||
},
|
||||
"editable": true,
|
||||
"gnetId": null,
|
||||
"graphTooltip": 0,
|
||||
"links": [],
|
||||
"panels": [
|
||||
{
|
||||
"datasource": "gdev-testdata",
|
||||
"gridPos": {
|
||||
"h": 8,
|
||||
"w": 24,
|
||||
"x": 0,
|
||||
"y": 0
|
||||
},
|
||||
"id": 6,
|
||||
"links": [],
|
||||
"options-gauge": {
|
||||
"decimals": 0,
|
||||
"maxValue": 100,
|
||||
"minValue": 0,
|
||||
"options": {
|
||||
"decimals": 0,
|
||||
"maxValue": 100,
|
||||
"minValue": 0,
|
||||
"prefix": "",
|
||||
"showThresholdLabels": false,
|
||||
"showThresholdMarkers": true,
|
||||
"stat": "avg",
|
||||
"suffix": "",
|
||||
"thresholds": [],
|
||||
"unit": "none",
|
||||
"valueMappings": []
|
||||
},
|
||||
"prefix": "",
|
||||
"showThresholdLabels": false,
|
||||
"showThresholdMarkers": true,
|
||||
"stat": "avg",
|
||||
"suffix": "",
|
||||
"thresholds": [
|
||||
{
|
||||
"color": "#1F78C1",
|
||||
"index": 5,
|
||||
"value": 96.875
|
||||
},
|
||||
{
|
||||
"color": "#E24D42",
|
||||
"index": 4,
|
||||
"value": 93.75
|
||||
},
|
||||
{
|
||||
"color": "#EF843C",
|
||||
"index": 3,
|
||||
"value": 87.5
|
||||
},
|
||||
{
|
||||
"color": "#6ED0E0",
|
||||
"index": 2,
|
||||
"value": 75
|
||||
},
|
||||
{
|
||||
"color": "#EAB839",
|
||||
"index": 1,
|
||||
"value": 50
|
||||
},
|
||||
{
|
||||
"color": "#7EB26D",
|
||||
"index": 0,
|
||||
"value": null
|
||||
}
|
||||
],
|
||||
"unit": "none",
|
||||
"valueMappings": [
|
||||
{
|
||||
"from": "50",
|
||||
"id": 1,
|
||||
"operator": "",
|
||||
"text": "Hello :) ",
|
||||
"to": "90",
|
||||
"type": 2,
|
||||
"value": ""
|
||||
}
|
||||
]
|
||||
},
|
||||
"targets": [
|
||||
{
|
||||
"refId": "A",
|
||||
"scenarioId": "random_walk"
|
||||
},
|
||||
{
|
||||
"refId": "B",
|
||||
"scenarioId": "random_walk"
|
||||
},
|
||||
{
|
||||
"refId": "C",
|
||||
"scenarioId": "random_walk"
|
||||
},
|
||||
{
|
||||
"refId": "D",
|
||||
"scenarioId": "random_walk"
|
||||
},
|
||||
{
|
||||
"refId": "E",
|
||||
"scenarioId": "random_walk"
|
||||
}
|
||||
],
|
||||
"timeFrom": null,
|
||||
"timeShift": null,
|
||||
"title": "Horizontal with range variable",
|
||||
"type": "gauge"
|
||||
},
|
||||
{
|
||||
"datasource": "gdev-testdata",
|
||||
"gridPos": {
|
||||
"h": 8,
|
||||
"w": 24,
|
||||
"x": 0,
|
||||
"y": 8
|
||||
},
|
||||
"id": 2,
|
||||
"links": [],
|
||||
"options-gauge": {
|
||||
"decimals": 0,
|
||||
"maxValue": 100,
|
||||
"minValue": 0,
|
||||
"options": {
|
||||
"decimals": 0,
|
||||
"maxValue": 100,
|
||||
"minValue": 0,
|
||||
"prefix": "",
|
||||
"showThresholdLabels": false,
|
||||
"showThresholdMarkers": true,
|
||||
"stat": "avg",
|
||||
"suffix": "",
|
||||
"thresholds": [],
|
||||
"unit": "none",
|
||||
"valueMappings": []
|
||||
},
|
||||
"prefix": "",
|
||||
"showThresholdLabels": false,
|
||||
"showThresholdMarkers": true,
|
||||
"stat": "avg",
|
||||
"suffix": "",
|
||||
"thresholds": [
|
||||
{
|
||||
"color": "#EAB839",
|
||||
"index": 1,
|
||||
"value": 50
|
||||
},
|
||||
{
|
||||
"color": "#7EB26D",
|
||||
"index": 0,
|
||||
"value": null
|
||||
}
|
||||
],
|
||||
"unit": "none",
|
||||
"valueMappings": []
|
||||
},
|
||||
"targets": [
|
||||
{
|
||||
"refId": "A",
|
||||
"scenarioId": "random_walk"
|
||||
},
|
||||
{
|
||||
"refId": "B",
|
||||
"scenarioId": "random_walk"
|
||||
},
|
||||
{
|
||||
"refId": "C",
|
||||
"scenarioId": "random_walk"
|
||||
},
|
||||
{
|
||||
"refId": "D",
|
||||
"scenarioId": "random_walk"
|
||||
},
|
||||
{
|
||||
"refId": "E",
|
||||
"scenarioId": "random_walk"
|
||||
}
|
||||
],
|
||||
"timeFrom": null,
|
||||
"timeShift": null,
|
||||
"title": "Repeat horizontal",
|
||||
"type": "gauge"
|
||||
},
|
||||
{
|
||||
"datasource": "gdev-testdata",
|
||||
"gridPos": {
|
||||
"h": 14,
|
||||
"w": 5,
|
||||
"x": 0,
|
||||
"y": 16
|
||||
},
|
||||
"id": 4,
|
||||
"links": [],
|
||||
"options-gauge": {
|
||||
"decimals": 0,
|
||||
"maxValue": "200",
|
||||
"minValue": 0,
|
||||
"options": {
|
||||
"decimals": 0,
|
||||
"maxValue": 100,
|
||||
"minValue": 0,
|
||||
"prefix": "",
|
||||
"showThresholdLabels": false,
|
||||
"showThresholdMarkers": true,
|
||||
"stat": "avg",
|
||||
"suffix": "",
|
||||
"thresholds": [],
|
||||
"unit": "none",
|
||||
"valueMappings": []
|
||||
},
|
||||
"prefix": "",
|
||||
"showThresholdLabels": false,
|
||||
"showThresholdMarkers": true,
|
||||
"stat": "max",
|
||||
"suffix": "",
|
||||
"thresholds": [
|
||||
{
|
||||
"color": "#6ED0E0",
|
||||
"index": 2,
|
||||
"value": 75
|
||||
},
|
||||
{
|
||||
"color": "#EAB839",
|
||||
"index": 1,
|
||||
"value": 50
|
||||
},
|
||||
{
|
||||
"color": "#7EB26D",
|
||||
"index": 0,
|
||||
"value": null
|
||||
}
|
||||
],
|
||||
"unit": "none",
|
||||
"valueMappings": []
|
||||
},
|
||||
"targets": [
|
||||
{
|
||||
"refId": "A",
|
||||
"scenarioId": "random_walk"
|
||||
},
|
||||
{
|
||||
"refId": "B",
|
||||
"scenarioId": "random_walk"
|
||||
},
|
||||
{
|
||||
"refId": "C",
|
||||
"scenarioId": "random_walk"
|
||||
},
|
||||
{
|
||||
"refId": "D",
|
||||
"scenarioId": "random_walk"
|
||||
},
|
||||
{
|
||||
"refId": "E",
|
||||
"scenarioId": "random_walk"
|
||||
}
|
||||
],
|
||||
"timeFrom": null,
|
||||
"timeShift": null,
|
||||
"title": "Vertical",
|
||||
"type": "gauge"
|
||||
}
|
||||
],
|
||||
"schemaVersion": 17,
|
||||
"style": "dark",
|
||||
"tags": [],
|
||||
"templating": {
|
||||
"list": []
|
||||
},
|
||||
"time": {
|
||||
"from": "now-6h",
|
||||
"to": "now"
|
||||
},
|
||||
"timepicker": {
|
||||
"refresh_intervals": ["5s", "10s", "30s", "1m", "5m", "15m", "30m", "1h", "2h", "1d"],
|
||||
"time_options": ["5m", "15m", "1h", "6h", "12h", "24h", "2d", "7d", "30d"]
|
||||
},
|
||||
"timezone": "",
|
||||
"title": "Multi series gauges",
|
||||
"uid": "szkuR1umk",
|
||||
"version": 7
|
||||
}
|
||||
@@ -104,7 +104,6 @@
|
||||
}
|
||||
],
|
||||
"timeFrom": null,
|
||||
"timeRegions": [],
|
||||
"timeShift": null,
|
||||
"title": "Always OK",
|
||||
"tooltip": {
|
||||
@@ -233,7 +232,6 @@
|
||||
}
|
||||
],
|
||||
"timeFrom": null,
|
||||
"timeRegions": [],
|
||||
"timeShift": null,
|
||||
"title": "Always Alerting",
|
||||
"tooltip": {
|
||||
@@ -364,7 +362,6 @@
|
||||
}
|
||||
],
|
||||
"timeFrom": null,
|
||||
"timeRegions": [],
|
||||
"timeShift": null,
|
||||
"title": "No data",
|
||||
"tooltip": {
|
||||
@@ -435,7 +432,7 @@
|
||||
"for": "1m",
|
||||
"frequency": "1m",
|
||||
"handler": 1,
|
||||
"name": "TestData - Always Pending",
|
||||
"name": "TestData - Always Alerting with For",
|
||||
"noDataState": "no_data",
|
||||
"notifications": []
|
||||
},
|
||||
@@ -495,138 +492,6 @@
|
||||
}
|
||||
],
|
||||
"timeFrom": null,
|
||||
"timeRegions": [],
|
||||
"timeShift": null,
|
||||
"title": "Always Alerting with For",
|
||||
"tooltip": {
|
||||
"msResolution": false,
|
||||
"shared": true,
|
||||
"sort": 0,
|
||||
"value_type": "cumulative"
|
||||
},
|
||||
"type": "graph",
|
||||
"xaxis": {
|
||||
"buckets": null,
|
||||
"mode": "time",
|
||||
"name": null,
|
||||
"show": true,
|
||||
"values": []
|
||||
},
|
||||
"yaxes": [
|
||||
{
|
||||
"format": "short",
|
||||
"label": "",
|
||||
"logBase": 1,
|
||||
"max": null,
|
||||
"min": "0",
|
||||
"show": true
|
||||
},
|
||||
{
|
||||
"format": "short",
|
||||
"label": "",
|
||||
"logBase": 1,
|
||||
"max": null,
|
||||
"min": null,
|
||||
"show": true
|
||||
}
|
||||
],
|
||||
"yaxis": {
|
||||
"align": false,
|
||||
"alignLevel": null
|
||||
}
|
||||
},
|
||||
{
|
||||
"alert": {
|
||||
"conditions": [
|
||||
{
|
||||
"evaluator": {
|
||||
"params": [
|
||||
100
|
||||
],
|
||||
"type": "gt"
|
||||
},
|
||||
"operator": {
|
||||
"type": "and"
|
||||
},
|
||||
"query": {
|
||||
"params": [
|
||||
"A",
|
||||
"5m",
|
||||
"now"
|
||||
]
|
||||
},
|
||||
"reducer": {
|
||||
"params": [],
|
||||
"type": "avg"
|
||||
},
|
||||
"type": "query"
|
||||
}
|
||||
],
|
||||
"executionErrorState": "alerting",
|
||||
"for": "900000h",
|
||||
"frequency": "1m",
|
||||
"handler": 1,
|
||||
"name": "Always Pending",
|
||||
"noDataState": "no_data",
|
||||
"notifications": []
|
||||
},
|
||||
"aliasColors": {},
|
||||
"bars": false,
|
||||
"dashLength": 10,
|
||||
"dashes": false,
|
||||
"datasource": "gdev-testdata",
|
||||
"editable": true,
|
||||
"error": false,
|
||||
"fill": 1,
|
||||
"gridPos": {
|
||||
"h": 7,
|
||||
"w": 12,
|
||||
"x": 12,
|
||||
"y": 14
|
||||
},
|
||||
"id": 7,
|
||||
"isNew": true,
|
||||
"legend": {
|
||||
"avg": false,
|
||||
"current": false,
|
||||
"max": false,
|
||||
"min": false,
|
||||
"show": true,
|
||||
"total": false,
|
||||
"values": false
|
||||
},
|
||||
"lines": true,
|
||||
"linewidth": 2,
|
||||
"links": [],
|
||||
"nullPointMode": "connected",
|
||||
"percentage": false,
|
||||
"pointradius": 5,
|
||||
"points": false,
|
||||
"renderer": "flot",
|
||||
"seriesOverrides": [],
|
||||
"spaceLength": 10,
|
||||
"stack": false,
|
||||
"steppedLine": false,
|
||||
"targets": [
|
||||
{
|
||||
"refId": "A",
|
||||
"scenario": "random_walk",
|
||||
"scenarioId": "csv_metric_values",
|
||||
"stringInput": "200,445,100,150,200,220,190",
|
||||
"target": ""
|
||||
}
|
||||
],
|
||||
"thresholds": [
|
||||
{
|
||||
"colorMode": "critical",
|
||||
"fill": true,
|
||||
"line": true,
|
||||
"op": "gt",
|
||||
"value": 100
|
||||
}
|
||||
],
|
||||
"timeFrom": null,
|
||||
"timeRegions": [],
|
||||
"timeShift": null,
|
||||
"title": "Always Alerting with For",
|
||||
"tooltip": {
|
||||
@@ -708,5 +573,5 @@
|
||||
"timezone": "browser",
|
||||
"title": "Alerting with TestData",
|
||||
"uid": "7MeksYbmk",
|
||||
"version": 7
|
||||
"version": 1
|
||||
}
|
||||
@@ -1,7 +0,0 @@
|
||||
|
||||
FROM golang:latest
|
||||
ADD main.go /
|
||||
WORKDIR /
|
||||
RUN go build -o main .
|
||||
EXPOSE 3010
|
||||
ENTRYPOINT ["/main"]
|
||||
@@ -1,5 +0,0 @@
|
||||
alert_webhook_listener:
|
||||
build: docker/blocks/alert_webhook_listener
|
||||
network_mode: host
|
||||
ports:
|
||||
- "3010:3010"
|
||||
@@ -1,24 +0,0 @@
|
||||
package main
|
||||
|
||||
import (
|
||||
"fmt"
|
||||
"io"
|
||||
"io/ioutil"
|
||||
"net/http"
|
||||
)
|
||||
|
||||
func hello(w http.ResponseWriter, r *http.Request) {
|
||||
body, err := ioutil.ReadAll(r.Body)
|
||||
if err != nil {
|
||||
return
|
||||
}
|
||||
|
||||
line := fmt.Sprintf("webbhook: -> %s", string(body))
|
||||
fmt.Println(line)
|
||||
io.WriteString(w, line)
|
||||
}
|
||||
|
||||
func main() {
|
||||
http.HandleFunc("/", hello)
|
||||
http.ListenAndServe(":3010", nil)
|
||||
}
|
||||
@@ -5,7 +5,7 @@
|
||||
- "9200:9200"
|
||||
- "9300:9300"
|
||||
volumes:
|
||||
- ./docker/blocks/elastic/elasticsearch.yml:/usr/share/elasticsearch/config/elasticsearch.yml
|
||||
- ./blocks/elastic/elasticsearch.yml:/usr/share/elasticsearch/config/elasticsearch.yml
|
||||
|
||||
fake-elastic-data:
|
||||
image: grafana/fake-data-gen
|
||||
|
||||
@@ -1,15 +1,15 @@
|
||||
# You need to run 'sysctl -w vm.max_map_count=262144' on the host machine
|
||||
|
||||
elasticsearch5:
|
||||
image: elasticsearch:5
|
||||
command: elasticsearch
|
||||
ports:
|
||||
- '10200:9200'
|
||||
- '10300:9300'
|
||||
- "10200:9200"
|
||||
- "10300:9300"
|
||||
|
||||
fake-elastic5-data:
|
||||
image: grafana/fake-data-gen
|
||||
links:
|
||||
- elasticsearch5
|
||||
# network_mode: bridge
|
||||
network_mode: bridge
|
||||
environment:
|
||||
FD_DATASOURCE: elasticsearch
|
||||
FD_PORT: 10200
|
||||
|
||||
@@ -1,54 +0,0 @@
|
||||
version: '3'
|
||||
|
||||
volumes:
|
||||
freeipa_data: {}
|
||||
|
||||
services:
|
||||
freeipa:
|
||||
image: freeipa/freeipa-server:fedora-29
|
||||
container_name: freeipa
|
||||
stdin_open: true
|
||||
tty: true
|
||||
sysctls:
|
||||
- net.ipv6.conf.all.disable_ipv6=0
|
||||
hostname: ipa.example.test
|
||||
environment:
|
||||
# - DEBUG_TRACE=1
|
||||
- IPA_SERVER_IP=172.17.0.2
|
||||
- DEBUG_NO_EXIT=1
|
||||
- IPA_SERVER_HOSTNAME=ipa.example.test
|
||||
- PASSWORD=Secret123
|
||||
- HOSTNAME=ipa.example.test
|
||||
command:
|
||||
- --admin-password=Secret123
|
||||
- --ds-password=Secret123
|
||||
- -U
|
||||
- --realm=EXAMPLE.TEST
|
||||
ports:
|
||||
# FreeIPA WebUI
|
||||
- "80:80"
|
||||
- "443:443"
|
||||
# Kerberos
|
||||
- "88:88/udp"
|
||||
- "88:88"
|
||||
- "464:464/udp"
|
||||
- "464:464"
|
||||
# LDAP
|
||||
- "389:389"
|
||||
- "636:636"
|
||||
# DNS
|
||||
# - "53:53/udp"
|
||||
# - "53:53"
|
||||
# NTP
|
||||
- "123:123/udp"
|
||||
# other
|
||||
- "7389:7389"
|
||||
- "9443:9443"
|
||||
- "9444:9444"
|
||||
- "9445:9445"
|
||||
tmpfs:
|
||||
- /run
|
||||
- /tmp
|
||||
volumes:
|
||||
- freeipa_data:/data:Z
|
||||
- /sys/fs/cgroup:/sys/fs/cgroup:ro
|
||||
@@ -1,74 +0,0 @@
|
||||
# To troubleshoot and get more log info enable ldap debug logging in grafana.ini
|
||||
# [log]
|
||||
# filters = ldap:debug
|
||||
|
||||
[[servers]]
|
||||
# Ldap server host (specify multiple hosts space separated)
|
||||
host = "172.17.0.1"
|
||||
# Default port is 389 or 636 if use_ssl = true
|
||||
port = 389
|
||||
# Set to true if ldap server supports TLS
|
||||
use_ssl = false
|
||||
# Set to true if connect ldap server with STARTTLS pattern (create connection in insecure, then upgrade to secure connection with TLS)
|
||||
start_tls = false
|
||||
# set to true if you want to skip ssl cert validation
|
||||
ssl_skip_verify = false
|
||||
# set to the path to your root CA certificate or leave unset to use system defaults
|
||||
# root_ca_cert = "/path/to/certificate.crt"
|
||||
|
||||
# Search user bind dn
|
||||
bind_dn = "uid=admin,cn=users,cn=accounts,dc=example,dc=test"
|
||||
# Search user bind password
|
||||
# If the password contains # or ; you have to wrap it with triple quotes. Ex """#password;"""
|
||||
bind_password = 'Secret123'
|
||||
|
||||
# User search filter, for example "(cn=%s)" or "(sAMAccountName=%s)" or "(uid=%s)"
|
||||
search_filter = "(uid=%s)"
|
||||
|
||||
# An array of base dns to search through
|
||||
search_base_dns = ["cn=users,cn=accounts,dc=example,dc=test"]
|
||||
|
||||
# In POSIX LDAP schemas, without memberOf attribute a secondary query must be made for groups.
|
||||
# This is done by enabling group_search_filter below. You must also set member_of= "cn"
|
||||
# in [servers.attributes] below.
|
||||
|
||||
# Users with nested/recursive group membership and an LDAP server that supports LDAP_MATCHING_RULE_IN_CHAIN
|
||||
# can set group_search_filter, group_search_filter_user_attribute, group_search_base_dns and member_of
|
||||
# below in such a way that the user's recursive group membership is considered.
|
||||
#
|
||||
# Nested Groups + Active Directory (AD) Example:
|
||||
#
|
||||
# AD groups store the Distinguished Names (DNs) of members, so your filter must
|
||||
# recursively search your groups for the authenticating user's DN. For example:
|
||||
#
|
||||
# group_search_filter = "(member:1.2.840.113556.1.4.1941:=%s)"
|
||||
# group_search_filter_user_attribute = "distinguishedName"
|
||||
# group_search_base_dns = ["ou=groups,dc=grafana,dc=org"]
|
||||
#
|
||||
# [servers.attributes]
|
||||
# ...
|
||||
# member_of = "distinguishedName"
|
||||
|
||||
## Group search filter, to retrieve the groups of which the user is a member (only set if memberOf attribute is not available)
|
||||
# group_search_filter = "(&(objectClass=posixGroup)(memberUid=%s))"
|
||||
## Group search filter user attribute defines what user attribute gets substituted for %s in group_search_filter.
|
||||
## Defaults to the value of username in [server.attributes]
|
||||
## Valid options are any of your values in [servers.attributes]
|
||||
## If you are using nested groups you probably want to set this and member_of in
|
||||
## [servers.attributes] to "distinguishedName"
|
||||
# group_search_filter_user_attribute = "distinguishedName"
|
||||
## An array of the base DNs to search through for groups. Typically uses ou=groups
|
||||
# group_search_base_dns = ["ou=groups,dc=grafana,dc=org"]
|
||||
|
||||
# Specify names of the ldap attributes your ldap uses
|
||||
[servers.attributes]
|
||||
name = "givenName"
|
||||
username = "uid"
|
||||
member_of = "memberOf"
|
||||
# surname = "sn"
|
||||
# email = "mail"
|
||||
|
||||
[[servers.group_mappings]]
|
||||
# If you want to match all (or no ldap groups) then you can use wildcard
|
||||
group_dn = "*"
|
||||
org_role = "Viewer"
|
||||
@@ -1,32 +0,0 @@
|
||||
# Notes on FreeIPA LDAP Docker Block
|
||||
|
||||
Users have to be created manually. The docker-compose up command takes a few minutes to run.
|
||||
|
||||
## Create a user
|
||||
|
||||
`docker exec -it freeipa /bin/bash`
|
||||
|
||||
To create a user with username: `ldap-viewer` and password: `grafana123`
|
||||
|
||||
```bash
|
||||
kinit admin
|
||||
```
|
||||
|
||||
Log in with password `Secret123`
|
||||
|
||||
```bash
|
||||
ipa user-add ldap-viewer --first ldap --last viewer
|
||||
ipa passwd ldap-viewer
|
||||
ldappasswd -D uid=ldap-viewer,cn=users,cn=accounts,dc=example,dc=org -w test -a test -s grafana123
|
||||
```
|
||||
|
||||
## Enabling FreeIPA LDAP in Grafana
|
||||
|
||||
Copy the ldap_freeipa.toml file in this folder into your `conf` folder (it is gitignored already). To enable it in the .ini file to get Grafana to use this block:
|
||||
|
||||
```ini
|
||||
[auth.ldap]
|
||||
enabled = true
|
||||
config_file = conf/ldap_freeipa.toml
|
||||
; allow_sign_up = true
|
||||
```
|
||||
@@ -2,16 +2,16 @@
|
||||
image: influxdb:latest
|
||||
container_name: influxdb
|
||||
ports:
|
||||
- '2004:2004'
|
||||
- '8083:8083'
|
||||
- '8086:8086'
|
||||
- "2004:2004"
|
||||
- "8083:8083"
|
||||
- "8086:8086"
|
||||
volumes:
|
||||
- ./docker/blocks/influxdb/influxdb.conf:/etc/influxdb/influxdb.conf
|
||||
|
||||
fake-influxdb-data:
|
||||
image: grafana/fake-data-gen
|
||||
links:
|
||||
- influxdb
|
||||
network_mode: bridge
|
||||
environment:
|
||||
FD_DATASOURCE: influxdb
|
||||
FD_PORT: 8086
|
||||
|
||||
|
||||
@@ -69,7 +69,6 @@ reporting-disabled = false
|
||||
|
||||
unix-socket-enabled = false # enable http service over unix domain socket
|
||||
# bind-socket = "/var/run/influxdb.sock"
|
||||
flux-enabled = true
|
||||
|
||||
[subscriber]
|
||||
enabled = true
|
||||
|
||||
@@ -1,27 +0,0 @@
|
||||
server:
|
||||
http_listen_port: 9080
|
||||
grpc_listen_port: 0
|
||||
|
||||
positions:
|
||||
filename: /tmp/positions.yaml
|
||||
|
||||
client:
|
||||
url: http://loki:3100/api/prom/push
|
||||
|
||||
scrape_configs:
|
||||
- job_name: system
|
||||
entry_parser: raw
|
||||
static_configs:
|
||||
- targets:
|
||||
- localhost
|
||||
labels:
|
||||
job: varlogs
|
||||
__path__: /var/log/*log
|
||||
- job_name: grafana
|
||||
entry_parser: raw
|
||||
static_configs:
|
||||
- targets:
|
||||
- localhost
|
||||
labels:
|
||||
job: grafana
|
||||
__path__: /var/log/grafana/*log
|
||||
@@ -1,14 +0,0 @@
|
||||
loki:
|
||||
image: grafana/loki:master
|
||||
ports:
|
||||
- "3100:3100"
|
||||
command: -config.file=/etc/loki/local-config.yaml
|
||||
|
||||
promtail:
|
||||
image: grafana/promtail:master
|
||||
volumes:
|
||||
- ./docker/blocks/loki/config.yaml:/etc/promtail/docker-config.yaml
|
||||
- /var/log:/var/log
|
||||
- ../data/log:/var/log/grafana
|
||||
command:
|
||||
-config.file=/etc/promtail/docker-config.yaml
|
||||
@@ -1,3 +1,3 @@
|
||||
FROM prom/prometheus:v2.7.2
|
||||
FROM prom/prometheus:v2.2.0
|
||||
ADD prometheus.yml /etc/prometheus/
|
||||
ADD alert.rules /etc/prometheus/
|
||||
|
||||
@@ -1,4 +1,4 @@
|
||||
redis:
|
||||
memcached:
|
||||
image: redis:latest
|
||||
ports:
|
||||
- "6379:6379"
|
||||
|
||||
@@ -7,13 +7,6 @@ services:
|
||||
- "80:80"
|
||||
volumes:
|
||||
- /var/run/docker.sock:/tmp/docker.sock:ro
|
||||
depends_on:
|
||||
db:
|
||||
condition: service_healthy
|
||||
logging:
|
||||
driver: "fluentd"
|
||||
options:
|
||||
tag: nginx
|
||||
|
||||
db:
|
||||
image: mysql:5.6
|
||||
@@ -22,7 +15,6 @@ services:
|
||||
MYSQL_DATABASE: grafana
|
||||
MYSQL_USER: grafana
|
||||
MYSQL_PASSWORD: password
|
||||
command: [mysqld, --character-set-server=utf8mb4, --collation-server=utf8mb4_unicode_ci, --innodb_monitor_enable=all, --max-connections=1001]
|
||||
ports:
|
||||
- 3306
|
||||
healthcheck:
|
||||
@@ -30,16 +22,6 @@ services:
|
||||
timeout: 10s
|
||||
retries: 10
|
||||
|
||||
mysqld-exporter:
|
||||
image: prom/mysqld-exporter
|
||||
environment:
|
||||
- DATA_SOURCE_NAME=root:rootpass@(db:3306)/
|
||||
ports:
|
||||
- 9104
|
||||
depends_on:
|
||||
db:
|
||||
condition: service_healthy
|
||||
|
||||
# db:
|
||||
# image: postgres:9.3
|
||||
# environment:
|
||||
@@ -65,7 +47,6 @@ services:
|
||||
- GF_DATABASE_PASSWORD=password
|
||||
- GF_DATABASE_TYPE=mysql
|
||||
- GF_DATABASE_HOST=db:3306
|
||||
- GF_DATABASE_MAX_OPEN_CONN=300
|
||||
- GF_SESSION_PROVIDER=mysql
|
||||
- GF_SESSION_PROVIDER_CONFIG=grafana:password@tcp(db:3306)/grafana?allowNativePasswords=true
|
||||
# - GF_DATABASE_TYPE=postgres
|
||||
@@ -73,19 +54,12 @@ services:
|
||||
# - GF_DATABASE_SSL_MODE=disable
|
||||
# - GF_SESSION_PROVIDER=postgres
|
||||
# - GF_SESSION_PROVIDER_CONFIG=user=grafana password=password host=db port=5432 dbname=grafana sslmode=disable
|
||||
- GF_SERVER_ROUTER_LOGGING=true
|
||||
- GF_LOG_CONSOLE_FORMAT=json
|
||||
- GF_LOG_FILTERS=alerting.notifier:debug,alerting.notifier.slack:debug,auth:debug
|
||||
- GF_AUTH_TOKEN_ROTATION_INTERVAL_MINUTES=2
|
||||
- GF_LOG_FILTERS=alerting.notifier:debug,alerting.notifier.slack:debug
|
||||
ports:
|
||||
- 3000
|
||||
depends_on:
|
||||
db:
|
||||
condition: service_healthy
|
||||
logging:
|
||||
driver: "fluentd"
|
||||
options:
|
||||
tag: grafana
|
||||
|
||||
prometheus:
|
||||
image: prom/prometheus:v2.4.2
|
||||
@@ -96,20 +70,9 @@ services:
|
||||
ports:
|
||||
- 9090
|
||||
|
||||
loki:
|
||||
image: grafana/loki:master
|
||||
environment:
|
||||
- VIRTUAL_HOST=loki.loc
|
||||
ports:
|
||||
- 3100
|
||||
command: -config.file=/etc/loki/local-config.yaml
|
||||
|
||||
fluentd:
|
||||
image: grafana/fluent-plugin-loki:master
|
||||
volumes:
|
||||
- ./fluentd/fluentd.conf:/fluentd/etc/fluentd.conf
|
||||
links:
|
||||
- loki
|
||||
ports:
|
||||
- "24224:24224"
|
||||
- "24224:24224/udp"
|
||||
# mysqld-exporter:
|
||||
# image: prom/mysqld-exporter
|
||||
# environment:
|
||||
# - DATA_SOURCE_NAME=grafana:password@(mysql:3306)/
|
||||
# ports:
|
||||
# - 9104
|
||||
|
||||
@@ -1,73 +0,0 @@
|
||||
<source>
|
||||
@type forward
|
||||
port 24224
|
||||
bind 0.0.0.0
|
||||
</source>
|
||||
|
||||
<filter grafana>
|
||||
@type parser
|
||||
<parse>
|
||||
@type json
|
||||
json_parser json
|
||||
</parse>
|
||||
replace_invalid_sequence true
|
||||
emit_invalid_record_to_error false
|
||||
key_name log
|
||||
reserve_data true
|
||||
remove_key_name_field true
|
||||
</filter>
|
||||
|
||||
<filter nginx>
|
||||
@type parser
|
||||
format /^.*m(?<host>[^ ]*) (?<remote>[^ ]*) \- \- \[(?<time>[^\]]*)\] \"(?<method>\S+)(?: +(?<path>[^\"]*) +\S*)?\" (?<code>[^ ]*) (?<size>[^ ]*)(?: \"(?<referer>[^\"]*)\" \"(?<agent>[^\"]*)\")?$/
|
||||
time_format %d/%b/%Y:%H:%M:%S %z
|
||||
key_name log
|
||||
reserve_data true
|
||||
remove_key_name_field true
|
||||
</filter>
|
||||
|
||||
<filter **>
|
||||
@type record_transformer
|
||||
remove_keys "source,t"
|
||||
</filter>
|
||||
|
||||
<match grafana>
|
||||
@type copy
|
||||
<store>
|
||||
@type stdout
|
||||
output_type json
|
||||
</store>
|
||||
<store>
|
||||
@type loki
|
||||
url "http://loki:3100"
|
||||
extra_labels {"app":"grafana"}
|
||||
label_keys "container_name,container_id,logger"
|
||||
flush_interval 10s
|
||||
flush_at_shutdown true
|
||||
buffer_chunk_limit 1m
|
||||
</store>
|
||||
</match>
|
||||
|
||||
<filter nginx>
|
||||
@type record_transformer
|
||||
<record>
|
||||
lvl "info"
|
||||
</record>
|
||||
</filter>
|
||||
|
||||
<match nginx>
|
||||
@type copy
|
||||
<store>
|
||||
@type stdout
|
||||
output_type json
|
||||
</store>
|
||||
<store>
|
||||
@type loki
|
||||
url "http://loki:3100"
|
||||
extra_labels {"app":"nginx"}
|
||||
label_keys "container_name,container_id"
|
||||
flush_interval 10s
|
||||
flush_at_shutdown true
|
||||
buffer_chunk_limit 1m
|
||||
</store>
|
||||
</match>
|
||||
@@ -6,9 +6,3 @@ providers:
|
||||
type: file
|
||||
options:
|
||||
path: /etc/grafana/provisioning/dashboards/alerts
|
||||
|
||||
- name: 'MySQL'
|
||||
folder: 'MySQL'
|
||||
type: file
|
||||
options:
|
||||
path: /etc/grafana/provisioning/dashboards/mysql
|
||||
File diff suppressed because it is too large
Load Diff
@@ -8,9 +8,4 @@ datasources:
|
||||
jsonData:
|
||||
timeInterval: 10s
|
||||
queryTimeout: 30s
|
||||
httpMethod: POST
|
||||
|
||||
- name: Loki
|
||||
type: loki
|
||||
access: proxy
|
||||
url: http://loki:3100
|
||||
httpMethod: POST
|
||||
@@ -30,18 +30,10 @@ scrape_configs:
|
||||
port: 3000
|
||||
refresh_interval: 10s
|
||||
|
||||
- job_name: 'mysql'
|
||||
dns_sd_configs:
|
||||
- names:
|
||||
- 'mysqld-exporter'
|
||||
type: 'A'
|
||||
port: 9104
|
||||
refresh_interval: 10s
|
||||
|
||||
- job_name: 'loki'
|
||||
dns_sd_configs:
|
||||
- names:
|
||||
- 'loki'
|
||||
type: 'A'
|
||||
port: 3100
|
||||
refresh_interval: 10s
|
||||
# - job_name: 'mysql'
|
||||
# dns_sd_configs:
|
||||
# - names:
|
||||
# - 'mysqld-exporter'
|
||||
# type: 'A'
|
||||
# port: 9104
|
||||
# refresh_interval: 10s
|
||||
@@ -1,81 +0,0 @@
|
||||
# Grafana load test
|
||||
|
||||
Runs load tests and checks using [k6](https://k6.io/).
|
||||
|
||||
## Prerequisites
|
||||
|
||||
Docker
|
||||
|
||||
## Run
|
||||
|
||||
Run load test for 15 minutes using 2 virtual users and targeting http://localhost:3000.
|
||||
|
||||
```bash
|
||||
$ ./run.sh
|
||||
```
|
||||
|
||||
Run load test for custom duration:
|
||||
|
||||
```bash
|
||||
$ ./run.sh -d 10s
|
||||
```
|
||||
|
||||
Run load test for custom target url:
|
||||
|
||||
```bash
|
||||
$ ./run.sh -u http://grafana.loc
|
||||
```
|
||||
|
||||
Run load test for 10 virtual users:
|
||||
|
||||
```bash
|
||||
$ ./run.sh -v 10
|
||||
```
|
||||
|
||||
Example output:
|
||||
|
||||
```bash
|
||||
|
||||
/\ |‾‾| /‾‾/ /‾/
|
||||
/\ / \ | |_/ / / /
|
||||
/ \/ \ | | / ‾‾\
|
||||
/ \ | |‾\ \ | (_) |
|
||||
/ __________ \ |__| \__\ \___/ .io
|
||||
|
||||
execution: local
|
||||
output: -
|
||||
script: src/auth_token_test.js
|
||||
|
||||
duration: 15m0s, iterations: -
|
||||
vus: 2, max: 2
|
||||
|
||||
done [==========================================================] 15m0s / 15m0s
|
||||
|
||||
█ user auth token test
|
||||
|
||||
█ user authenticates thru ui with username and password
|
||||
|
||||
✓ response status is 200
|
||||
✓ response has cookie 'grafana_session' with 32 characters
|
||||
|
||||
█ batch tsdb requests
|
||||
|
||||
✓ response status is 200
|
||||
|
||||
checks.....................: 100.00% ✓ 32844 ✗ 0
|
||||
data_received..............: 411 MB 457 kB/s
|
||||
data_sent..................: 12 MB 14 kB/s
|
||||
group_duration.............: avg=95.64ms min=16.42ms med=94.35ms max=307.52ms p(90)=137.78ms p(95)=146.75ms
|
||||
http_req_blocked...........: avg=1.27ms min=942ns med=610.08µs max=48.32ms p(90)=2.92ms p(95)=4.25ms
|
||||
http_req_connecting........: avg=1.06ms min=0s med=456.79µs max=47.19ms p(90)=2.55ms p(95)=3.78ms
|
||||
http_req_duration..........: avg=58.16ms min=1ms med=52.59ms max=293.35ms p(90)=109.53ms p(95)=120.19ms
|
||||
http_req_receiving.........: avg=38.98µs min=6.43µs med=32.55µs max=16.2ms p(90)=64.63µs p(95)=78.8µs
|
||||
http_req_sending...........: avg=328.66µs min=8.09µs med=110.77µs max=44.13ms p(90)=552.65µs p(95)=1.09ms
|
||||
http_req_tls_handshaking...: avg=0s min=0s med=0s max=0s p(90)=0s p(95)=0s
|
||||
http_req_waiting...........: avg=57.79ms min=935.02µs med=52.15ms max=293.06ms p(90)=109.04ms p(95)=119.71ms
|
||||
http_reqs..................: 34486 38.317775/s
|
||||
iteration_duration.........: avg=1.09s min=1.81µs med=1.09s max=1.3s p(90)=1.13s p(95)=1.14s
|
||||
iterations.................: 1642 1.824444/s
|
||||
vus........................: 2 min=2 max=2
|
||||
vus_max....................: 2 min=2 max=2
|
||||
```
|
||||
@@ -1,71 +0,0 @@
|
||||
import { sleep, check, group } from 'k6';
|
||||
import { createClient, createBasicAuthClient } from './modules/client.js';
|
||||
import { createTestOrgIfNotExists, createTestdataDatasourceIfNotExists } from './modules/util.js';
|
||||
|
||||
export let options = {
|
||||
noCookiesReset: true
|
||||
};
|
||||
|
||||
let endpoint = __ENV.URL || 'http://localhost:3000';
|
||||
const client = createClient(endpoint);
|
||||
|
||||
export const setup = () => {
|
||||
const basicAuthClient = createBasicAuthClient(endpoint, 'admin', 'admin');
|
||||
const orgId = createTestOrgIfNotExists(basicAuthClient);
|
||||
const datasourceId = createTestdataDatasourceIfNotExists(basicAuthClient);
|
||||
client.withOrgId(orgId);
|
||||
return {
|
||||
orgId: orgId,
|
||||
datasourceId: datasourceId,
|
||||
};
|
||||
}
|
||||
|
||||
export default (data) => {
|
||||
group("user auth token test", () => {
|
||||
if (__ITER === 0) {
|
||||
group("user authenticates thru ui with username and password", () => {
|
||||
let res = client.ui.login('admin', 'admin');
|
||||
|
||||
check(res, {
|
||||
'response status is 200': (r) => r.status === 200,
|
||||
'response has cookie \'grafana_session\' with 32 characters': (r) => r.cookies.grafana_session[0].value.length === 32,
|
||||
});
|
||||
});
|
||||
}
|
||||
|
||||
if (__ITER !== 0) {
|
||||
group("batch tsdb requests", () => {
|
||||
const batchCount = 20;
|
||||
const requests = [];
|
||||
const payload = {
|
||||
from: '1547765247624',
|
||||
to: '1547768847624',
|
||||
queries: [{
|
||||
refId: 'A',
|
||||
scenarioId: 'random_walk',
|
||||
intervalMs: 10000,
|
||||
maxDataPoints: 433,
|
||||
datasourceId: data.datasourceId,
|
||||
}]
|
||||
};
|
||||
|
||||
requests.push({ method: 'GET', url: '/api/annotations?dashboardId=2074&from=1548078832772&to=1548082432772' });
|
||||
|
||||
for (let n = 0; n < batchCount; n++) {
|
||||
requests.push({ method: 'POST', url: '/api/tsdb/query', body: payload });
|
||||
}
|
||||
|
||||
let responses = client.batch(requests);
|
||||
for (let n = 0; n < batchCount; n++) {
|
||||
check(responses[n], {
|
||||
'response status is 200': (r) => r.status === 200,
|
||||
});
|
||||
}
|
||||
});
|
||||
}
|
||||
});
|
||||
|
||||
sleep(5)
|
||||
}
|
||||
|
||||
export const teardown = (data) => {}
|
||||
@@ -1,187 +0,0 @@
|
||||
import http from "k6/http";
|
||||
import encoding from 'k6/encoding';
|
||||
|
||||
export const UIEndpoint = class UIEndpoint {
|
||||
constructor(httpClient) {
|
||||
this.httpClient = httpClient;
|
||||
}
|
||||
|
||||
login(username, pwd) {
|
||||
const payload = { user: username, password: pwd };
|
||||
return this.httpClient.formPost('/login', payload);
|
||||
}
|
||||
}
|
||||
|
||||
export const DatasourcesEndpoint = class DatasourcesEndpoint {
|
||||
constructor(httpClient) {
|
||||
this.httpClient = httpClient;
|
||||
}
|
||||
|
||||
getById(id) {
|
||||
return this.httpClient.get(`/datasources/${id}`);
|
||||
}
|
||||
|
||||
getByName(name) {
|
||||
return this.httpClient.get(`/datasources/name/${name}`);
|
||||
}
|
||||
|
||||
create(payload) {
|
||||
return this.httpClient.post(`/datasources`, JSON.stringify(payload));
|
||||
}
|
||||
|
||||
delete(id) {
|
||||
return this.httpClient.delete(`/datasources/${id}`);
|
||||
}
|
||||
}
|
||||
|
||||
export const OrganizationsEndpoint = class OrganizationsEndpoint {
|
||||
constructor(httpClient) {
|
||||
this.httpClient = httpClient;
|
||||
}
|
||||
|
||||
getById(id) {
|
||||
return this.httpClient.get(`/orgs/${id}`);
|
||||
}
|
||||
|
||||
getByName(name) {
|
||||
return this.httpClient.get(`/orgs/name/${name}`);
|
||||
}
|
||||
|
||||
create(name) {
|
||||
let payload = {
|
||||
name: name,
|
||||
};
|
||||
return this.httpClient.post(`/orgs`, JSON.stringify(payload));
|
||||
}
|
||||
|
||||
delete(id) {
|
||||
return this.httpClient.delete(`/orgs/${id}`);
|
||||
}
|
||||
}
|
||||
|
||||
export const GrafanaClient = class GrafanaClient {
|
||||
constructor(httpClient) {
|
||||
httpClient.onBeforeRequest = this.onBeforeRequest;
|
||||
this.raw = httpClient;
|
||||
this.ui = new UIEndpoint(httpClient);
|
||||
this.orgs = new OrganizationsEndpoint(httpClient.withUrl('/api'));
|
||||
this.datasources = new DatasourcesEndpoint(httpClient.withUrl('/api'));
|
||||
}
|
||||
|
||||
batch(requests) {
|
||||
return this.raw.batch(requests);
|
||||
}
|
||||
|
||||
withOrgId(orgId) {
|
||||
this.orgId = orgId;
|
||||
}
|
||||
|
||||
onBeforeRequest(params) {
|
||||
if (this.orgId && this.orgId > 0) {
|
||||
params = params.headers || {};
|
||||
params.headers["X-Grafana-Org-Id"] = this.orgId;
|
||||
}
|
||||
}
|
||||
}
|
||||
|
||||
export const BaseClient = class BaseClient {
|
||||
constructor(url, subUrl) {
|
||||
if (url.endsWith('/')) {
|
||||
url = url.substring(0, url.length - 1);
|
||||
}
|
||||
|
||||
if (subUrl.endsWith('/')) {
|
||||
subUrl = subUrl.substring(0, subUrl.length - 1);
|
||||
}
|
||||
|
||||
this.url = url + subUrl;
|
||||
this.onBeforeRequest = () => {};
|
||||
}
|
||||
|
||||
withUrl(subUrl) {
|
||||
let c = new BaseClient(this.url, subUrl);
|
||||
c.onBeforeRequest = this.onBeforeRequest;
|
||||
return c;
|
||||
}
|
||||
|
||||
beforeRequest(params) {
|
||||
|
||||
}
|
||||
|
||||
get(url, params) {
|
||||
params = params || {};
|
||||
this.beforeRequest(params);
|
||||
this.onBeforeRequest(params);
|
||||
return http.get(this.url + url, params);
|
||||
}
|
||||
|
||||
formPost(url, body, params) {
|
||||
params = params || {};
|
||||
this.beforeRequest(params);
|
||||
this.onBeforeRequest(params);
|
||||
return http.post(this.url + url, body, params);
|
||||
}
|
||||
|
||||
post(url, body, params) {
|
||||
params = params || {};
|
||||
params.headers = params.headers || {};
|
||||
params.headers['Content-Type'] = 'application/json';
|
||||
|
||||
this.beforeRequest(params);
|
||||
this.onBeforeRequest(params);
|
||||
return http.post(this.url + url, body, params);
|
||||
}
|
||||
|
||||
delete(url, params) {
|
||||
params = params || {};
|
||||
this.beforeRequest(params);
|
||||
this.onBeforeRequest(params);
|
||||
return http.del(this.url + url, null, params);
|
||||
}
|
||||
|
||||
batch(requests) {
|
||||
for (let n = 0; n < requests.length; n++) {
|
||||
let params = requests[n].params || {};
|
||||
params.headers = params.headers || {};
|
||||
params.headers['Content-Type'] = 'application/json';
|
||||
this.beforeRequest(params);
|
||||
this.onBeforeRequest(params);
|
||||
requests[n].params = params;
|
||||
requests[n].url = this.url + requests[n].url;
|
||||
if (requests[n].body) {
|
||||
requests[n].body = JSON.stringify(requests[n].body);
|
||||
}
|
||||
}
|
||||
|
||||
return http.batch(requests);
|
||||
}
|
||||
}
|
||||
|
||||
export class BasicAuthClient extends BaseClient {
|
||||
constructor(url, subUrl, username, password) {
|
||||
super(url, subUrl);
|
||||
this.username = username;
|
||||
this.password = password;
|
||||
}
|
||||
|
||||
withUrl(subUrl) {
|
||||
let c = new BasicAuthClient(this.url, subUrl, this.username, this.password);
|
||||
c.onBeforeRequest = this.onBeforeRequest;
|
||||
return c;
|
||||
}
|
||||
|
||||
beforeRequest(params) {
|
||||
params = params || {};
|
||||
params.headers = params.headers || {};
|
||||
let token = `${this.username}:${this.password}`;
|
||||
params.headers['Authorization'] = `Basic ${encoding.b64encode(token)}`;
|
||||
}
|
||||
}
|
||||
|
||||
export const createClient = (url) => {
|
||||
return new GrafanaClient(new BaseClient(url, ''));
|
||||
}
|
||||
|
||||
export const createBasicAuthClient = (url, username, password) => {
|
||||
return new GrafanaClient(new BasicAuthClient(url, '', username, password));
|
||||
}
|
||||
@@ -1,35 +0,0 @@
|
||||
export const createTestOrgIfNotExists = (client) => {
|
||||
let orgId = 0;
|
||||
let res = client.orgs.getByName('k6');
|
||||
if (res.status === 404) {
|
||||
res = client.orgs.create('k6');
|
||||
if (res.status !== 200) {
|
||||
throw new Error('Expected 200 response status when creating org');
|
||||
}
|
||||
orgId = res.json().orgId;
|
||||
} else {
|
||||
orgId = res.json().id;
|
||||
}
|
||||
|
||||
client.withOrgId(orgId);
|
||||
return orgId;
|
||||
}
|
||||
|
||||
export const createTestdataDatasourceIfNotExists = (client) => {
|
||||
const payload = {
|
||||
access: 'proxy',
|
||||
isDefault: false,
|
||||
name: 'k6-testdata',
|
||||
type: 'testdata',
|
||||
};
|
||||
|
||||
let res = client.datasources.getByName(payload.name);
|
||||
if (res.status === 404) {
|
||||
res = client.datasources.create(payload);
|
||||
if (res.status !== 200) {
|
||||
throw new Error('Expected 200 response status when creating datasource');
|
||||
}
|
||||
}
|
||||
|
||||
return res.json().id;
|
||||
}
|
||||
@@ -1,28 +0,0 @@
|
||||
#/bin/bash
|
||||
|
||||
PWD=$(pwd)
|
||||
|
||||
run() {
|
||||
duration='15m'
|
||||
url='http://localhost:3000'
|
||||
vus='2'
|
||||
|
||||
while getopts ":d:u:v:" o; do
|
||||
case "${o}" in
|
||||
d)
|
||||
duration=${OPTARG}
|
||||
;;
|
||||
u)
|
||||
url=${OPTARG}
|
||||
;;
|
||||
v)
|
||||
vus=${OPTARG}
|
||||
;;
|
||||
esac
|
||||
done
|
||||
shift $((OPTIND-1))
|
||||
|
||||
docker run -t --network=host -v $PWD:/src -e URL=$url --rm -i loadimpact/k6:master run --vus $vus --duration $duration src/auth_token_test.js
|
||||
}
|
||||
|
||||
run "$@"
|
||||
@@ -209,7 +209,7 @@ providers:
|
||||
path: /var/lib/grafana/dashboards
|
||||
```
|
||||
|
||||
When Grafana starts, it will update/insert all dashboards available in the configured path. Then later on poll that path every **updateIntervalSeconds** and look for updated json files and update/insert those into the database.
|
||||
When Grafana starts, it will update/insert all dashboards available in the configured path. Then later on poll that path and look for updated json files and insert those update/insert those into the database.
|
||||
|
||||
#### Making changes to a provisioned dashboard
|
||||
|
||||
@@ -230,188 +230,4 @@ By default Grafana will delete dashboards in the database if the file is removed
|
||||
> **Note.** Provisioning allows you to overwrite existing dashboards
|
||||
> which leads to problems if you re-use settings that are supposed to be unique.
|
||||
> Be careful not to re-use the same `title` multiple times within a folder
|
||||
> or `uid` within the same installation as this will cause weird behaviors.
|
||||
|
||||
## Alert Notification Channels
|
||||
|
||||
Alert Notification Channels can be provisioned by adding one or more yaml config files in the [`provisioning/notifiers`](/installation/configuration/#provisioning) directory.
|
||||
|
||||
Each config file can contain the following top-level fields:
|
||||
- `notifiers`, a list of alert notifications that will be added or updated during start up. If the notification channel already exists, Grafana will update it to match the configuration file.
|
||||
- `delete_notifiers`, a list of alert notifications to be deleted before before inserting/updating those in the `notifiers` list.
|
||||
|
||||
Provisioning looks up alert notifications by uid, and will update any existing notification with the provided uid.
|
||||
|
||||
By default, exporting a dashboard as JSON will use a sequential identifier to refer to alert notifications. The field `uid` can be optionally specified to specify a string identifier for the alert name.
|
||||
|
||||
```json
|
||||
{
|
||||
...
|
||||
"alert": {
|
||||
...,
|
||||
"conditions": [...],
|
||||
"frequency": "24h",
|
||||
"noDataState": "ok",
|
||||
"notifications": [
|
||||
{"uid": "notifier1"},
|
||||
{"uid": "notifier2"},
|
||||
]
|
||||
}
|
||||
...
|
||||
}
|
||||
```
|
||||
|
||||
### Example Alert Notification Channels Config File
|
||||
|
||||
```yaml
|
||||
notifiers:
|
||||
- name: notification-channel-1
|
||||
type: slack
|
||||
uid: notifier1
|
||||
# either
|
||||
org_id: 2
|
||||
# or
|
||||
org_name: Main Org.
|
||||
is_default: true
|
||||
# See `Supported Settings` section for settings supporter for each
|
||||
# alert notification type.
|
||||
settings:
|
||||
recipient: "XXX"
|
||||
token: "xoxb"
|
||||
uploadImage: true
|
||||
url: https://slack.com
|
||||
|
||||
delete_notifiers:
|
||||
- name: notification-channel-1
|
||||
uid: notifier1
|
||||
# either
|
||||
org_id: 2
|
||||
# or
|
||||
org_name: Main Org.
|
||||
- name: notification-channel-2
|
||||
# default org_id: 1
|
||||
```
|
||||
|
||||
### Supported Settings
|
||||
|
||||
The following sections detail the supported settings for each alert notification type.
|
||||
|
||||
#### Alert notification `pushover`
|
||||
|
||||
| Name |
|
||||
| ---- |
|
||||
| apiToken |
|
||||
| userKey |
|
||||
| device |
|
||||
| retry |
|
||||
| expire |
|
||||
|
||||
#### Alert notification `slack`
|
||||
|
||||
| Name |
|
||||
| ---- |
|
||||
| url |
|
||||
| recipient |
|
||||
| username |
|
||||
| iconEmoji |
|
||||
| iconUrl |
|
||||
| uploadImage |
|
||||
| mention |
|
||||
| token |
|
||||
|
||||
#### Alert notification `victorops`
|
||||
|
||||
| Name |
|
||||
| ---- |
|
||||
| url |
|
||||
|
||||
#### Alert notification `kafka`
|
||||
|
||||
| Name |
|
||||
| ---- |
|
||||
| kafkaRestProxy |
|
||||
| kafkaTopic |
|
||||
|
||||
#### Alert notification `LINE`
|
||||
|
||||
| Name |
|
||||
| ---- |
|
||||
| token |
|
||||
|
||||
#### Alert notification `pagerduty`
|
||||
|
||||
| Name |
|
||||
| ---- |
|
||||
| integrationKey |
|
||||
|
||||
#### Alert notification `sensu`
|
||||
|
||||
| Name |
|
||||
| ---- |
|
||||
| url |
|
||||
| source |
|
||||
| handler |
|
||||
| username |
|
||||
| password |
|
||||
|
||||
#### Alert notification `prometheus-alertmanager`
|
||||
|
||||
| Name |
|
||||
| ---- |
|
||||
| url |
|
||||
|
||||
#### Alert notification `teams`
|
||||
|
||||
| Name |
|
||||
| ---- |
|
||||
| url |
|
||||
|
||||
#### Alert notification `dingding`
|
||||
|
||||
| Name |
|
||||
| ---- |
|
||||
| url |
|
||||
|
||||
#### Alert notification `email`
|
||||
|
||||
| Name |
|
||||
| ---- |
|
||||
| addresses |
|
||||
|
||||
#### Alert notification `hipchat`
|
||||
|
||||
| Name |
|
||||
| ---- |
|
||||
| url |
|
||||
| apikey |
|
||||
| roomid |
|
||||
|
||||
#### Alert notification `opsgenie`
|
||||
|
||||
| Name |
|
||||
| ---- |
|
||||
| apiKey |
|
||||
| apiUrl |
|
||||
|
||||
#### Alert notification `telegram`
|
||||
|
||||
| Name |
|
||||
| ---- |
|
||||
| bottoken |
|
||||
| chatid |
|
||||
|
||||
#### Alert notification `threema`
|
||||
|
||||
| Name |
|
||||
| ---- |
|
||||
| gateway_id |
|
||||
| recipient_id |
|
||||
| api_secret |
|
||||
|
||||
#### Alert notification `webhook`
|
||||
|
||||
| Name |
|
||||
| ---- |
|
||||
| url |
|
||||
| username |
|
||||
| password |
|
||||
> or `uid` within the same installation as this will cause weird behaviours.
|
||||
|
||||
@@ -55,10 +55,6 @@ Alert rule evaluation interval | Send reminders every | Reminder sent every (aft
|
||||
|
||||
<div class="clearfix"></div>
|
||||
|
||||
### Disable resolve message
|
||||
|
||||
When checked, this option will disable resolve message [OK] that is sent when alerting state returns to false.
|
||||
|
||||
## Supported Notification Types
|
||||
|
||||
Grafana ships with the following set of notification types:
|
||||
@@ -83,11 +79,7 @@ or a bot integration via Slack Apps. Follow Slack's guide to set up a bot integr
|
||||
|
||||
Setting | Description
|
||||
---------- | -----------
|
||||
Url | Slack incoming webhook url.
|
||||
Username | Set the username for the bot's message.
|
||||
Recipient | Allows you to override the Slack recipient.
|
||||
Icon emoji | Provide an emoji to use as the icon for the bot's message. Ex :smile:
|
||||
Icon URL | Provide a url to an image to use as the icon for the bot's message.
|
||||
Recipient | allows you to override the Slack recipient.
|
||||
Mention | make it possible to include a mention in the Slack notification sent by Grafana. Ex @here or @channel
|
||||
Token | If provided, Grafana will upload the generated image via Slack's file.upload API method, not the external image destination.
|
||||
|
||||
@@ -140,7 +132,7 @@ In DingTalk PC Client:
|
||||
|
||||
2. Click "Robot Manage" item in the pop menu, there will be a new panel call "Robot Manage".
|
||||
|
||||
3. In the "Robot Manage" panel, select "customized: customized robot with Webhook".
|
||||
3. In the "Robot Manage" panel, select "customised: customised robot with Webhook".
|
||||
|
||||
4. In the next new panel named "robot detail", click "Add" button.
|
||||
|
||||
@@ -161,29 +153,27 @@ There are a couple of configuration options which need to be set up in Grafana U
|
||||
|
||||
Once these two properties are set, you can send the alerts to Kafka for further processing or throttling.
|
||||
|
||||
### Google Hangouts Chat
|
||||
### All supported notifiers
|
||||
|
||||
Notifications can be sent by setting up an incoming webhook in Google Hangouts chat. Configuring such a webhook is described [here](https://developers.google.com/hangouts/chat/how-tos/webhooks).
|
||||
Name | Type |Support images | Support reminders
|
||||
-----|------------ | ------ | ------ |
|
||||
Slack | `slack` | yes | yes
|
||||
Pagerduty | `pagerduty` | yes | yes
|
||||
Email | `email` | yes | yes
|
||||
Webhook | `webhook` | link | yes
|
||||
Kafka | `kafka` | no | yes
|
||||
Hipchat | `hipchat` | yes | yes
|
||||
VictorOps | `victorops` | yes | yes
|
||||
Sensu | `sensu` | yes | yes
|
||||
OpsGenie | `opsgenie` | yes | yes
|
||||
Threema | `threema` | yes | yes
|
||||
Pushover | `pushover` | no | yes
|
||||
Telegram | `telegram` | no | yes
|
||||
Line | `line` | no | yes
|
||||
Microsoft Teams | `teams` | yes | yes
|
||||
Prometheus Alertmanager | `prometheus-alertmanager` | no | no
|
||||
|
||||
### All supported notifier
|
||||
|
||||
Name | Type |Support images
|
||||
-----|------------ | ------
|
||||
Slack | `slack` | yes
|
||||
Pagerduty | `pagerduty` | yes
|
||||
Email | `email` | yes
|
||||
Webhook | `webhook` | link
|
||||
Kafka | `kafka` | no
|
||||
Google Hangouts Chat | `googlechat` | yes
|
||||
Hipchat | `hipchat` | yes
|
||||
VictorOps | `victorops` | yes
|
||||
Sensu | `sensu` | yes
|
||||
OpsGenie | `opsgenie` | yes
|
||||
Threema | `threema` | yes
|
||||
Pushover | `pushover` | no
|
||||
Telegram | `telegram` | no
|
||||
Line | `line` | no
|
||||
Prometheus Alertmanager | `prometheus-alertmanager` | no
|
||||
|
||||
# Enable images in notifications {#external-image-store}
|
||||
|
||||
|
||||
@@ -27,10 +27,9 @@ and the conditions that need to be met for the alert to change state and trigger
|
||||
## Execution
|
||||
|
||||
The alert rules are evaluated in the Grafana backend in a scheduler and query execution engine that is part
|
||||
of core Grafana. Only some data sources are supported right now. They include `Graphite`, `Prometheus`, `InfluxDB`, `Elasticsearch`,
|
||||
`Stackdriver`, `Cloudwatch`, `Azure Monitor`, `MySQL`, `PostgreSQL`, `MSSQL` and `OpenTSDB`.
|
||||
of core Grafana. Only some data sources are supported right now. They include `Graphite`, `Prometheus`, `Elasticsearch`, `InfluxDB`, `OpenTSDB`, `MySQL`, `Postgres` and `Cloudwatch`.
|
||||
|
||||
> Alerting support for Azure Monitor is only available in Grafana v6.0 and above.
|
||||
> Alerting support for Elasticsearch is only available in Grafana v5.2 and above.
|
||||
|
||||
### Clustering
|
||||
|
||||
@@ -53,12 +52,9 @@ Here you can specify the name of the alert rule and how often the scheduler shou
|
||||
|
||||
> This setting is available in Grafana 5.4 and above.
|
||||
|
||||
If an alert rule has a configured `For` and the query violates the configured threshold it will first go from `OK` to `Pending`. Going from `OK` to `Pending` Grafana will not send any notifications. Once the alert rule has been firing for more than `For` duration, it will change to `Alerting` and send alert notifications.
|
||||
|
||||
Typically, it's always a good idea to use this setting since it's often worse to get false positive than wait a few minutes before the alert notification triggers. Looking at the `Alert list` or `Alert list panels` you will be able to see alerts in pending state.
|
||||
|
||||
Below you can see an example timeline of an alert using the `For` setting. At ~16:04 the alert state changes to `Pending` and after 4 minutes it changes to `Alerting` which is when alert notifications are sent. Once the series falls back to normal the alert rule goes back to `OK`.
|
||||
{{< imgbox img="/img/docs/v54/alerting-for-dark-theme.png" caption="Alerting For" >}}
|
||||
Typically, it's always a good idea to use this setting since its often worse to get false positive than wait a few minutes before the alert notification triggers.
|
||||
|
||||
{{< imgbox max-width="40%" img="/img/docs/v4/alerting_conditions.png" caption="Alerting Conditions" >}}
|
||||
|
||||
@@ -75,7 +71,7 @@ avg() OF query(A, 15m, now) IS BELOW 14
|
||||
```
|
||||
|
||||
- `avg()` Controls how the values for **each** series should be reduced to a value that can be compared against the threshold. Click on the function to change it to another aggregation function.
|
||||
- `query(A, 15m, now)` The letter defines what query to execute from the **Metrics** tab. The second two parameters define the time range, `15m, now` means 15 minutes ago to now. You can also do `10m, now-2m` to define a time range that will be 10 minutes ago to 2 minutes ago. This is useful if you want to ignore the last 2 minutes of data.
|
||||
- `query(A, 15m, now)` The letter defines what query to execute from the **Metrics** tab. The second two parameters define the time range, `15m, now` means 5 minutes ago to now. You can also do `10m, now-2m` to define a time range that will be 10 minutes ago to 2 minutes ago. This is useful if you want to ignore the last 2 minutes of data.
|
||||
- `IS BELOW 14` Defines the type of threshold and the threshold value. You can click on `IS BELOW` to change the type of threshold.
|
||||
|
||||
The query used in an alert rule cannot contain any template variables. Currently we only support `AND` and `OR` operators between conditions and they are executed serially.
|
||||
|
||||
@@ -31,10 +31,9 @@ auto_sign_up = true
|
||||
ldap_sync_ttl = 60
|
||||
# Limit where auth proxy requests come from by configuring a list of IP addresses.
|
||||
# This can be used to prevent users spoofing the X-WEBAUTH-USER header.
|
||||
# Example `whitelist = 192.168.1.1, 192.168.1.0/24, 2001::23, 2001::0/120`
|
||||
whitelist =
|
||||
# Optionally define more headers to sync other user attributes
|
||||
# Example `headers = Name:X-WEBAUTH-NAME Email:X-WEBAUTH-EMAIL`
|
||||
# Example `headers = Name:X-WEBAUTH-NAME Email:X-WEBAUTH-EMAIL``
|
||||
headers =
|
||||
```
|
||||
|
||||
|
||||
@@ -17,7 +17,7 @@ can find examples using Okta, BitBucket, OneLogin and Azure.
|
||||
|
||||
This callback URL must match the full HTTP address that you use in your browser to access Grafana, but with the prefix path of `/login/generic_oauth`.
|
||||
|
||||
You may have to set the `root_url` option of `[server]` for the callback URL to be
|
||||
You may have to set the `root_url` option of `[server]` for the callback URL to be
|
||||
correct. For example in case you are serving Grafana behind a proxy.
|
||||
|
||||
Example config:
|
||||
@@ -113,7 +113,7 @@ allowed_organizations =
|
||||
allowed_organizations =
|
||||
```
|
||||
|
||||
## Set up OAuth2 with Auth0
|
||||
### Set up OAuth2 with Auth0
|
||||
|
||||
1. Create a new Client in Auth0
|
||||
- Name: Grafana
|
||||
@@ -139,7 +139,7 @@ allowed_organizations =
|
||||
api_url = https://<domain>/userinfo
|
||||
```
|
||||
|
||||
## Set up OAuth2 with Azure Active Directory
|
||||
### Set up OAuth2 with Azure Active Directory
|
||||
|
||||
1. Log in to portal.azure.com and click "Azure Active Directory" in the side menu, then click the "Properties" sub-menu item.
|
||||
|
||||
@@ -209,19 +209,6 @@ allowed_organizations =
|
||||
token_url = https://<your domain>.my.centrify.com/OAuth2/Token/<Application ID>
|
||||
```
|
||||
|
||||
## Set up OAuth2 with non-compliant providers
|
||||
|
||||
> Only available in Grafana v6.0 and above.
|
||||
|
||||
Some OAuth2 providers might not support `client_id` and `client_secret` passed via Basic Authentication HTTP header, which
|
||||
results in `invalid_client` error. To allow Grafana to authenticate via these type of providers, the client identifiers must be
|
||||
send via POST body, which can be enabled via the following settings:
|
||||
|
||||
```bash
|
||||
[auth.generic_oauth]
|
||||
send_client_credentials_via_post = true
|
||||
```
|
||||
|
||||
<hr>
|
||||
|
||||
|
||||
|
||||
@@ -1,5 +1,5 @@
|
||||
+++
|
||||
title = "GitHub OAuth2 Authentication"
|
||||
title = "Google OAuth2 Authentication"
|
||||
description = "Grafana OAuthentication Guide "
|
||||
keywords = ["grafana", "configuration", "documentation", "oauth"]
|
||||
type = "docs"
|
||||
|
||||
@@ -1,5 +1,5 @@
|
||||
+++
|
||||
title = "GitLab OAuth2 Authentication"
|
||||
title = "Google OAuth2 Authentication"
|
||||
description = "Grafana OAuthentication Guide "
|
||||
keywords = ["grafana", "configuration", "documentation", "oauth"]
|
||||
type = "docs"
|
||||
@@ -47,7 +47,7 @@ authentication:
|
||||
|
||||
```bash
|
||||
[auth.gitlab]
|
||||
enabled = true
|
||||
enabled = false
|
||||
allow_sign_up = false
|
||||
client_id = GITLAB_APPLICATION_ID
|
||||
client_secret = GITLAB_SECRET
|
||||
|
||||
@@ -3,7 +3,6 @@ title = "LDAP Authentication"
|
||||
description = "Grafana LDAP Authentication Guide "
|
||||
keywords = ["grafana", "configuration", "documentation", "ldap", "active directory"]
|
||||
type = "docs"
|
||||
aliases = ["/installation/ldap/"]
|
||||
[menu.docs]
|
||||
name = "LDAP"
|
||||
identifier = "ldap"
|
||||
@@ -163,9 +162,9 @@ org_role = "Viewer"
|
||||
Setting | Required | Description | Default
|
||||
------------ | ------------ | ------------- | -------------
|
||||
`group_dn` | Yes | LDAP distinguished name (DN) of LDAP group. If you want to match all (or no LDAP groups) then you can use wildcard (`"*"`) |
|
||||
`org_role` | Yes | Assign users of `group_dn` the organization role `"Admin"`, `"Editor"` or `"Viewer"` |
|
||||
`org_role` | Yes | Assign users of `group_dn` the organisation role `"Admin"`, `"Editor"` or `"Viewer"` |
|
||||
`org_id` | No | The Grafana organization database id. Setting this allows for multiple group_dn's to be assigned to the same `org_role` provided the `org_id` differs | `1` (default org id)
|
||||
`grafana_admin` | No | When `true` makes user of `group_dn` Grafana server admin. A Grafana server admin has admin access over all organizations and users. Available in Grafana v5.3 and above | `false`
|
||||
`grafana_admin` | No | When `true` makes user of `group_dn` Grafana server admin. A Grafana server admin has admin access over all organisations and users. Available in Grafana v5.3 and above | `false`
|
||||
|
||||
### Nested/recursive group membership
|
||||
|
||||
|
||||
@@ -36,35 +36,6 @@ Grafana of course has a built in user authentication system with password authen
|
||||
disable authentication by enabling anonymous access. You can also hide login form and only allow login through an auth
|
||||
provider (listed above). There is also options for allowing self sign up.
|
||||
|
||||
### Login and short-lived tokens
|
||||
|
||||
> The following applies when using Grafana's built in user authentication, LDAP (without Auth proxy) or OAuth integration.
|
||||
|
||||
Grafana are using short-lived tokens as a mechanism for verifying authenticated users.
|
||||
These short-lived tokens are rotated each `token_rotation_interval_minutes` for an active authenticated user.
|
||||
|
||||
An active authenticated user that gets it token rotated will extend the `login_maximum_inactive_lifetime_days` time from "now" that Grafana will remember the user.
|
||||
This means that a user can close its browser and come back before `now + login_maximum_inactive_lifetime_days` and still being authenticated.
|
||||
This is true as long as the time since user login is less than `login_maximum_lifetime_days`.
|
||||
|
||||
Example:
|
||||
|
||||
```bash
|
||||
[auth]
|
||||
|
||||
# Login cookie name
|
||||
login_cookie_name = grafana_session
|
||||
|
||||
# The lifetime (days) an authenticated user can be inactive before being required to login at next visit. Default is 7 days.
|
||||
login_maximum_inactive_lifetime_days = 7
|
||||
|
||||
# The maximum lifetime (days) an authenticated user can be logged in since login time before being required to login. Default is 30 days.
|
||||
login_maximum_lifetime_days = 30
|
||||
|
||||
# How often should auth tokens be rotated for authenticated users when being active. The default is each 10 minutes.
|
||||
token_rotation_interval_minutes = 10
|
||||
```
|
||||
|
||||
### Anonymous authentication
|
||||
|
||||
You can make Grafana accessible without any login required by enabling anonymous access in the configuration file.
|
||||
@@ -107,8 +78,8 @@ disable_login_form = true
|
||||
|
||||
### Automatic OAuth login
|
||||
|
||||
Set to true to attempt login with OAuth automatically, skipping the login screen.
|
||||
This setting is ignored if multiple OAuth providers are configured.
|
||||
Set to true to attempt login with OAuth automatically, skipping the login screen.
|
||||
This setting is ignored if multiple OAuth providers are configured.
|
||||
Defaults to `false`.
|
||||
|
||||
```bash
|
||||
@@ -124,12 +95,3 @@ Set to the option detailed below to true to hide sign-out menu link. Useful if y
|
||||
[auth]
|
||||
disable_signout_menu = true
|
||||
```
|
||||
|
||||
### URL redirect after signing out
|
||||
|
||||
URL to redirect the user to after signing out from Grafana. This can for example be used to enable signout from oauth provider.
|
||||
|
||||
```bash
|
||||
[auth]
|
||||
signout_redirect_url =
|
||||
```
|
||||
|
||||
@@ -1,6 +1,6 @@
|
||||
+++
|
||||
title = "Contributor License Agreement (CLA)"
|
||||
description = "Contributor License Agreement (CLA)"
|
||||
title = "Contributor Licence Agreement (CLA)"
|
||||
description = "Contributor Licence Agreement (CLA)"
|
||||
type = "docs"
|
||||
aliases = ["/project/cla", "docs/contributing/cla.html"]
|
||||
[menu.docs]
|
||||
|
||||
@@ -31,15 +31,13 @@ Datasource permissions allow you to restrict query access to only specific Teams
|
||||
|
||||
### Premium Plugins
|
||||
|
||||
With a Grafana Enterprise license you will get access to premium plugins, including:
|
||||
With a Grafana Enterprise licence you will get access to premium plugins, including:
|
||||
|
||||
* [Splunk](https://grafana.com/plugins/grafana-splunk-datasource)
|
||||
* [AppDynamics](https://grafana.com/plugins/dlopes7-appdynamics-datasource)
|
||||
* [DataDog](https://grafana.com/plugins/grafana-datadog-datasource)
|
||||
* [Dynatrace](https://grafana.com/plugins/grafana-dynatrace-datasource)
|
||||
* [New Relic](https://grafana.com/plugins/grafana-newrelic-datasource)
|
||||
* [Amazon Timestream](https://grafana.com/plugins/grafana-timestream-datasource)
|
||||
* [Oracle Database](https://grafana.com/plugins/grafana-oracle-datasource)
|
||||
|
||||
## Try Grafana Enterprise
|
||||
|
||||
|
||||
@@ -1,271 +0,0 @@
|
||||
+++
|
||||
title = "Using Azure Monitor in Grafana"
|
||||
description = "Guide for using Azure Monitor in Grafana"
|
||||
keywords = ["grafana", "microsoft", "azure", "monitor", "application", "insights", "log", "analytics", "guide"]
|
||||
type = "docs"
|
||||
aliases = ["/datasources/azuremonitor"]
|
||||
[menu.docs]
|
||||
name = "Azure Monitor"
|
||||
parent = "datasources"
|
||||
weight = 5
|
||||
+++
|
||||
|
||||
# Using Azure Monitor in Grafana
|
||||
|
||||
> Officially released in Grafana v6.0.0
|
||||
|
||||
As of Grafana 6.0, the Azure Monitor plugin has been moved into Grafana so it now ships with built-in support for Azure Monitor.
|
||||
|
||||
The Azure Monitor Datasource supports multiple services in the Azure cloud:
|
||||
|
||||
- **[Azure Monitor]({{< relref "#querying-the-azure-monitor-service" >}})** is the platform service that provides a single source for monitoring Azure resources.
|
||||
- **[Application Insights]({{< relref "#querying-the-application-insights-service" >}})** is an extensible Application Performance Management (APM) service for web developers on multiple platforms and can be used to monitor your live web application - it will automatically detect performance anomalies.
|
||||
- **[Azure Log Analytics]({{< relref "#querying-the-azure-log-analytics-service" >}})** (or Azure Logs) gives you access to log data collected by Azure Monitor.
|
||||
- **[Application Insights Analytics]({{< relref "#writing-analytics-queries-for-the-application-insights-service" >}})** allows you to query [Application Insights data](https://docs.microsoft.com/en-us/azure/azure-monitor/app/analytics) using the same query language used for Azure Log Analytics.
|
||||
|
||||
## Adding the data source to Grafana
|
||||
|
||||
The datasource can access metrics from four different services. You can configure access to the services that you use. It is also possible to use the same credentials for multiple services if that is how you have set it up in Azure AD.
|
||||
|
||||
- [Guide to setting up an Azure Active Directory Application for Azure Monitor.](https://docs.microsoft.com/en-us/azure/azure-resource-manager/resource-group-create-service-principal-portal)
|
||||
- [Guide to setting up an Azure Active Directory Application for Azure Log Analytics.](https://dev.loganalytics.io/documentation/Authorization/AAD-Setup)
|
||||
- [Quickstart Guide for Application Insights.](https://dev.applicationinsights.io/quickstart/)
|
||||
|
||||
1. Accessed from the Grafana main menu, newly installed data sources can be added immediately within the Data Sources section. Next, click the "Add data source" button in the upper right. The data source will be available for selection in the Type select box.
|
||||
|
||||
2. Select Azure Monitor from the Type dropdown:<br/>
|
||||
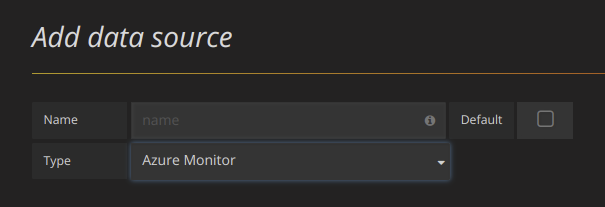
|
||||
3. In the name field, fill in a name for the data source. It can be anything. Some suggestions are Azure Monitor or App Insights.
|
||||
|
||||
4. If you are using Azure Monitor, then you need 4 pieces of information from the Azure portal (see link above for detailed instructions):
|
||||
- **Tenant Id** (Azure Active Directory -> Properties -> Directory ID)
|
||||
- **Subscription Id** (Subscriptions -> Choose subscription -> Overview -> Subscription ID)
|
||||
- **Client Id** (Azure Active Directory -> App Registrations -> Choose your app -> Application ID)
|
||||
- **Client Secret** ( Azure Active Directory -> App Registrations -> Choose your app -> Keys)
|
||||
|
||||
5. Paste these four items into the fields in the Azure Monitor API Details section:<br/>
|
||||
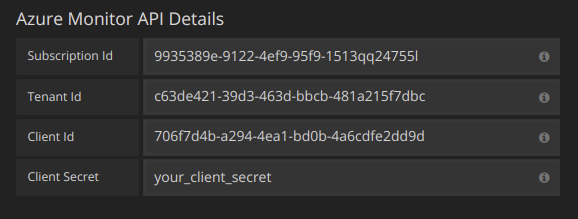
|
||||
|
||||
6. If you are also using the Azure Log Analytics service, then you need to specify these two config values (or you can reuse the Client Id and Secret from the previous step).
|
||||
- Client Id (Azure Active Directory -> App Registrations -> Choose your app -> Application ID)
|
||||
- Client Secret ( Azure Active Directory -> App Registrations -> Choose your app -> Keys -> Create a key -> Use client secret)
|
||||
|
||||
7. If you are are using Application Insights, then you need two pieces of information from the Azure Portal (see link above for detailed instructions):
|
||||
- Application ID
|
||||
- API Key
|
||||
|
||||
8. Paste these two items into the appropriate fields in the Application Insights API Details section:<br/>
|
||||
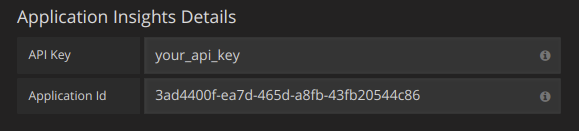
|
||||
|
||||
9. Test that the configuration details are correct by clicking on the "Save & Test" button:<br/>
|
||||

|
||||
|
||||
Alternatively on step 4 if creating a new Azure Active Directory App, use the [Azure CLI](https://docs.microsoft.com/en-us/cli/azure/?view=azure-cli-latest):
|
||||
|
||||
```bash
|
||||
az ad sp create-for-rbac -n "http://localhost:3000"
|
||||
```
|
||||
|
||||
## Choose a Service
|
||||
|
||||
In the query editor for a panel, after choosing your Azure Monitor datasource, the first option is to choose a service. There are three options here: Azure Monitor, Application Insights and Azure Log Analytics. The query editor will change depending on which one you pick. Azure Monitor is the default.
|
||||
|
||||
## Querying the Azure Monitor Service
|
||||
|
||||
The Azure Monitor service provides metrics for all the Azure services that you have running. It helps you understand how your applications on Azure are performing and to proactively find issues affecting your applications.
|
||||
|
||||
Examples of metrics that you can get from the service are:
|
||||
|
||||
- Microsoft.Compute/virtualMachines - Percentage CPU
|
||||
- Microsoft.Network/networkInterfaces - Bytes sent
|
||||
- Microsoft.Storage/storageAccounts - Used Capacity
|
||||
|
||||
{{< docs-imagebox img="/img/docs/v60/azuremonitor-service-query-editor.png" class="docs-image--no-shadow" caption="Azure Monitor Query Editor" >}}
|
||||
|
||||
### Formatting Legend Keys with Aliases for the Azure Monitor Service
|
||||
|
||||
The default legend formatting for the Azure Monitor API is:
|
||||
|
||||
`resourceName{dimensionValue=dimensionName}.metricName`
|
||||
|
||||
These can be quite long but this formatting can be changed using aliases. In the Legend Format field, the aliases which are defined below can be combined any way you want.
|
||||
|
||||
Azure Monitor Examples:
|
||||
|
||||
- `dimension: {{dimensionvalue}}`
|
||||
- `{{resourcegroup}} - {{resourcename}}`
|
||||
|
||||
### Alias Patterns for Azure Monitor
|
||||
|
||||
- `{{resourcegroup}}` = replaced with the value of the Resource Group
|
||||
- `{{namespace}}` = replaced with the value of the Namespace (e.g. Microsoft.Compute/virtualMachines)
|
||||
- `{{resourcename}}` = replaced with the value of the Resource Name
|
||||
- `{{metric}}` = replaced with metric name (e.g. Percentage CPU)
|
||||
- `{{dimensionname}}` = replaced with dimension key/label (e.g. blobtype)
|
||||
- `{{dimensionvalue}}` = replaced with dimension value (e.g. BlockBlob)
|
||||
|
||||
### Templating with Variables for the Azure Monitor Service
|
||||
|
||||
Instead of hard-coding things like server, application and sensor name in you metric queries you can use variables in their place. Variables are shown as dropdown select boxes at the top of the dashboard. These dropdowns makes it easy to change the data being displayed in your dashboard.
|
||||
|
||||
Note that the Azure Monitor service does not support multiple values yet. If you want to visualize multiple time series (for example, metrics for server1 and server2) then you have to add multiple queries to able to view them on the same graph or in the same table.
|
||||
|
||||
The Azure Monitor Datasource Plugin provides the following queries you can specify in the `Query` field in the Variable edit view. They allow you to fill a variable's options list.
|
||||
|
||||
| Name | Description |
|
||||
| -------------------------------------------------------- | -------------------------------------------------------------- |
|
||||
| *ResourceGroups()* | Returns a list of resource groups. |
|
||||
| *Namespaces(aResourceGroup)* | Returns a list of namespaces for the specified resource group. |
|
||||
| *ResourceNames(aResourceGroup, aNamespace)* | Returns a list of resource names. |
|
||||
| *MetricNames(aResourceGroup, aNamespace, aResourceName)* | Returns a list of metric names. |
|
||||
|
||||
Examples:
|
||||
|
||||
- Resource Groups query: `ResourceGroups()`
|
||||
- Passing in metric name variable: `Namespaces(cosmo)`
|
||||
- Chaining template variables: `ResourceNames($rg, $ns)`
|
||||
- Do not quote parameters: `MetricNames(hg, Microsoft.Network/publicIPAddresses, grafanaIP)`
|
||||
|
||||
{{< docs-imagebox img="/img/docs/v60/azuremonitor-service-variables.png" class="docs-image--no-shadow" caption="Nested Azure Monitor Template Variables" >}}
|
||||
|
||||
Checkout the [Templating]({{< relref "reference/templating.md" >}}) documentation for an introduction to the templating feature and the different
|
||||
types of template variables.
|
||||
|
||||
### Azure Monitor Metrics Whitelist
|
||||
|
||||
Not all metrics returned by the Azure Monitor API have values. The Grafana datasource has a whitelist to only return metric names if it is possible they might have values. This whitelist is updated regularly as new services and metrics are added to the Azure cloud. You can find the current whitelist [here](https://github.com/grafana/grafana/blob/master/public/app/plugins/datasource/grafana-azure-monitor-datasource/azure_monitor/supported_namespaces.ts).
|
||||
|
||||
### Azure Monitor Alerting
|
||||
|
||||
Grafana alerting is supported for the Azure Monitor service. This is not Azure Alerts support. Read more about how alerting in Grafana works [here]({{< relref "alerting/rules.md" >}}).
|
||||
|
||||
{{< docs-imagebox img="/img/docs/v60/azuremonitor-alerting.png" class="docs-image--no-shadow" caption="Azure Monitor Alerting" >}}
|
||||
|
||||
## Querying the Application Insights Service
|
||||
|
||||
{{< docs-imagebox img="/img/docs/v60/appinsights-service-query-editor.png" class="docs-image--no-shadow" caption="Application Insights Query Editor" >}}
|
||||
|
||||
### Formatting Legend Keys with Aliases for the Application Insights Service
|
||||
|
||||
The default legend formatting is:
|
||||
|
||||
`metric/name{group/by="groupbyvalue"}`
|
||||
|
||||
In the Legend Format field, the aliases which are defined below can be combined any way you want.
|
||||
|
||||
Application Insights Examples:
|
||||
|
||||
- `server: {{groupbyvalue}}`
|
||||
- `city: {{groupbyvalue}}`
|
||||
- `{{groupbyname}}: {{groupbyvalue}}`
|
||||
|
||||
### Alias Patterns for Application Insights
|
||||
|
||||
- `{{groupbyvalue}}` = replaced with the value of the group by
|
||||
- `{{groupbyname}}` = replaced with the name/label of the group by
|
||||
- `{{metric}}` = replaced with metric name (e.g. requests/count)
|
||||
|
||||
### Filter Expressions for Application Insights
|
||||
|
||||
The filter field takes an OData filter expression.
|
||||
|
||||
Examples:
|
||||
|
||||
- `client/city eq 'Boydton'`
|
||||
- `client/city ne 'Boydton'`
|
||||
- `client/city ne 'Boydton' and client/city ne 'Dublin'`
|
||||
- `client/city eq 'Boydton' or client/city eq 'Dublin'`
|
||||
|
||||
### Templating with Variables for Application Insights
|
||||
|
||||
Use the one of the following queries in the `Query` field in the Variable edit view.
|
||||
|
||||
Checkout the [Templating]({{< relref "reference/templating.md" >}}) documentation for an introduction to the templating feature and the different
|
||||
types of template variables.
|
||||
|
||||
| Name | Description |
|
||||
| ---------------------------------- | ---------------------------------------------------------- |
|
||||
| *AppInsightsMetricNames()* | Returns a list of metric names. |
|
||||
| *AppInsightsGroupBys(aMetricName)* | Returns a list of group bys for the specified metric name. |
|
||||
|
||||
Examples:
|
||||
|
||||
- Metric Names query: `AppInsightsMetricNames()`
|
||||
- Passing in metric name variable: `AppInsightsGroupBys(requests/count)`
|
||||
- Chaining template variables: `AppInsightsGroupBys($metricnames)`
|
||||
|
||||
{{< docs-imagebox img="/img/docs/v60/appinsights-service-variables.png" class="docs-image--no-shadow" caption="Nested Application Insights Template Variables" >}}
|
||||
|
||||
### Application Insights Alerting
|
||||
|
||||
Not implemented yet.
|
||||
|
||||
## Querying the Azure Log Analytics Service
|
||||
|
||||
Queries are written in the new [Azure Log Analytics (or KustoDB) Query Language](https://docs.loganalytics.io/index). A Log Analytics Query can be formatted as Time Series data or as Table data.
|
||||
|
||||
Time Series queries are for the Graph Panel (and other panels like the Single Stat panel) and must contain a datetime column, a metric name column and a value column. Here is an example query that returns the aggregated count grouped by the Category column and grouped by hour:
|
||||
|
||||
```
|
||||
AzureActivity
|
||||
| where $__timeFilter(TimeGenerated)
|
||||
| summarize count() by Category, bin(TimeGenerated, 1h)
|
||||
| order by TimeGenerated asc
|
||||
```
|
||||
|
||||
Table queries are mainly used in the Table panel and row a list of columns and rows. This example query returns rows with the 6 specified columns:
|
||||
|
||||
```
|
||||
AzureActivity
|
||||
| where $__timeFilter()
|
||||
| project TimeGenerated, ResourceGroup, Category, OperationName, ActivityStatus, Caller
|
||||
| order by TimeGenerated desc
|
||||
```
|
||||
|
||||
{{< docs-imagebox img="/img/docs/v60/azureloganalytics-service-query-editor.png" class="docs-image--no-shadow" caption="Azure Log Analytics Query Editor" >}}
|
||||
|
||||
### Azure Log Analytics Macros
|
||||
|
||||
To make writing queries easier there are several Grafana macros that can be used in the where clause of a query:
|
||||
|
||||
- `$__timeFilter()` - Expands to
|
||||
`TimeGenerated ≥ datetime(2018-06-05T18:09:58.907Z) and`
|
||||
`TimeGenerated ≤ datetime(2018-06-05T20:09:58.907Z)` where the from and to datetimes are from the Grafana time picker.
|
||||
|
||||
- `$__timeFilter(datetimeColumn)` - Expands to
|
||||
`datetimeColumn ≥ datetime(2018-06-05T18:09:58.907Z) and`
|
||||
`datetimeColumn ≤ datetime(2018-06-05T20:09:58.907Z)` where the from and to datetimes are from the Grafana time picker.
|
||||
|
||||
- `$__escapeMulti($myVar)` - is to be used with multi-value template variables that contains illegal characters. If $myVar has the value `'\\grafana-vm\Network(eth0)\Total','\\hello!'`, it expands to: `@'\\grafana-vm\Network(eth0)\Total', @'\\hello!'`. If using single value variables there no need for this macro, simply escape the variable inline instead - `@'\$myVar'`
|
||||
|
||||
- `$__contains(colName, $myVar)` - is to be used with multi-value template variables. If $myVar has the value `'value1','value2'`, it expands to: `colName in ('value1','value2')`.
|
||||
|
||||
If using the `All` option, then check the `Include All Option` checkbox and in the `Custom all value` field type in the following value: `all`. If $myVar has value `all` then the macro will instead expand to `1 == 1`. For template variables with a lot of options, this will increase the query performance by not building a large where..in clause.
|
||||
|
||||
### Azure Log Analytics Builtin Variables
|
||||
|
||||
There are also some Grafana variables that can be used in Azure Log Analytics queries:
|
||||
|
||||
- `$__from` - Returns the From datetime from the Grafana picker. Example: `datetime(2018-06-05T18:09:58.907Z)`.
|
||||
- `$__to` - Returns the From datetime from the Grafana picker. Example: `datetime(2018-06-05T20:09:58.907Z)`.
|
||||
- `$__interval` - Grafana calculates the minimum time grain that can be used to group by time in queries. More details on how it works [here]({{< relref "reference/templating.md#interval-variables" >}}). It returns a time grain like `5m` or `1h` that can be used in the bin function. E.g. `summarize count() by bin(TimeGenerated, $__interval)`
|
||||
|
||||
### Azure Log Analytics Alerting
|
||||
|
||||
Not implemented yet.
|
||||
|
||||
### Writing Analytics Queries For the Application Insights Service
|
||||
|
||||
If you change the service type to "Application Insights", the menu icon to the right adds another option, "Toggle Edit Mode". Once clicked, the query edit mode changes to give you a full text area in which to write log analytics queries. (This is identical to how the InfluxDB datasource lets you write raw queries.)
|
||||
|
||||
Once a query is written, the column names are automatically parsed out of the response data. You can then select them in the "X-axis", "Y-axis", and "Split On" dropdown menus, or just type them out.
|
||||
|
||||
There are some important caveats to remember:
|
||||
|
||||
- You'll want to order your y-axis in the query, eg. `order by timestamp asc`. The graph may come out looking bizarre otherwise. It's better to have Microsoft sort it on their side where it's faster, than to implement this in the plugin.
|
||||
|
||||
- If you copy a log analytics query, typically they'll end with a render instruction, like `render barchart`. This is unnecessary, but harmless.
|
||||
|
||||
- Currently, four default dashboard variables are supported: `$__timeFilter()`, `$__from`, `$__to`, and `$__interval`. If you're searching in timestamped data, replace the beginning of your where clause to `where $__timeFilter()`. Dashboard changes by time region are handled as you'd expect, as long as you leave the name of the `timestamp` column alone. Likewise, `$__interval` will automatically change based on the dashboard's time region _and_ the width of the chart being displayed. Use it in bins, so `bin(timestamp,$__interval)` changes into something like `bin(timestamp,1s)`. Use `$__from` and `$__to` if you just want the formatted dates to be inserted.
|
||||
|
||||
- Templated dashboard variables are not yet supported! They will come in a future version.
|
||||
@@ -8,7 +8,7 @@ aliases = ["/datasources/cloudwatch"]
|
||||
name = "AWS Cloudwatch"
|
||||
identifier = "cloudwatch"
|
||||
parent = "datasources"
|
||||
weight = 5
|
||||
weight = 10
|
||||
+++
|
||||
|
||||
# Using AWS CloudWatch in Grafana
|
||||
@@ -38,7 +38,7 @@ Name | Description
|
||||
|
||||
### IAM Roles
|
||||
|
||||
Currently all access to CloudWatch is done server side by the Grafana backend using the official AWS SDK. If your Grafana
|
||||
Currently all access to CloudWatch is done server side by the Grafana backend using the official AWS SDK. If you grafana
|
||||
server is running on AWS you can use IAM Roles and authentication will be handled automatically.
|
||||
|
||||
Checkout AWS docs on [IAM Roles](http://docs.aws.amazon.com/AWSEC2/latest/UserGuide/iam-roles-for-amazon-ec2.html)
|
||||
@@ -74,12 +74,6 @@ Here is a minimal policy example:
|
||||
"ec2:DescribeRegions"
|
||||
],
|
||||
"Resource": "*"
|
||||
},
|
||||
{
|
||||
"Sid": "AllowReadingResourcesForTags",
|
||||
"Effect" : "Allow",
|
||||
"Action" : "tag:GetResources",
|
||||
"Resource" : "*"
|
||||
}
|
||||
]
|
||||
}
|
||||
@@ -105,14 +99,6 @@ region = us-west-2
|
||||
|
||||
You need to specify a namespace, metric, at least one stat, and at least one dimension.
|
||||
|
||||
## Metric Math
|
||||
|
||||
You can now create new time series metrics by operating on top of Cloudwatch metrics using mathematical functions. Arithmetic operators, unary subtraction and other functions are supported to be applied on cloudwatch metrics. More details on the available functions can be found on [AWS Metric Math](https://docs.aws.amazon.com/AmazonCloudWatch/latest/monitoring/using-metric-math.html)
|
||||
|
||||
As an example, if you want to apply arithmetic operator on a metric, you can do it by giving an alias(a unique string) to the raw metric as shown below. Then you can use this alias and apply arithmetic operator to it in the Expression field of created metric.
|
||||
|
||||

|
||||
|
||||
## Templated queries
|
||||
|
||||
Instead of hard-coding things like server, application and sensor name in you metric queries you can use variables in their place.
|
||||
@@ -142,7 +128,6 @@ Name | Description
|
||||
*dimension_values(region, namespace, metric, dimension_key, [filters])* | Returns a list of dimension values matching the specified `region`, `namespace`, `metric`, `dimension_key` or you can use dimension `filters` to get more specific result as well.
|
||||
*ebs_volume_ids(region, instance_id)* | Returns a list of volume ids matching the specified `region`, `instance_id`.
|
||||
*ec2_instance_attribute(region, attribute_name, filters)* | Returns a list of attributes matching the specified `region`, `attribute_name`, `filters`.
|
||||
*resource_arns(region, resource_type, tags)* | Returns a list of ARNs matching the specified `region`, `resource_type` and `tags`.
|
||||
|
||||
For details about the metrics CloudWatch provides, please refer to the [CloudWatch documentation](https://docs.aws.amazon.com/AmazonCloudWatch/latest/DeveloperGuide/CW_Support_For_AWS.html).
|
||||
|
||||
@@ -158,8 +143,6 @@ Query | Service
|
||||
*dimension_values(us-east-1,AWS/RDS,CPUUtilization,DBInstanceIdentifier)* | RDS
|
||||
*dimension_values(us-east-1,AWS/S3,BucketSizeBytes,BucketName)* | S3
|
||||
*dimension_values(us-east-1,CWAgent,disk_used_percent,device,{"InstanceId":"$instance_id"})* | CloudWatch Agent
|
||||
*resource_arns(eu-west-1,elasticloadbalancing:loadbalancer,{"elasticbeanstalk:environment-name":["myApp-dev","myApp-prod"]})* | ELB
|
||||
*resource_arns(eu-west-1,ec2:instance,{"elasticbeanstalk:environment-name":["myApp-dev","myApp-prod"]})* | EC2
|
||||
|
||||
## ec2_instance_attribute examples
|
||||
|
||||
@@ -222,16 +205,6 @@ Example `ec2_instance_attribute()` query
|
||||
ec2_instance_attribute(us-east-1, Tags.Name, { "tag:Team": [ "sysops" ] })
|
||||
```
|
||||
|
||||
## Using json format template variables
|
||||
|
||||
Some of query takes JSON format filter. Grafana support to interpolate template variable to JSON format string, it can use as filter string.
|
||||
|
||||
If `env = 'production', 'staging'`, following query will return ARNs of EC2 instances which `Environment` tag is `production` or `staging`.
|
||||
|
||||
```
|
||||
resource_arns(us-east-1, ec2:instance, {"Environment":${env:json}})
|
||||
```
|
||||
|
||||
## Cost
|
||||
|
||||
Amazon provides 1 million CloudWatch API requests each month at no additional charge. Past this,
|
||||
|
||||
@@ -13,6 +13,7 @@ weight = 5
|
||||
|
||||
Grafana supports many different storage backends for your time series data (Data Source). Each Data Source has a specific Query Editor that is customized for the features and capabilities that the particular Data Source exposes.
|
||||
|
||||
|
||||
## Querying
|
||||
|
||||
The query language and capabilities of each Data Source are obviously very different. You can combine data from multiple Data Sources onto a single Dashboard, but each Panel is tied to a specific Data Source that belongs to a particular Organization.
|
||||
@@ -22,18 +23,14 @@ The query language and capabilities of each Data Source are obviously very diffe
|
||||
The following datasources are officially supported:
|
||||
|
||||
* [Graphite]({{< relref "graphite.md" >}})
|
||||
* [Prometheus]({{< relref "prometheus.md" >}})
|
||||
* [InfluxDB]({{< relref "influxdb.md" >}})
|
||||
* [Elasticsearch]({{< relref "elasticsearch.md" >}})
|
||||
* [Google Stackdriver]({{< relref "stackdriver.md" >}})
|
||||
* [AWS CloudWatch]({{< relref "cloudwatch.md" >}})
|
||||
* [Azure Monitor]({{< relref "azuremonitor.md" >}})
|
||||
* [Loki]({{< relref "loki.md" >}})
|
||||
* [MySQL]({{< relref "mysql.md" >}})
|
||||
* [PostgreSQL]({{< relref "postgres.md" >}})
|
||||
* [Microsoft SQL Server (MSSQL)]({{< relref "mssql.md" >}})
|
||||
* [CloudWatch]({{< relref "cloudwatch.md" >}})
|
||||
* [InfluxDB]({{< relref "influxdb.md" >}})
|
||||
* [OpenTSDB]({{< relref "opentsdb.md" >}})
|
||||
* [Testdata]({{< relref "testdata.md" >}})
|
||||
* [Prometheus]({{< relref "prometheus.md" >}})
|
||||
* [MySQL]({{< relref "mysql.md" >}})
|
||||
* [Postgres]({{< relref "postgres.md" >}})
|
||||
* [Microsoft SQL Server (MSSQL)]({{< relref "mssql.md" >}})
|
||||
|
||||
## Data source plugins
|
||||
|
||||
|
||||
@@ -7,7 +7,7 @@ aliases = ["/datasources/influxdb"]
|
||||
[menu.docs]
|
||||
name = "InfluxDB"
|
||||
parent = "datasources"
|
||||
weight = 2
|
||||
weight = 3
|
||||
+++
|
||||
|
||||
# Using InfluxDB in Grafana
|
||||
|
||||
@@ -1,137 +0,0 @@
|
||||
+++
|
||||
title = "Using Loki in Grafana"
|
||||
description = "Guide for using Loki in Grafana"
|
||||
keywords = ["grafana", "loki", "logging", "guide"]
|
||||
type = "docs"
|
||||
aliases = ["/datasources/loki"]
|
||||
[menu.docs]
|
||||
name = "Loki"
|
||||
parent = "datasources"
|
||||
weight = 6
|
||||
+++
|
||||
|
||||
# Using Loki in Grafana
|
||||
|
||||
> BETA: Querying Loki data requires Grafana's Explore section.
|
||||
> Grafana v6.x comes with Explore enabled by default.
|
||||
> In Grafana v5.3.x and v5.4.x. you need to enable Explore manually.
|
||||
> Viewing Loki data in dashboard panels is not supported yet, but is being worked on.
|
||||
|
||||
Grafana ships with built-in support for Loki, Grafana's log aggregation system.
|
||||
Just add it as a datasource and you are ready to query your log data in [Explore](/features/explore).
|
||||
|
||||
## Adding the data source to Grafana
|
||||
|
||||
1. Open Grafana and make sure you are logged in.
|
||||
2. In the side menu under the `Configuration` link you should find a link named `Data Sources`.
|
||||
3. Click the `Add data source` button at the top.
|
||||
4. Select `Loki` from the list of data sources.
|
||||
|
||||
> NOTE: If you're not seeing the `Data Sources` link in your side menu it means that your current user does not have the `Admin` role for the current organization.
|
||||
|
||||
| Name | Description |
|
||||
| --------------- | --------------------------------------------------------------------------------------------------------------------------------------------- |
|
||||
| _Name_ | The datasource name. This is how you refer to the datasource in panels, queries, and Explore. |
|
||||
| _Default_ | Default datasource means that it will be pre-selected for new panels. |
|
||||
| _URL_ | The URL of the Loki instance, e.g., `http://localhost:3100` |
|
||||
| _Maximum lines_ | Upper limit for number of log lines returned by Loki (default is 1000). Decrease if your browser is sluggish when displaying logs in Explore. |
|
||||
|
||||
## Querying Logs
|
||||
|
||||
Querying and displaying log data from Loki is available via [Explore](/features/explore).
|
||||
Select the Loki data source, and then enter a log query to display your logs.
|
||||
|
||||
> Viewing Loki data in dashboard panels is not supported yet, but is being worked on.
|
||||
|
||||
### Log Queries
|
||||
|
||||
A log query consists of two parts: **log stream selector**, and a **search expression**. For performance reasons you need to start by choosing a log stream by selecting a log label.
|
||||
|
||||
The Logs Explorer (the `Log labels` button) next to the query field shows a list of labels of available log streams. An alternative way to write a query is to use the query field's autocomplete - you start by typing a left curly brace `{` and the autocomplete menu will suggest a list of labels. Press the `enter` key to execute the query.
|
||||
|
||||
Once the result is returned, the log panel shows a list of log rows and a bar chart where the x-axis shows the time and the y-axis shows the frequency/count.
|
||||
|
||||
<div class="medium-6 columns">
|
||||
<video width="800" height="500" controls>
|
||||
<source src="/assets/videos/explore_loki.mp4" type="video/mp4">
|
||||
Your browser does not support the video tag.
|
||||
</video>
|
||||
</div>
|
||||
|
||||
<br />
|
||||
|
||||
### Log Stream Selector
|
||||
|
||||
For the label part of the query expression, wrap it in curly braces `{}` and then use the key value syntax for selecting labels. Multiple label expressions are separated by a comma:
|
||||
|
||||
`{app="mysql",name="mysql-backup"}`
|
||||
|
||||
The following label matching operators are currently supported:
|
||||
|
||||
* `=` exactly equal.
|
||||
* `!=` not equal.
|
||||
* `=~` regex-match.
|
||||
* `!~` do not regex-match.
|
||||
|
||||
Examples:
|
||||
|
||||
* `{name=~"mysql.+"}`
|
||||
* `{name!~"mysql.+"}`
|
||||
|
||||
The [same rules that apply for Prometheus Label Selectors](https://prometheus.io/docs/prometheus/latest/querying/basics/#instant-vector-selectors) apply for Loki Log Stream Selectors.
|
||||
|
||||
Another way to add a label selector, is in the table section, clicking on the **Filter** button beside a label will add the label to the query expression. This even works for multiple queries and will the label selector to each query.
|
||||
|
||||
### Search Expression
|
||||
|
||||
After writing the Log Stream Selector, you can filter the results further by writing a search expression. The search expression can be just text or a regex expression.
|
||||
|
||||
Example queries:
|
||||
|
||||
* `{job="mysql"} error`
|
||||
* `{name="kafka"} tsdb-ops.*io:2003`
|
||||
* `{instance=~"kafka-[23]",name="kafka"} kafka.server:type=ReplicaManager`
|
||||
|
||||
## Templating
|
||||
|
||||
Template variables are not yet supported by Loki.
|
||||
|
||||
## Annotations
|
||||
|
||||
Annotations are not yet supported by Loki.
|
||||
|
||||
## Configure the Datasource with Provisioning
|
||||
|
||||
You can set up the datasource via config files with Grafana's provisioning system.
|
||||
You can read more about how it works and all the settings you can set for datasources on the [provisioning docs page](/administration/provisioning/#datasources)
|
||||
|
||||
Here is an example:
|
||||
|
||||
```yaml
|
||||
apiVersion: 1
|
||||
|
||||
datasources:
|
||||
- name: Loki
|
||||
type: loki
|
||||
access: proxy
|
||||
url: http://localhost:3100
|
||||
jsonData:
|
||||
maxLines: 1000
|
||||
```
|
||||
|
||||
Here's another with basic auth:
|
||||
|
||||
```yaml
|
||||
apiVersion: 1
|
||||
|
||||
datasources:
|
||||
- name: Loki
|
||||
type: loki
|
||||
access: proxy
|
||||
url: http://localhost:3100
|
||||
basicAuth: true
|
||||
basicAuthUser: my_user
|
||||
basicAuthPassword: test_password
|
||||
jsonData:
|
||||
maxLines: 1000
|
||||
```
|
||||
@@ -110,9 +110,6 @@ Macro example | Description
|
||||
*$__unixEpochFilter(dateColumn)* | Will be replaced by a time range filter using the specified column name with times represented as unix timestamp. For example, *dateColumn > 1494410783 AND dateColumn < 1494497183*
|
||||
*$__unixEpochFrom()* | Will be replaced by the start of the currently active time selection as unix timestamp. For example, *1494410783*
|
||||
*$__unixEpochTo()* | Will be replaced by the end of the currently active time selection as unix timestamp. For example, *1494497183*
|
||||
*$__unixEpochNanoFilter(dateColumn)* | Will be replaced by a time range filter using the specified column name with times represented as nanosecond timestamp. For example, *dateColumn > 1494410783152415214 AND dateColumn < 1494497183142514872*
|
||||
*$__unixEpochNanoFrom()* | Will be replaced by the start of the currently active time selection as nanosecond timestamp. For example, *1494410783152415214*
|
||||
*$__unixEpochNanoTo()* | Will be replaced by the end of the currently active time selection as nanosecond timestamp. For example, *1494497183142514872*
|
||||
*$__unixEpochGroup(dateColumn,'5m', [fillmode])* | Same as $__timeGroup but for times stored as unix timestamp (only available in Grafana 5.3+).
|
||||
*$__unixEpochGroupAlias(dateColumn,'5m', [fillmode])* | Same as above but also adds a column alias (only available in Grafana 5.3+).
|
||||
|
||||
|
||||
@@ -144,9 +144,6 @@ Macro example | Description
|
||||
*$__unixEpochFilter(dateColumn)* | Will be replaced by a time range filter using the specified column name with times represented as unix timestamp. For example, *dateColumn > 1494410783 AND dateColumn < 1494497183*
|
||||
*$__unixEpochFrom()* | Will be replaced by the start of the currently active time selection as unix timestamp. For example, *1494410783*
|
||||
*$__unixEpochTo()* | Will be replaced by the end of the currently active time selection as unix timestamp. For example, *1494497183*
|
||||
*$__unixEpochNanoFilter(dateColumn)* | Will be replaced by a time range filter using the specified column name with times represented as nanosecond timestamp. For example, *dateColumn > 1494410783152415214 AND dateColumn < 1494497183142514872*
|
||||
*$__unixEpochNanoFrom()* | Will be replaced by the start of the currently active time selection as nanosecond timestamp. For example, *1494410783152415214*
|
||||
*$__unixEpochNanoTo()* | Will be replaced by the end of the currently active time selection as nanosecond timestamp. For example, *1494497183142514872*
|
||||
*$__unixEpochGroup(dateColumn,'5m', [fillmode])* | Same as $__timeGroup but for times stored as unix timestamp (only available in Grafana 5.3+).
|
||||
*$__unixEpochGroupAlias(dateColumn,'5m', [fillmode])* | Same as above but also adds a column alias (only available in Grafana 5.3+).
|
||||
|
||||
|
||||
@@ -7,7 +7,7 @@ aliases = ["/datasources/opentsdb", "docs/features/opentsdb"]
|
||||
[menu.docs]
|
||||
name = "OpenTSDB"
|
||||
parent = "datasources"
|
||||
weight = 19
|
||||
weight = 5
|
||||
+++
|
||||
|
||||
# Using OpenTSDB in Grafana
|
||||
|
||||
@@ -154,9 +154,6 @@ Macro example | Description
|
||||
*$__unixEpochFilter(dateColumn)* | Will be replaced by a time range filter using the specified column name with times represented as unix timestamps. For example, *dateColumn >= 1494410783 AND dateColumn <= 1494497183*
|
||||
*$__unixEpochFrom()* | Will be replaced by the start of the currently active time selection as unix timestamp. For example, *1494410783*
|
||||
*$__unixEpochTo()* | Will be replaced by the end of the currently active time selection as unix timestamp. For example, *1494497183*
|
||||
*$__unixEpochNanoFilter(dateColumn)* | Will be replaced by a time range filter using the specified column name with times represented as nanosecond timestamps. For example, *dateColumn >= 1494410783152415214 AND dateColumn <= 1494497183142514872*
|
||||
*$__unixEpochNanoFrom()* | Will be replaced by the start of the currently active time selection as nanosecond timestamp. For example, *1494410783152415214*
|
||||
*$__unixEpochNanoTo()* | Will be replaced by the end of the currently active time selection as unix timestamp. For example, *1494497183142514872*
|
||||
*$__unixEpochGroup(dateColumn,'5m', [fillmode])* | Same as $__timeGroup, but for times stored as unix timestamp (only available in Grafana 5.3+).
|
||||
*$__unixEpochGroupAlias(dateColumn,'5m', [fillmode])* | Same as above, but also adds a column alias (only available in Grafana 5.3+).
|
||||
|
||||
|
||||
@@ -7,7 +7,7 @@ aliases = ["/datasources/prometheus"]
|
||||
[menu.docs]
|
||||
name = "Prometheus"
|
||||
parent = "datasources"
|
||||
weight = 1
|
||||
weight = 2
|
||||
+++
|
||||
|
||||
# Using Prometheus in Grafana
|
||||
@@ -19,22 +19,22 @@ Grafana includes built-in support for Prometheus.
|
||||
1. Open the side menu by clicking the Grafana icon in the top header.
|
||||
2. In the side menu under the `Dashboards` link you should find a link named `Data Sources`.
|
||||
3. Click the `+ Add data source` button in the top header.
|
||||
4. Select `Prometheus` from the _Type_ dropdown.
|
||||
4. Select `Prometheus` from the *Type* dropdown.
|
||||
|
||||
> NOTE: If you're not seeing the `Data Sources` link in your side menu it means that your current user does not have the `Admin` role for the current organization.
|
||||
|
||||
## Data source options
|
||||
|
||||
| Name | Description |
|
||||
| ----------------- | ------------------------------------------------------------------------------------------------------------------------------------- |
|
||||
| _Name_ | The data source name. This is how you refer to the data source in panels & queries. |
|
||||
| _Default_ | Default data source means that it will be pre-selected for new panels. |
|
||||
| _Url_ | The http protocol, ip and port of you Prometheus server (default port is usually 9090) |
|
||||
| _Access_ | Server (default) = URL needs to be accessible from the Grafana backend/server, Browser = URL needs to be accessible from the browser. |
|
||||
| _Basic Auth_ | Enable basic authentication to the Prometheus data source. |
|
||||
| _User_ | Name of your Prometheus user |
|
||||
| _Password_ | Database user's password |
|
||||
| _Scrape interval_ | This will be used as a lower limit for the Prometheus step query parameter. Default value is 15s. |
|
||||
Name | Description
|
||||
------------ | -------------
|
||||
*Name* | The data source name. This is how you refer to the data source in panels & queries.
|
||||
*Default* | Default data source means that it will be pre-selected for new panels.
|
||||
*Url* | The http protocol, ip and port of you Prometheus server (default port is usually 9090)
|
||||
*Access* | Server (default) = URL needs to be accessible from the Grafana backend/server, Browser = URL needs to be accessible from the browser.
|
||||
*Basic Auth* | Enable basic authentication to the Prometheus data source.
|
||||
*User* | Name of your Prometheus user
|
||||
*Password* | Database user's password
|
||||
*Scrape interval* | This will be used as a lower limit for the Prometheus step query parameter. Default value is 15s.
|
||||
|
||||
## Query editor
|
||||
|
||||
@@ -43,17 +43,14 @@ Open a graph in edit mode by click the title > Edit (or by pressing `e` key whil
|
||||
{{< docs-imagebox img="/img/docs/v45/prometheus_query_editor_still.png"
|
||||
animated-gif="/img/docs/v45/prometheus_query_editor.gif" >}}
|
||||
|
||||
| Name | Description |
|
||||
| ------------------ | ----------------------------------------------------------------------------------------------------------------------------------------------------------------------------------------------------------------------------------------------------------------------------------------------------------------------------------- |
|
||||
| _Query expression_ | Prometheus query expression, check out the [Prometheus documentation](http://prometheus.io/docs/querying/basics/). |
|
||||
| _Legend format_ | Controls the name of the time series, using name or pattern. For example `{{hostname}}` will be replaced with label value for the label `hostname`. |
|
||||
| _Min step_ | Set a lower limit for the Prometheus step option. Step controls how big the jumps are when the Prometheus query engine performs range queries. Sadly there is no official prometheus documentation to link to for this very important option. |
|
||||
| _Resolution_ | Controls the step option. Small steps create high-resolution graphs but can be slow over larger time ranges, lowering the resolution can speed things up. `1/2` will try to set step option to generate 1 data point for every other pixel. A value of `1/10` will try to set step option so there is a data point every 10 pixels. |
|
||||
| _Metric lookup_ | Search for metric names in this input field. |
|
||||
| _Format as_ | Switch between Table, Time series or Heatmap. Table format will only work in the Table panel. Heatmap format is suitable for displaying metrics having histogram type on Heatmap panel. Under the hood, it converts cumulative histogram to regular and sorts series by the bucket bound. |
|
||||
|
||||
> NOTE: Grafana slightly modifies the request dates for queries to align them with the dynamically calculated step.
|
||||
> This ensures consistent display of metrics data but can result in a small gap of data at the right edge of a graph.
|
||||
Name | Description
|
||||
------- | --------
|
||||
*Query expression* | Prometheus query expression, check out the [Prometheus documentation](http://prometheus.io/docs/querying/basics/).
|
||||
*Legend format* | Controls the name of the time series, using name or pattern. For example `{{hostname}}` will be replaced with label value for the label `hostname`.
|
||||
*Min step* | Set a lower limit for the Prometheus step option. Step controls how big the jumps are when the Prometheus query engine performs range queries. Sadly there is no official prometheus documentation to link to for this very important option.
|
||||
*Resolution* | Controls the step option. Small steps create high-resolution graphs but can be slow over larger time ranges, lowering the resolution can speed things up. `1/2` will try to set step option to generate 1 data point for every other pixel. A value of `1/10` will try to set step option so there is a data point every 10 pixels.
|
||||
*Metric lookup* | Search for metric names in this input field.
|
||||
*Format as* | Switch between Table, Time series or Heatmap. Table format will only work in the Table panel. Heatmap format is suitable for displaying metrics having histogram type on Heatmap panel. Under the hood, it converts cumulative histogram to regular and sorts series by the bucket bound.
|
||||
|
||||
## Templating
|
||||
|
||||
@@ -66,18 +63,18 @@ types of template variables.
|
||||
|
||||
### Query variable
|
||||
|
||||
Variable of the type _Query_ allows you to query Prometheus for a list of metrics, labels or label values. The Prometheus data source plugin
|
||||
Variable of the type *Query* allows you to query Prometheus for a list of metrics, labels or label values. The Prometheus data source plugin
|
||||
provides the following functions you can use in the `Query` input field.
|
||||
|
||||
| Name | Description |
|
||||
| ----------------------------- | ----------------------------------------------------------------------- |
|
||||
| _label_names()_ | Returns a list of label names. |
|
||||
| _label_values(label)_ | Returns a list of label values for the `label` in every metric. |
|
||||
| _label_values(metric, label)_ | Returns a list of label values for the `label` in the specified metric. |
|
||||
| _metrics(metric)_ | Returns a list of metrics matching the specified `metric` regex. |
|
||||
| _query_result(query)_ | Returns a list of Prometheus query result for the `query`. |
|
||||
Name | Description
|
||||
---- | --------
|
||||
*label_values(label)* | Returns a list of label values for the `label` in every metric.
|
||||
*label_values(metric, label)* | Returns a list of label values for the `label` in the specified metric.
|
||||
*metrics(metric)* | Returns a list of metrics matching the specified `metric` regex.
|
||||
*query_result(query)* | Returns a list of Prometheus query result for the `query`.
|
||||
|
||||
For details of *metric names*, *label names* and *label values* are please refer to the [Prometheus documentation](http://prometheus.io/docs/concepts/data_model/#metric-names-and-labels).
|
||||
|
||||
For details of _metric names_, _label names_ and _label values_ are please refer to the [Prometheus documentation](http://prometheus.io/docs/concepts/data_model/#metric-names-and-labels).
|
||||
|
||||
#### Using interval and range variables
|
||||
|
||||
@@ -108,10 +105,10 @@ Regex:
|
||||
|
||||
There are two syntaxes:
|
||||
|
||||
- `$<varname>` Example: rate(http_requests_total{job=~"\$job"}[5m])
|
||||
- `$<varname>` Example: rate(http_requests_total{job=~"$job"}[5m])
|
||||
- `[[varname]]` Example: rate(http_requests_total{job=~"[[job]]"}[5m])
|
||||
|
||||
Why two ways? The first syntax is easier to read and write but does not allow you to use a variable in the middle of a word. When the _Multi-value_ or _Include all value_
|
||||
Why two ways? The first syntax is easier to read and write but does not allow you to use a variable in the middle of a word. When the *Multi-value* or *Include all value*
|
||||
options are enabled, Grafana converts the labels from plain text to a regex compatible string. Which means you have to use `=~` instead of `=`.
|
||||
|
||||
## Annotations
|
||||
|
||||
@@ -5,15 +5,15 @@ keywords = ["grafana", "stackdriver", "google", "guide"]
|
||||
type = "docs"
|
||||
aliases = ["/datasources/stackdriver"]
|
||||
[menu.docs]
|
||||
name = "Google Stackdriver"
|
||||
name = "Stackdriver"
|
||||
parent = "datasources"
|
||||
weight = 4
|
||||
weight = 11
|
||||
+++
|
||||
|
||||
# Using Google Stackdriver in Grafana
|
||||
|
||||
> Available as a beta feature in Grafana v5.3.x and v5.4.x.
|
||||
> Officially released in Grafana v6.0.0
|
||||
> Only available in Grafana v5.3+.
|
||||
> The datasource is currently a beta feature and is subject to change.
|
||||
|
||||
Grafana ships with built-in support for Google Stackdriver. Just add it as a datasource and you are ready to build dashboards for your Stackdriver metrics.
|
||||
|
||||
@@ -66,7 +66,7 @@ Click on the links above and click the `Enable` button:
|
||||
4. Some new fields will appear. Fill in a name for the service account in the `Service account name` field and then choose the `Monitoring Viewer` role from the `Role` dropdown:
|
||||
|
||||
{{< docs-imagebox img="/img/docs/v53/stackdriver_service_account_choose_role.png" class="docs-image--no-shadow" caption="Choose role" >}}
|
||||
|
||||
|
||||
5. Click the Create button. A JSON key file will be created and downloaded to your computer. Store this file in a secure place as it allows access to your Stackdriver data.
|
||||
6. Upload it to Grafana on the datasource Configuration page. You can either upload the file or paste in the contents of the file.
|
||||
|
||||
@@ -156,7 +156,7 @@ Example Alias By: `{{metric.type}} - {{metric.labels.instance_name}}`
|
||||
|
||||
Example Result: `compute.googleapis.com/instance/cpu/usage_time - server1-prod`
|
||||
|
||||
It is also possible to resolve the name of the Monitored Resource Type.
|
||||
It is also possible to resolve the name of the Monitored Resource Type.
|
||||
|
||||
| Alias Pattern Format | Description | Example Result |
|
||||
| -------------------- | ----------------------------------------------- | -------------- |
|
||||
|
||||
@@ -1,110 +0,0 @@
|
||||
+++
|
||||
title = "Explore"
|
||||
keywords = ["explore", "loki", "logs"]
|
||||
type = "docs"
|
||||
[menu.docs]
|
||||
name = "Explore"
|
||||
identifier = "explore"
|
||||
parent = "features"
|
||||
weight = 5
|
||||
+++
|
||||
|
||||
# Explore
|
||||
|
||||
> Explore is only available in Grafana 6.0 and above.
|
||||
|
||||
## Introduction
|
||||
|
||||
One of the major new features of Grafana 6.0 is the new query-focused Explore workflow for troubleshooting and/or for data exploration.
|
||||
|
||||
Grafana's dashboard UI is all about building dashboards for visualization. Explore strips away all the dashboard and panel options so that you can focus on the query. Iterate until you have a working query and then think about building a dashboard.
|
||||
|
||||
For infrastructure monitoring and incident response, you no longer need to switch to other tools to debug what went wrong. Explore allows you to dig deeper into your metrics and logs to find the cause. Grafana's new logging datasource, [Loki](https://github.com/grafana/loki) is tightly integrated into Explore and allows you to correlate metrics and logs by viewing them side-by-side. This creates a new debugging workflow where you can:
|
||||
|
||||
1. Receive an alert
|
||||
2. Drill down and examine metrics
|
||||
3. Drill down again and search logs related to the metric and time interval (and in the future, distributed traces).
|
||||
|
||||
If you just want to explore your data and do not want to create a dashboard then Explore makes this much easier. Explore will show the results as both a graph and a table enabling you to see trends in the data and more detail at the same time (if the datasource supports both graph and table data).
|
||||
|
||||
## How to Start Exploring
|
||||
|
||||
There is a new Explore icon on the menu bar to the left. This opens a new empty Explore tab.
|
||||
|
||||
{{< docs-imagebox img="/img/docs/v60/explore_menu.png" class="docs-image--no-shadow" caption="Screenshot of the new Explore Icon" >}}
|
||||
|
||||
If you want to start with an existing query in a panel then choose the Explore option from the Panel menu. This opens an Explore tab with the query from the panel and allows you to tweak or iterate in the query outside of your dashboard.
|
||||
|
||||
{{< docs-imagebox img="/img/docs/v60/explore_panel_menu.png" class="docs-image--no-shadow" caption="Screenshot of the new Explore option in the panel menu" >}}
|
||||
|
||||
Choose your datasource in the dropdown in the top left. Prometheus has a custom Explore implementation, the other datasources (for now) use their standard query editor.
|
||||
|
||||
The query field is where you can write your query and explore your data. There are three buttons beside the query field, a clear button (X), an add query button (+) and the remove query button (-). Just like the normal query editor, you can add and remove multiple queries.
|
||||
|
||||
## Split and Compare
|
||||
|
||||
The Split feature is an easy way to compare graphs and tables side-by-side or to look at related data together on one page. Click the split button to duplicate the current query and split the page into two side-by-side queries. It is possible to select another datasource for the new query which for example, allows you to compare the same query for two different servers or to compare the staging environment to the production environment.
|
||||
|
||||
{{< docs-imagebox img="/img/docs/v60/explore_split.png" class="docs-image--no-shadow" caption="Screenshot of the new Explore option in the panel menu" >}}
|
||||
|
||||
You can close the newly created query by clicking on the Close Split button.
|
||||
|
||||
## Prometheus-specific Features
|
||||
|
||||
The first version of Explore features a custom querying experience for Prometheus. When a query is executed, it actually executes two queries, a normal Prometheus query for the graph and an Instant Query for the table. An Instant Query returns the last value for each time series which shows a good summary of the data shown in the graph.
|
||||
|
||||
### Metrics Explorer
|
||||
|
||||
On the left-hand side of the query field is a `Metrics` button, clicking on this opens the Metric Explorer. This shows a hierarchical menu with metrics grouped by their prefix. For example, all the Alert Manager metrics will be grouped under the `alertmanager` prefix. This is a good starting point if you just want to explore which metrics are available.
|
||||
|
||||
{{< docs-imagebox img="/img/docs/v60/explore_metric_explorer.png" class="docs-image--no-shadow" caption="Screenshot of the new Explore option in the panel menu" >}}
|
||||
|
||||
### Query Field
|
||||
|
||||
The Query field supports autocomplete for metric names, function and works mostly the same way as the standard Prometheus query editor. Press the enter key to execute a query.
|
||||
|
||||
The autocomplete menu can be trigger by pressing Ctrl + Space. The Autocomplete menu contains a new History section with a list of recently executed queries.
|
||||
|
||||
Suggestions can appear under the query field - click on them to update your query with the suggested change.
|
||||
|
||||
* For counters (monotonously increasing metrics), a rate function will be suggested.
|
||||
* For buckets, a histogram function will be suggested.
|
||||
* For recording rules, possible to expand the rules.
|
||||
|
||||
### Table Filters
|
||||
|
||||
Click on the filter button <span title="Filter for label" class="logs-label__icon fa fa-search-plus"></span> in a labels column in the Table panel to add filters to the query expression. This works with multiple queries too - the filter will be added for all the queries.
|
||||
|
||||
## Logs Integration - Loki-specific Features
|
||||
|
||||
For Grafana 6.0, the first log integration is for the new open source log aggregation system from Grafana Labs - [Loki](https://github.com/grafana/loki). Loki is designed to be very cost effective, as it does not index the contents of the logs, but rather a set of labels for each log stream. The logs from Loki are queried in a similar way to querying with label selectors in Prometheus. It uses labels to group log streams which can be made to match up with your Prometheus labels. Read more about Grafana Loki [here](https://github.com/grafana/loki) or the Grafana Labs hosted variant: [Grafana Cloud Logs](https://grafana.com/loki).
|
||||
|
||||
See the [Loki's data source documentation](../datasources/loki) on how to query for log data.
|
||||
|
||||
### Switching from Metrics to Logs
|
||||
|
||||
If you switch from a Prometheus query to a logs query (you can do a split first to have your metrics and logs side by side) then it will keep the labels from your query that exist in the logs and use those to query the log streams. For example, the following Prometheus query:
|
||||
|
||||
`grafana_alerting_active_alerts{job="grafana"}`
|
||||
|
||||
after switching to the Logs datasource, the query changes to:
|
||||
|
||||
`{job="grafana"}`
|
||||
|
||||
This will return a chunk of logs in the selected time range that can be grepped/text searched.
|
||||
|
||||
### Deduping
|
||||
|
||||
Log data can be very repetitive and Explore can help by hiding duplicate log lines. There are a few different deduplication algorithms that you can use:
|
||||
|
||||
* `exact` Exact matches are done on the whole line, except for date fields.
|
||||
* `numbers` Matches on the line after stripping out numbers (durations, IP addresses etc.).
|
||||
* `signature` The most aggressive deduping - strips all letters and numbers, and matches on the remaining whitespace and punctuation.
|
||||
|
||||
### Timestamp, Local time and Labels
|
||||
|
||||
There are some other check boxes under the logging graph apart from the Deduping options.
|
||||
|
||||
* Timestamp: shows/hides the Timestamp column
|
||||
* Local time: shows/hides the Local time column
|
||||
* Labels: shows/hides the label filters column
|
||||
@@ -134,7 +134,7 @@ continue work on a `build mode` for a future release.
|
||||
The new row menu automatically slides out when you mouse over the edge of the row. You no longer need
|
||||
to hover over the small green icon and then click it to expand the row menu.
|
||||
|
||||
There are some minor improvements to drag and drop behavior. Now when dragging a panel from one row
|
||||
There are some minor improvements to drag and drop behaviour. Now when dragging a panel from one row
|
||||
to another you will insert the panel and Grafana will automatically make room for it.
|
||||
When you drag a panel within a row you will simply reorder the panels.
|
||||
|
||||
|
||||
@@ -26,7 +26,7 @@ Grafana v5.3 brings new features, many enhancements and bug fixes. This article
|
||||
|
||||
{{< docs-imagebox img="/img/docs/v53/stackdriver-with-heatmap.png" max-width= "600px" class="docs-image--no-shadow docs-image--right" >}}
|
||||
|
||||
Grafana v5.3 ships with built-in support for [Google Stackdriver](https://cloud.google.com/stackdriver/) and enables you to visualize your Stackdriver metrics in Grafana.
|
||||
Grafana v5.3 ships with built-in support for [Google Stackdriver](https://cloud.google.com/stackdriver/) and enables you to visualize your Stackdriver metrics in Grafana.
|
||||
|
||||
Getting started with the plugin is easy. Simply create a GCE Service account that has access to the Stackdriver API scope, download the Service Account key file from Google and upload it on the Stackdriver datasource config page in Grafana and you should have a secure server-to-server authentication setup. Like other core plugins, Stackdriver has built-in support for alerting. It also comes with support for heatmaps and basic variables.
|
||||
|
||||
|
||||
@@ -1,83 +0,0 @@
|
||||
+++
|
||||
title = "What's New in Grafana v5.4"
|
||||
description = "Feature & improvement highlights for Grafana v5.4"
|
||||
keywords = ["grafana", "new", "documentation", "5.4"]
|
||||
type = "docs"
|
||||
[menu.docs]
|
||||
name = "Version 5.4"
|
||||
identifier = "v5.4"
|
||||
parent = "whatsnew"
|
||||
weight = -10
|
||||
+++
|
||||
|
||||
# What's New in Grafana v5.4
|
||||
|
||||
Grafana v5.4 brings new features, many enhancements and bug fixes. This article will detail the major new features and enhancements.
|
||||
|
||||
- [Alerting]({{< relref "#alerting" >}}) Limit false positives with the new `For` setting
|
||||
- [Google Stackdriver]({{< relref "#google-stackdriver" >}}) Now with support for templating queries
|
||||
- [MySQL]({{< relref "#mysql-query-builder" >}}) gets a new query builder!
|
||||
- [Graph Panel]({{< relref "#graph-panel-enhancements" >}}) Highlight time regions and more
|
||||
- [Team Preferences]({{< relref "#team-preferences" >}}) Give your teams their own home dashboard
|
||||
|
||||
## Alerting
|
||||
|
||||
{{< docs-imagebox img="/img/docs/v54/alerting-for-dark-theme.png" max-width="600px" class="docs-image--right" >}}
|
||||
|
||||
Grafana v5.4 ships with a new alert rule setting named `For` which is great for removing false positives. If an alert rule has a configured `For` and the query violates the configured threshold it will first go from `OK` to `Pending`. Going from `OK` to `Pending` Grafana will not send any notifications. Once the alert rule has been firing for more than `For` duration, it will change to `Alerting` and send alert notifications. Typically, it's always a good idea to use this setting since it's often worse to get false positive than wait a few minutes before the alert notification triggers.
|
||||
|
||||
In the screenshot you can see an example timeline of an alert using the `For` setting. At ~16:04 the alert state changes to `Pending` and after 4 minutes it changes to `Alerting` which is when alert notifications are sent. Once the series falls back to normal the alert rule goes back to `OK`. [Learn more](/alerting/rules/#for).
|
||||
|
||||
Additionally, there's now support for disable the sending of `OK` alert notifications. [Learn more](/alerting/notifications/#disable-resolve-message).
|
||||
|
||||
<div class="clearfix"></div>
|
||||
|
||||
## Google Stackdriver
|
||||
|
||||
{{< docs-imagebox img="/img/docs/v54/stackdriver_template_query.png" max-width="600px" class="docs-image--right" >}}
|
||||
|
||||
Grafana v5.3 included built-in support for [Google Stackdriver](https://cloud.google.com/stackdriver/) which enables you to visualize your Stackdriver metrics in Grafana.
|
||||
One important feature missing was support for templating queries. This is now included together with a brand new templating query editor for Stackdriver.
|
||||
|
||||
The Stackdriver templating query editor lets you choose from a set of different Query Types. This will in turn reveal additional drop downs to help you
|
||||
find, filter and select the templating values you're interested in, see screenshot for details. The templating query editor also supports chaining multiple variables
|
||||
making it easy to define variables that's dependent on other variables.
|
||||
|
||||
Stackdriver is the first datasource which has support for a custom templating query editor. But starting from Grafana v5.4 it's now possible for all datasources, including plugin datasources, to
|
||||
create their very own templating query editor.
|
||||
|
||||
Additionally, if Grafana is running on a Google Compute Engine (GCE) virtual machine, it is now possible for Grafana to automatically retrieve default credentials from the metadata server.
|
||||
This has the advantage of not needing to generate a private key file for the service account and also not having to upload the file to Grafana. [Learn more](/features/datasources/stackdriver/#using-gce-default-service-account).
|
||||
|
||||
Please read [Using Google Stackdriver in Grafana](/features/datasources/stackdriver/) for more detailed information on how to get started and use it.
|
||||
|
||||
<div class="clearfix"></div>
|
||||
|
||||
## MySQL Query Builder
|
||||
|
||||
Grafana v5.4 comes with a new graphical query builder for MySQL. This brings MySQL integration more in line with some of the other datasources and makes it easier for both advanced users and beginners to work with timeseries in MySQL. Learn more about it in the [documentation](/features/datasources/mysql/#query-editor).
|
||||
|
||||
{{< docs-imagebox img="/img/docs/v54/mysql_query_still.png" animated-gif="/img/docs/v54/mysql_query.gif" >}}
|
||||
|
||||
## Graph Panel Enhancements
|
||||
|
||||
Grafana v5.4 adds support for highlighting weekdays and/or certain timespans in the graph panel. This should make it easier to compare for example weekends, business hours and/or off work hours.
|
||||
|
||||
{{< docs-imagebox img="/img/docs/v54/graph_time_regions.png" max-width= "800px" >}}
|
||||
|
||||
Additionally, when rendering series as lines in the graph panel, should there be only one data point available for one series so that a connecting line cannot be established, a point will
|
||||
automatically be rendered for that data point. This should make it easier to understand what's going on when only receiving a single data point.
|
||||
|
||||
{{< docs-imagebox img="/img/docs/v54/graph_dot_single_point.png" max-width= "800px" >}}
|
||||
|
||||
## Team Preferences
|
||||
|
||||
Grafana v5.4 adds support for customizing home dashboard, timezone and theme for teams, in addition to the existing customization on Organization and user Profile level.
|
||||
|
||||
1. Specifying a preference on User Profile level will override preference on Team and/or Organization level
|
||||
2. Specifying a preference on Team level will override preference on Organization level.
|
||||
|
||||
## Changelog
|
||||
|
||||
Checkout the [CHANGELOG.md](https://github.com/grafana/grafana/blob/master/CHANGELOG.md) file for a complete list
|
||||
of new features, changes, and bug fixes.
|
||||
@@ -1,176 +0,0 @@
|
||||
+++
|
||||
title = "What's New in Grafana v6.0"
|
||||
description = "Feature & improvement highlights for Grafana v6.0"
|
||||
keywords = ["grafana", "new", "documentation", "6.0"]
|
||||
type = "docs"
|
||||
[menu.docs]
|
||||
name = "Version 6.0"
|
||||
identifier = "v6.0"
|
||||
parent = "whatsnew"
|
||||
weight = -11
|
||||
+++
|
||||
|
||||
# What's New in Grafana v6.0
|
||||
|
||||
This update to Grafana introduces a new way of exploring your data, support for log data, and tons of other features.
|
||||
|
||||
The main highlights are:
|
||||
|
||||
- [Explore]({{< relref "#explore" >}}) - A new query focused workflow for ad-hoc data exploration and troubleshooting.
|
||||
- [Grafana Loki]({{< relref "#explore-and-grafana-loki" >}}) - Integration with the new open source log aggregation system from Grafana Labs.
|
||||
- [Gauge Panel]({{< relref "#gauge-panel" >}}) - A new standalone panel for gauges.
|
||||
- [New Panel Editor UX]({{< relref "#new-panel-editor" >}}) improves panel editing
|
||||
and enables easy switching between different visualizations.
|
||||
- [Google Stackdriver Datasource]({{< relref "#google-stackdriver-datasource" >}}) is out of beta and is officially released.
|
||||
- [Azure Monitor]({{< relref "#azure-monitor-datasource" >}}) plugin is ported from being an external plugin to being a core datasource
|
||||
- [React Plugin]({{< relref "#react-panels-query-editors" >}}) support enables an easier way to build plugins.
|
||||
- [Named Colors]({{< relref "#named-colors" >}}) in our new improved color picker.
|
||||
- [Removal of user session storage]({{< relref "#easier-to-deploy-improved-security" >}}) makes Grafana easier to deploy and improves security.
|
||||
|
||||
## Explore
|
||||
|
||||
{{< docs-imagebox img="/img/docs/v60/explore_prometheus.png" max-width="800px" class="docs-image--right" caption="Screenshot of the new Explore option in the panel menu" >}}
|
||||
|
||||
Grafana's dashboard UI is all about building dashboards for visualization. **Explore** strips away all the dashboard and panel options so that you can focus on the query and metric exploration. Iterate until you have a working query and then think about building a dashboard. You can also jump from a dashboard panel into **Explore** and from there do some ad-hoc query exporation with the panel queries as a starting point.
|
||||
|
||||
For infrastructure monitoring and incident response, you no longer need to switch to other tools to debug what went wrong. **Explore** allows you to dig deeper into your metrics and logs to find the cause. Grafana's new logging datasource, [Loki](https://github.com/grafana/loki) is tightly integrated into Explore and allows you to correlate metrics and logs by viewing them side-by-side.
|
||||
|
||||
**Explore** is a new paradigm for Grafana. It creates a new interactive debugging workflow that integrates two pillars
|
||||
of observability—metrics and logs. Explore works with every datasource but for Prometheus we have customized the
|
||||
query editor and the experience to provide the best possible exploration UX.
|
||||
|
||||
### Explore and Prometheus
|
||||
|
||||
Explore features a new [Prometheus query editor](/features/explore/#prometheus-specific-features). This new editor has improved autocomplete, metric tree selector,
|
||||
integrations with the Explore table view for easy label filtering, and useful query hints that can automatically apply
|
||||
functions to your query. There is also integration between Prometheus and Grafana Loki (see more about Loki below) that
|
||||
enabled jumping between metrics query and logs query with preserved label filters.
|
||||
|
||||
### Explore splits
|
||||
|
||||
Explore supports splitting the view so you can compare different queries, different datasources and metrics & logs side by side!
|
||||
|
||||
{{< docs-imagebox img="/img/docs/v60/explore_split.png" max-width="800px" caption="Screenshot of the new Explore option in the panel menu" >}}
|
||||
|
||||
<br />
|
||||
|
||||
### Explore and Grafana Loki
|
||||
|
||||
The log exploration & visualization features in Explore are available to any data source but are currently only implemented by the new open source log
|
||||
aggregation system from Grafana Lab called [Grafana Loki](https://github.com/grafana/loki).
|
||||
|
||||
Loki is a horizontally-scalable, highly-available, multi-tenant log aggregation system inspired by Prometheus. It is designed to be very cost effective, as it does not index the contents of the logs, but rather a set of labels for each log stream. The logs from Loki are queried in a similar way to querying with label selectors in Prometheus. It uses labels to group log streams which can be made to match up with your Prometheus labels.
|
||||
|
||||
Read more about Grafana Loki [here](https://github.com/grafana/loki) or [Grafana Labs hosted Loki](https://grafana.com/loki).
|
||||
|
||||
The Explore feature allows you to query logs and features a new log panel. In the near future, we will be adding support
|
||||
for other log sources to Explore and the next planned integration is Elasticsearch.
|
||||
|
||||
<div class="medium-6 columns">
|
||||
<video width="800" height="500" controls>
|
||||
<source src="/assets/videos/explore_loki.mp4" type="video/mp4">
|
||||
Your browser does not support the video tag.
|
||||
</video>
|
||||
</div>
|
||||
|
||||
<br />
|
||||
|
||||
## New Panel Editor
|
||||
|
||||
Grafana v6.0 has a completely redesigned UX around editing panels. You can now resize the visualization area if you want
|
||||
more space for queries/options and vice versa. You can now also change visualization (panel type) from within the new
|
||||
panel edit mode. No need to add a new panel to try out different visualizations! Check out the
|
||||
video below to see the new Panel Editor in action.
|
||||
|
||||
<div class="medium-6 columns">
|
||||
<video width="800" height="500" controls>
|
||||
<source src="/assets/videos/panel_change_viz.mp4" type="video/mp4">
|
||||
Your browser does not support the video tag.
|
||||
</video>
|
||||
</div>
|
||||
|
||||
<br>
|
||||
|
||||
### Gauge Panel
|
||||
|
||||
We have created a new separate Gauge panel as we felt having this visualization be a hidden option in the Singlestat panel
|
||||
was not ideal. When it supports 100% of the Singlestat Gauge features, we plan to add a migration so all
|
||||
singlestats that use it become Gauge panels instead. This new panel contains a new **Threshold** editor that we will
|
||||
continue to refine and start using in other panels.
|
||||
|
||||
{{< docs-imagebox img="/img/docs/v60/gauge_panel.png" max-width="600px" caption="Gauge Panel" >}}
|
||||
|
||||
<br>
|
||||
|
||||
### React Panels & Query Editors
|
||||
|
||||
A major part of all the work that has gone into Grafana v6.0 has been on the migration to React. This investment
|
||||
is part of the future-proofing of Grafana's code base and ecosystem. Starting in v6.0 **Panels** and **Data
|
||||
source** plugins can be written in React using our published `@grafana/ui` sdk library. More information on this
|
||||
will be shared soon.
|
||||
|
||||
{{< docs-imagebox img="/img/docs/v60/react_panels.png" max-width="600px" caption="React Panel" >}}
|
||||
<br />
|
||||
|
||||
## Google Stackdriver Datasource
|
||||
|
||||
Built-in support for [Google Stackdriver](https://cloud.google.com/stackdriver/) is officially released in Grafana 6.0. Beta support was added in Grafana 5.3 and we have added lots of improvements since then.
|
||||
|
||||
To get started read the guide: [Using Google Stackdriver in Grafana](/features/datasources/stackdriver/).
|
||||
|
||||
## Azure Monitor Datasource
|
||||
|
||||
One of the goals of the Grafana v6.0 release is to add support for the three major clouds. Amazon CloudWatch has been a core datasource for years and Google Stackdriver is also now supported. We developed an external plugin for Azure Monitor last year and for this release the [plugin](https://grafana.com/plugins/grafana-azure-monitor-datasource) is being moved into Grafana to be one of the built-in datasources. For users of the external plugin, Grafana will automatically start using the built-in version. As a core datasource, the Azure Monitor datasource is able to get alerting support, in the 6.0 release alerting is supported for the Azure Monitor service, with the rest to follow.
|
||||
|
||||
The Azure Monitor datasource integrates four Azure services with Grafana - Azure Monitor, Azure Log Analytics, Azure Application Insights and Azure Application Insights Analytics.
|
||||
|
||||
Please read [Using Azure Monitor in Grafana documentation](/features/datasources/azuremonitor/) for more detailed information on how to get started and use it.
|
||||
|
||||
## Provisioning support for alert notifiers
|
||||
|
||||
Grafana now has support for provisioning alert notifiers from configuration files, allowing operators to provision notifiers without using the UI or the API. A new field called `uid` has been introduced which is a string identifier that the administrator can set themselves. This is the same kind of identifier used for dashboards since v5.0. This feature makes it possible to use the same notifier configuration in multiple environments and refer to notifiers in dashboard json by a string identifier instead of the numeric id which depends on insert order and how many notifiers exist in the instance.
|
||||
|
||||
## Easier to deploy & improved security
|
||||
|
||||
Grafana 6.0 removes the need to configure and set up additional storage for [user sessions](/tutorials/ha_setup/#user-sessions). This should make it easier to deploy and operate Grafana in a
|
||||
high availability setup and/or if you're using a stateless user session store like Redis, Memcache, Postgres or MySQL.
|
||||
|
||||
Instead of user sessions, we've implemented a solution based on short-lived tokens that are rotated frequently. This also replaces the old "remember me cookie"
|
||||
solution, which allowed a user to be logged in between browser sessions and which have been subject to several security holes throughout the years.
|
||||
Read more about the short-lived token solution and how to configure it [here](/auth/overview/#login-and-short-lived-tokens).
|
||||
|
||||
> Please note that due to these changes, all users will be required to login upon next visit after upgrade.
|
||||
|
||||
Besides these changes we have also made security improvements regarding Cross-Site Request Forgery (CSRF) and Cross-site Scripting (XSS) vulnerabilities:
|
||||
|
||||
* Cookies are per default using the [SameSite](/installation/configuration/#cookie-samesite) attribute to protect against CSRF attacks
|
||||
* Script tags in text panels are per default [disabled](/installation/configuration/#disable-sanitize-html) to protect against XSS attacks
|
||||
|
||||
> If you're using [Auth Proxy Authentication](/auth/auth-proxy/) you still need to have user sessions set up and configured
|
||||
but our goal is to remove this requirement in the near future.
|
||||
|
||||
## Named Colors
|
||||
|
||||
{{< docs-imagebox img="/img/docs/v60/named_colors.png" max-width="400px" class="docs-image--right" caption="Named Colors" >}}
|
||||
|
||||
We have updated the color picker to show named colors and primary colors. We hope this will improve accessibility and
|
||||
helps making colors more consistent across dashboards. We hope to do more in this color picker in the future, like showing
|
||||
colors used in the dashboard.
|
||||
|
||||
Named colors also enables Grafana to adapt colors to the current theme.
|
||||
|
||||
<div class="clearfix"></div>
|
||||
|
||||
## Other features
|
||||
|
||||
- The ElasticSearch datasource now supports [bucket script pipeline aggregations](https://www.elastic.co/guide/en/elasticsearch/reference/current/search-aggregations-pipeline-bucket-script-aggregation.html). This gives the ability to do per-bucket computations like the difference or ratio between two metrics.
|
||||
- Support for Google Hangouts Chat alert notifications
|
||||
- New built in template variables for the current time range in `$__from` and `$__to`
|
||||
|
||||
## Upgrading
|
||||
|
||||
See [upgrade notes](/installation/upgrading/#upgrading-to-v6-0).
|
||||
|
||||
## Changelog
|
||||
|
||||
Checkout the [CHANGELOG.md](https://github.com/grafana/grafana/blob/master/CHANGELOG.md) file for a complete list of new features, changes, and bug fixes.
|
||||
@@ -285,7 +285,7 @@ Content-Type: application/json
|
||||
HTTP/1.1 200
|
||||
Content-Type: application/json
|
||||
|
||||
{"message": "User permissions updated"}
|
||||
{message: "User permissions updated"}
|
||||
```
|
||||
|
||||
## Delete global User
|
||||
@@ -308,7 +308,7 @@ Content-Type: application/json
|
||||
HTTP/1.1 200
|
||||
Content-Type: application/json
|
||||
|
||||
{"message": "User deleted"}
|
||||
{message: "User deleted"}
|
||||
```
|
||||
|
||||
## Pause all alerts
|
||||
@@ -319,7 +319,7 @@ Only works with Basic Authentication (username and password). See [introduction]
|
||||
|
||||
**Example Request**:
|
||||
|
||||
```http
|
||||
```json
|
||||
POST /api/admin/pause-all-alerts HTTP/1.1
|
||||
Accept: application/json
|
||||
Content-Type: application/json
|
||||
@@ -335,115 +335,9 @@ JSON Body schema:
|
||||
|
||||
**Example Response**:
|
||||
|
||||
|
||||
```json
|
||||
HTTP/1.1 200
|
||||
Content-Type: application/json
|
||||
|
||||
|
||||
`GET /api/admin/users/:id/auth-tokens`
|
||||
|
||||
Return a list of all auth tokens (devices) that the user currently have logged in from.
|
||||
|
||||
Only works with Basic Authentication (username and password). See [introduction](http://docs.grafana.org/http_api/admin/#admin-api) for an explanation.
|
||||
|
||||
**Example Request**:
|
||||
|
||||
```http
|
||||
GET /api/admin/users/1/auth-tokens HTTP/1.1
|
||||
Accept: application/json
|
||||
Content-Type: application/json
|
||||
```
|
||||
|
||||
**Example Response**:
|
||||
|
||||
```http
|
||||
HTTP/1.1 200
|
||||
Content-Type: application/json
|
||||
|
||||
```
|
||||
|
||||
## Revoke auth token for User
|
||||
|
||||
`POST /api/admin/users/:id/revoke-auth-token`
|
||||
|
||||
Revokes the given auth token (device) for the user. User of issued auth token (device) will no longer be logged in
|
||||
and will be required to authenticate again upon next activity.
|
||||
|
||||
Only works with Basic Authentication (username and password). See [introduction](http://docs.grafana.org/http_api/admin/#admin-api) for an explanation.
|
||||
|
||||
**Example Request**:
|
||||
|
||||
```http
|
||||
POST /api/admin/users/1/revoke-auth-token HTTP/1.1
|
||||
Accept: application/json
|
||||
Content-Type: application/json
|
||||
|
||||
```
|
||||
|
||||
**Example Response**:
|
||||
|
||||
```http
|
||||
HTTP/1.1 200
|
||||
Content-Type: application/json
|
||||
|
||||
```
|
||||
|
||||
## Logout User
|
||||
|
||||
`POST /api/admin/users/:id/logout`
|
||||
|
||||
Logout user revokes all auth tokens (devices) for the user. User of issued auth tokens (devices) will no longer be logged in
|
||||
and will be required to authenticate again upon next activity.
|
||||
|
||||
Only works with Basic Authentication (username and password). See [introduction](http://docs.grafana.org/http_api/admin/#admin-api) for an explanation.
|
||||
|
||||
**Example Request**:
|
||||
|
||||
```http
|
||||
POST /api/admin/users/1/logout HTTP/1.1
|
||||
Accept: application/json
|
||||
Content-Type: application/json
|
||||
```
|
||||
|
||||
**Example Response**:
|
||||
|
||||
```http
|
||||
HTTP/1.1 200
|
||||
Content-Type: application/json
|
||||
|
||||
```
|
||||
HTTP/1.1 200
|
||||
Content-Type: application/json
|
||||
|
||||
{
|
||||
"message": "User auth token revoked"
|
||||
}
|
||||
```
|
||||
|
||||
## Logout User
|
||||
|
||||
`POST /api/admin/users/:id/logout`
|
||||
|
||||
Logout user revokes all auth tokens (devices) for the user. User of issued auth tokens (devices) will no longer be logged in
|
||||
and will be required to authenticate again upon next activity.
|
||||
|
||||
Only works with Basic Authentication (username and password). See [introduction](http://docs.grafana.org/http_api/admin/#admin-api) for an explanation.
|
||||
|
||||
**Example Request**:
|
||||
|
||||
```http
|
||||
POST /api/admin/users/1/logout HTTP/1.1
|
||||
Accept: application/json
|
||||
Content-Type: application/json
|
||||
```
|
||||
|
||||
**Example Response**:
|
||||
|
||||
```http
|
||||
HTTP/1.1 200
|
||||
Content-Type: application/json
|
||||
|
||||
{
|
||||
"message": "User auth token revoked"
|
||||
}
|
||||
{state: "new state", message: "alerts pause/un paused", "alertsAffected": 100}
|
||||
```
|
||||
|
||||
@@ -1,7 +1,7 @@
|
||||
+++
|
||||
title = "Alerting HTTP API "
|
||||
description = "Grafana Alerts HTTP API"
|
||||
keywords = ["grafana", "http", "documentation", "api", "alerting", "alerts"]
|
||||
description = "Grafana Alerting HTTP API"
|
||||
keywords = ["grafana", "http", "documentation", "api", "alerting"]
|
||||
aliases = ["/http_api/alerting/"]
|
||||
type = "docs"
|
||||
[menu.docs]
|
||||
@@ -9,11 +9,14 @@ name = "Alerting"
|
||||
parent = "http_api"
|
||||
+++
|
||||
|
||||
|
||||
# Alerting API
|
||||
|
||||
You can use the Alerting API to get information about alerts and their states but this API cannot be used to modify the alert.
|
||||
To create new alerts or modify them you need to update the dashboard json that contains the alerts.
|
||||
|
||||
This API can also be used to create, update and delete alert notifications.
|
||||
|
||||
## Get alerts
|
||||
|
||||
`GET /api/alerts/`
|
||||
@@ -66,7 +69,7 @@ Content-Type: application/json
|
||||
**Example Response**:
|
||||
|
||||
```http
|
||||
HTTP/1.1 200
|
||||
HTTP/1.1 200
|
||||
Content-Type: application/json
|
||||
|
||||
```
|
||||
@@ -117,7 +120,7 @@ Content-Type: application/json
|
||||
Authorization: Bearer eyJrIjoiT0tTcG1pUlY2RnVKZTFVaDFsNFZXdE9ZWmNrMkZYbk
|
||||
|
||||
```
|
||||
## Pause alert by id
|
||||
|
||||
JSON Body Schema:
|
||||
|
||||
- **paused** – Can be `true` or `false`. True to pause an alert. False to unpause an alert.
|
||||
@@ -155,4 +158,184 @@ Content-Type: application/json
|
||||
## Create alert notification
|
||||
|
||||
You can find the full list of [supported notifiers](/alerting/notifications/#all-supported-notifier) at the alert notifiers page.
|
||||
See [Admin API]({{< relref "http_api/admin.md#pause-all-alerts" >}}).
|
||||
|
||||
`POST /api/alert-notifications`
|
||||
|
||||
**Example Request**:
|
||||
|
||||
```http
|
||||
POST /api/alert-notifications HTTP/1.1
|
||||
Accept: application/json
|
||||
Content-Type: application/json
|
||||
Authorization: Bearer eyJrIjoiT0tTcG1pUlY2RnVKZTFVaDFsNFZXdE9ZWmNrMkZYbk
|
||||
|
||||
```
|
||||
|
||||
**Example Response**:
|
||||
|
||||
```http
|
||||
HTTP/1.1 200
|
||||
Content-Type: application/json
|
||||
|
||||
```
|
||||
|
||||
## Update alert notification
|
||||
|
||||
`PUT /api/alert-notifications/1`
|
||||
|
||||
**Example Request**:
|
||||
|
||||
```http
|
||||
PUT /api/alert-notifications/1 HTTP/1.1
|
||||
Accept: application/json
|
||||
Content-Type: application/json
|
||||
Authorization: Bearer eyJrIjoiT0tTcG1pUlY2RnVKZTFVaDFsNFZXdE9ZWmNrMkZYbk
|
||||
|
||||
```
|
||||
|
||||
**Example Response**:
|
||||
|
||||
```http
|
||||
HTTP/1.1 200
|
||||
Content-Type: application/json
|
||||
|
||||
```
|
||||
|
||||
## Delete alert notification
|
||||
|
||||
`DELETE /api/alert-notifications/:notificationId`
|
||||
|
||||
**Example Request**:
|
||||
|
||||
```http
|
||||
DELETE /api/alert-notifications/1 HTTP/1.1
|
||||
Accept: application/json
|
||||
Content-Type: application/json
|
||||
Authorization: Bearer eyJrIjoiT0tTcG1pUlY2RnVKZTFVaDFsNFZXdE9ZWmNrMkZYbk
|
||||
```
|
||||
|
||||
**Example Response**:
|
||||
|
||||
```http
|
||||
HTTP/1.1 200
|
||||
Content-Type: application/json
|
||||
|
||||
```
|
||||
]
|
||||
|
||||
```
|
||||
|
||||
## Create alert notification
|
||||
|
||||
You can find the full list of [supported notifiers](/alerting/notifications/#all-supported-notifier) at the alert notifiers page.
|
||||
|
||||
`POST /api/alert-notifications`
|
||||
|
||||
**Example Request**:
|
||||
|
||||
```http
|
||||
POST /api/alert-notifications HTTP/1.1
|
||||
Accept: application/json
|
||||
Content-Type: application/json
|
||||
Authorization: Bearer eyJrIjoiT0tTcG1pUlY2RnVKZTFVaDFsNFZXdE9ZWmNrMkZYbk
|
||||
|
||||
{
|
||||
"name": "new alert notification", //Required
|
||||
"type": "email", //Required
|
||||
"isDefault": false,
|
||||
"sendReminder": false,
|
||||
"settings": {
|
||||
"addresses": "carl@grafana.com;dev@grafana.com"
|
||||
}
|
||||
}
|
||||
```
|
||||
|
||||
**Example Response**:
|
||||
|
||||
```http
|
||||
HTTP/1.1 200
|
||||
Content-Type: application/json
|
||||
|
||||
{
|
||||
"id": 1,
|
||||
"name": "new alert notification",
|
||||
"type": "email",
|
||||
"isDefault": false,
|
||||
"sendReminder": false,
|
||||
"settings": {
|
||||
"addresses": "carl@grafana.com;dev@grafana.com"
|
||||
},
|
||||
"created": "2018-04-23T14:44:09+02:00",
|
||||
"updated": "2018-08-20T15:47:49+02:00"
|
||||
}
|
||||
```
|
||||
|
||||
## Update alert notification
|
||||
|
||||
`PUT /api/alert-notifications/1`
|
||||
|
||||
**Example Request**:
|
||||
|
||||
```http
|
||||
PUT /api/alert-notifications/1 HTTP/1.1
|
||||
Accept: application/json
|
||||
Content-Type: application/json
|
||||
Authorization: Bearer eyJrIjoiT0tTcG1pUlY2RnVKZTFVaDFsNFZXdE9ZWmNrMkZYbk
|
||||
|
||||
{
|
||||
"id": 1,
|
||||
"name": "new alert notification", //Required
|
||||
"type": "email", //Required
|
||||
"isDefault": false,
|
||||
"sendReminder": true,
|
||||
"frequency": "15m",
|
||||
"settings": {
|
||||
"addresses": "carl@grafana.com;dev@grafana.com"
|
||||
}
|
||||
}
|
||||
```
|
||||
|
||||
**Example Response**:
|
||||
|
||||
```http
|
||||
HTTP/1.1 200
|
||||
Content-Type: application/json
|
||||
|
||||
{
|
||||
"id": 1,
|
||||
"name": "new alert notification",
|
||||
"type": "email",
|
||||
"isDefault": false,
|
||||
"sendReminder": true,
|
||||
"frequency": "15m",
|
||||
"settings": {
|
||||
"addresses": "carl@grafana.com;dev@grafana.com"
|
||||
},
|
||||
"created": "2017-01-01 12:34",
|
||||
"updated": "2017-01-01 12:34"
|
||||
}
|
||||
```
|
||||
|
||||
## Delete alert notification
|
||||
|
||||
`DELETE /api/alert-notifications/:notificationId`
|
||||
|
||||
**Example Request**:
|
||||
|
||||
```http
|
||||
DELETE /api/alert-notifications/1 HTTP/1.1
|
||||
Accept: application/json
|
||||
Content-Type: application/json
|
||||
Authorization: Bearer eyJrIjoiT0tTcG1pUlY2RnVKZTFVaDFsNFZXdE9ZWmNrMkZYbk
|
||||
```
|
||||
|
||||
**Example Response**:
|
||||
|
||||
```http
|
||||
HTTP/1.1 200
|
||||
Content-Type: application/json
|
||||
|
||||
{
|
||||
"message": "Notification deleted"
|
||||
}
|
||||
```
|
||||
|
||||
@@ -1,369 +0,0 @@
|
||||
+++
|
||||
title = "Alerting Notification Channels HTTP API "
|
||||
description = "Grafana Alerting Notification Channel HTTP API"
|
||||
keywords = ["grafana", "http", "documentation", "api", "alerting", "alerts", "notifications"]
|
||||
aliases = []
|
||||
type = "docs"
|
||||
[menu.docs]
|
||||
name = "Alerting Notification Channels"
|
||||
parent = "http_api"
|
||||
+++
|
||||
|
||||
# Alerting Notification Channels API
|
||||
|
||||
## Identifier (id) vs unique identifier (uid)
|
||||
|
||||
The identifier (id) of a notification channel is an auto-incrementing numeric value and is only unique per Grafana install.
|
||||
|
||||
The unique identifier (uid) of a notification channel can be used for uniquely identify a notification channel between
|
||||
multiple Grafana installs. It's automatically generated if not provided when creating a notification channel. The uid
|
||||
allows having consistent URL's for accessing notification channels and when syncing notification channels between multiple
|
||||
Grafana installs, see [alert notification channel provisioning](/administration/provisioning/#alert-notification-channels)
|
||||
for more information.
|
||||
|
||||
The uid can have a maximum length of 40 characters.
|
||||
|
||||
## Get all notification channels
|
||||
|
||||
Returns all notification channels that the authenticated user has permission to view.
|
||||
|
||||
`GET /api/alert-notifications`
|
||||
|
||||
**Example Request**:
|
||||
|
||||
```http
|
||||
GET /api/alert-notifications HTTP/1.1
|
||||
Accept: application/json
|
||||
Content-Type: application/json
|
||||
Authorization: Bearer eyJrIjoiT0tTcG1pUlY2RnVKZTFVaDFsNFZXdE9ZWmNrMkZYbk
|
||||
```
|
||||
|
||||
**Example Response**:
|
||||
|
||||
```http
|
||||
HTTP/1.1 200
|
||||
Content-Type: application/json
|
||||
|
||||
```
|
||||
|
||||
## Get notification channel by uid
|
||||
|
||||
`GET /api/alert-notifications/uid/:uid`
|
||||
|
||||
Will return the notification channel given the notification channel uid.
|
||||
|
||||
**Example Request**:
|
||||
|
||||
```http
|
||||
GET /api/alert-notifications/uid/team-a-email-notifier HTTP/1.1
|
||||
Accept: application/json
|
||||
Content-Type: application/json
|
||||
Authorization: Bearer eyJrIjoiT0tTcG1pUlY2RnVKZTFVaDFsNFZXdE9ZWmNrMkZYbk
|
||||
```
|
||||
|
||||
**Example Response**:
|
||||
|
||||
```http
|
||||
HTTP/1.1 200
|
||||
Content-Type: application/json
|
||||
|
||||
```
|
||||
|
||||
## Get notification channel by id
|
||||
|
||||
`GET /api/alert-notifications/:id`
|
||||
|
||||
Will return the notification channel given the notification channel id.
|
||||
|
||||
**Example Request**:
|
||||
|
||||
```http
|
||||
GET /api/alert-notifications/1 HTTP/1.1
|
||||
Accept: application/json
|
||||
Content-Type: application/json
|
||||
Authorization: Bearer eyJrIjoiT0tTcG1pUlY2RnVKZTFVaDFsNFZXdE9ZWmNrMkZYbk
|
||||
```
|
||||
|
||||
**Example Response**:
|
||||
|
||||
```http
|
||||
HTTP/1.1 200
|
||||
Content-Type: application/json
|
||||
|
||||
```
|
||||
|
||||
## Create notification channel
|
||||
|
||||
You can find the full list of [supported notifiers](/alerting/notifications/#all-supported-notifier) at the alert notifiers page.
|
||||
|
||||
`POST /api/alert-notifications`
|
||||
|
||||
**Example Request**:
|
||||
|
||||
```http
|
||||
POST /api/alert-notifications HTTP/1.1
|
||||
Accept: application/json
|
||||
Content-Type: application/json
|
||||
Authorization: Bearer eyJrIjoiT0tTcG1pUlY2RnVKZTFVaDFsNFZXdE9ZWmNrMkZYbk
|
||||
|
||||
```
|
||||
|
||||
**Example Response**:
|
||||
|
||||
```http
|
||||
HTTP/1.1 200
|
||||
Content-Type: application/json
|
||||
|
||||
```
|
||||
|
||||
## Update notification channel by uid
|
||||
|
||||
`PUT /api/alert-notifications/uid/:uid`
|
||||
|
||||
Updates an existing notification channel identified by uid.
|
||||
|
||||
**Example Request**:
|
||||
|
||||
```http
|
||||
PUT /api/alert-notifications/uid/cIBgcSjkk HTTP/1.1
|
||||
Accept: application/json
|
||||
Content-Type: application/json
|
||||
Authorization: Bearer eyJrIjoiT0tTcG1pUlY2RnVKZTFVaDFsNFZXdE9ZWmNrMkZYbk
|
||||
|
||||
```
|
||||
|
||||
**Example Response**:
|
||||
|
||||
```http
|
||||
HTTP/1.1 200
|
||||
Content-Type: application/json
|
||||
|
||||
```
|
||||
|
||||
## Update notification channel by id
|
||||
|
||||
`PUT /api/alert-notifications/:id`
|
||||
|
||||
Updates an existing notification channel identified by id.
|
||||
|
||||
**Example Request**:
|
||||
|
||||
```http
|
||||
PUT /api/alert-notifications/1 HTTP/1.1
|
||||
Accept: application/json
|
||||
Content-Type: application/json
|
||||
Authorization: Bearer eyJrIjoiT0tTcG1pUlY2RnVKZTFVaDFsNFZXdE9ZWmNrMkZYbk
|
||||
|
||||
```
|
||||
|
||||
**Example Response**:
|
||||
|
||||
```http
|
||||
HTTP/1.1 200
|
||||
Content-Type: application/json
|
||||
|
||||
```
|
||||
|
||||
## Delete alert notification by uid
|
||||
|
||||
`DELETE /api/alert-notifications/uid/:uid`
|
||||
|
||||
Deletes an existing notification channel identified by uid.
|
||||
|
||||
**Example Request**:
|
||||
|
||||
```http
|
||||
DELETE /api/alert-notifications/uid/team-a-email-notifier HTTP/1.1
|
||||
Accept: application/json
|
||||
Content-Type: application/json
|
||||
Authorization: Bearer eyJrIjoiT0tTcG1pUlY2RnVKZTFVaDFsNFZXdE9ZWmNrMkZYbk
|
||||
```
|
||||
|
||||
**Example Response**:
|
||||
|
||||
```http
|
||||
HTTP/1.1 200
|
||||
Content-Type: application/json
|
||||
|
||||
```
|
||||
|
||||
## Delete alert notification by id
|
||||
|
||||
`DELETE /api/alert-notifications/:id`
|
||||
|
||||
Deletes an existing notification channel identified by id.
|
||||
|
||||
**Example Request**:
|
||||
|
||||
```http
|
||||
DELETE /api/alert-notifications/1 HTTP/1.1
|
||||
Accept: application/json
|
||||
Content-Type: application/json
|
||||
Authorization: Bearer eyJrIjoiT0tTcG1pUlY2RnVKZTFVaDFsNFZXdE9ZWmNrMkZYbk
|
||||
```
|
||||
|
||||
**Example Response**:
|
||||
|
||||
```http
|
||||
HTTP/1.1 200
|
||||
Content-Type: application/json
|
||||
|
||||
```
|
||||
|
||||
## Test notification channel
|
||||
|
||||
Sends a test notification message for the given notification channel type and settings.
|
||||
You can find the full list of [supported notifiers](/alerting/notifications/#all-supported-notifier) at the alert notifiers page.
|
||||
|
||||
`POST /api/alert-notifications/test`
|
||||
|
||||
**Example Request**:
|
||||
|
||||
```http
|
||||
POST /api/alert-notifications/test HTTP/1.1
|
||||
Accept: application/json
|
||||
Content-Type: application/json
|
||||
Authorization: Bearer eyJrIjoiT0tTcG1pUlY2RnVKZTFVaDFsNFZXdE9ZWmNrMkZYbk
|
||||
|
||||
```
|
||||
|
||||
**Example Response**:
|
||||
|
||||
```http
|
||||
HTTP/1.1 200
|
||||
Content-Type: application/json
|
||||
|
||||
```
|
||||
|
||||
Updates an existing notification channel identified by id.
|
||||
|
||||
**Example Request**:
|
||||
|
||||
```http
|
||||
PUT /api/alert-notifications/1 HTTP/1.1
|
||||
Accept: application/json
|
||||
Content-Type: application/json
|
||||
Authorization: Bearer eyJrIjoiT0tTcG1pUlY2RnVKZTFVaDFsNFZXdE9ZWmNrMkZYbk
|
||||
|
||||
{
|
||||
"id": 1,
|
||||
"uid": "cIBgcSjkk",
|
||||
"name": "new alert notification", //Required
|
||||
"type": "email", //Required
|
||||
"isDefault": false,
|
||||
"sendReminder": true,
|
||||
"frequency": "15m",
|
||||
"settings": {
|
||||
"addresses": "carl@grafana.com;dev@grafana.com"
|
||||
}
|
||||
}
|
||||
```
|
||||
|
||||
**Example Response**:
|
||||
|
||||
```http
|
||||
HTTP/1.1 200
|
||||
Content-Type: application/json
|
||||
|
||||
{
|
||||
"id": 1,
|
||||
"uid": "cIBgcSjkk",
|
||||
"name": "new alert notification",
|
||||
"type": "email",
|
||||
"isDefault": false,
|
||||
"sendReminder": true,
|
||||
"frequency": "15m",
|
||||
"settings": {
|
||||
"addresses": "carl@grafana.com;dev@grafana.com"
|
||||
},
|
||||
"created": "2017-01-01 12:34",
|
||||
"updated": "2017-01-01 12:34"
|
||||
}
|
||||
```
|
||||
|
||||
## Delete alert notification by uid
|
||||
|
||||
`DELETE /api/alert-notifications/uid/:uid`
|
||||
|
||||
Deletes an existing notification channel identified by uid.
|
||||
|
||||
**Example Request**:
|
||||
|
||||
```http
|
||||
DELETE /api/alert-notifications/uid/team-a-email-notifier HTTP/1.1
|
||||
Accept: application/json
|
||||
Content-Type: application/json
|
||||
Authorization: Bearer eyJrIjoiT0tTcG1pUlY2RnVKZTFVaDFsNFZXdE9ZWmNrMkZYbk
|
||||
```
|
||||
|
||||
**Example Response**:
|
||||
|
||||
```http
|
||||
HTTP/1.1 200
|
||||
Content-Type: application/json
|
||||
|
||||
{
|
||||
"message": "Notification deleted"
|
||||
}
|
||||
```
|
||||
|
||||
## Delete alert notification by id
|
||||
|
||||
`DELETE /api/alert-notifications/:id`
|
||||
|
||||
Deletes an existing notification channel identified by id.
|
||||
|
||||
**Example Request**:
|
||||
|
||||
```http
|
||||
DELETE /api/alert-notifications/1 HTTP/1.1
|
||||
Accept: application/json
|
||||
Content-Type: application/json
|
||||
Authorization: Bearer eyJrIjoiT0tTcG1pUlY2RnVKZTFVaDFsNFZXdE9ZWmNrMkZYbk
|
||||
```
|
||||
|
||||
**Example Response**:
|
||||
|
||||
```http
|
||||
HTTP/1.1 200
|
||||
Content-Type: application/json
|
||||
|
||||
{
|
||||
"message": "Notification deleted"
|
||||
}
|
||||
```
|
||||
|
||||
## Test notification channel
|
||||
|
||||
Sends a test notification message for the given notification channel type and settings.
|
||||
You can find the full list of [supported notifiers](/alerting/notifications/#all-supported-notifier) at the alert notifiers page.
|
||||
|
||||
`POST /api/alert-notifications/test`
|
||||
|
||||
**Example Request**:
|
||||
|
||||
```http
|
||||
POST /api/alert-notifications/test HTTP/1.1
|
||||
Accept: application/json
|
||||
Content-Type: application/json
|
||||
Authorization: Bearer eyJrIjoiT0tTcG1pUlY2RnVKZTFVaDFsNFZXdE9ZWmNrMkZYbk
|
||||
|
||||
{
|
||||
"type": "email",
|
||||
"settings": {
|
||||
"addresses": "carl@grafana.com;dev@grafana.com"
|
||||
}
|
||||
}
|
||||
```
|
||||
|
||||
**Example Response**:
|
||||
|
||||
```http
|
||||
HTTP/1.1 200
|
||||
Content-Type: application/json
|
||||
|
||||
{
|
||||
"message": "Test notification sent"
|
||||
}
|
||||
```
|
||||
|
||||
@@ -97,7 +97,7 @@ Creates an annotation in the Grafana database. The `dashboardId` and `panelId` f
|
||||
```json
|
||||
POST /api/annotations/graphite HTTP/1.1
|
||||
Accept: application/json
|
||||
`PUT /api/annotations/:id`
|
||||
Content-Type: application/json
|
||||
|
||||
{
|
||||
"what": "Event - deploy",
|
||||
@@ -115,7 +115,7 @@ Content-Type: application/json
|
||||
|
||||
{
|
||||
"message":"Graphite annotation added",
|
||||
Content-Type: application/json
|
||||
"id": 1
|
||||
}
|
||||
```
|
||||
|
||||
@@ -135,7 +135,7 @@ format (string with multiple tags being separated by a space).
|
||||
"isRegion":true,
|
||||
"timeEnd":1507180805056,
|
||||
"text":"Annotation Description",
|
||||
```
|
||||
"tags":["tag3","tag4","tag5"]
|
||||
}
|
||||
```
|
||||
|
||||
@@ -150,7 +150,7 @@ Content-Type: application/json
|
||||
```http
|
||||
DELETE /api/annotations/1 HTTP/1.1
|
||||
Accept: application/json
|
||||
|
||||
Content-Type: application/json
|
||||
Authorization: Bearer eyJrIjoiT0tTcG1pUlY2RnVKZTFVaDFsNFZXdE9ZWmNrMkZYbk
|
||||
```
|
||||
|
||||
@@ -164,14 +164,11 @@ Content-Type: application/json
|
||||
|
||||
## Delete Annotation By RegionId
|
||||
|
||||
Content-Type: application/json
|
||||
|
||||
`DELETE /api/annotations/region/:id`
|
||||
|
||||
## Delete Annotation By RegionId
|
||||
Deletes the annotation that matches the specified region id. A region is an annotation that covers a timerange and has a start and end time. In the Grafana database, this is a stored as two annotations connected by a region id.
|
||||
|
||||
**Example Request**:
|
||||
|
||||
|
||||
```http
|
||||
DELETE /api/annotations/region/1 HTTP/1.1
|
||||
@@ -183,50 +180,6 @@ Content-Type: application/json
|
||||
**Example Response**:
|
||||
|
||||
```http
|
||||
**Example Response**:
|
||||
|
||||
```http
|
||||
HTTP/1.1 200
|
||||
Content-Type: application/json
|
||||
|
||||
```
|
||||
"message":"Annotation updated"
|
||||
}
|
||||
```
|
||||
|
||||
## Patch Annotation
|
||||
|
||||
`PATCH /api/annotations/:id`
|
||||
|
||||
Updates one or more properties of an annotation that matches the specified id.
|
||||
|
||||
This operation currently supports updating of the `text`, `tags`, `time` and `timeEnd` properties. It does not handle updating of the `isRegion` and `regionId` properties. To make an annotation regional or vice versa, consider using the [Update Annotation](#update-annotation) operation.
|
||||
|
||||
**Example Request**:
|
||||
|
||||
```http
|
||||
PATCH /api/annotations/1145 HTTP/1.1
|
||||
Accept: application/json
|
||||
Authorization: Bearer eyJrIjoiT0tTcG1pUlY2RnVKZTFVaDFsNFZXdE9ZWmNrMkZYbk
|
||||
Content-Type: application/json
|
||||
|
||||
{
|
||||
"text":"New Annotation Description",
|
||||
"tags":["tag6","tag7","tag8"]
|
||||
}
|
||||
```
|
||||
|
||||
**Example Response**:
|
||||
|
||||
```http
|
||||
HTTP/1.1 200
|
||||
Content-Type: application/json
|
||||
|
||||
{
|
||||
"message":"Annotation patched"
|
||||
}
|
||||
```
|
||||
|
||||
HTTP/1.1 200
|
||||
Content-Type: application/json
|
||||
|
||||
@@ -248,9 +201,7 @@ Authorization: Bearer eyJrIjoiT0tTcG1pUlY2RnVKZTFVaDFsNFZXdE9ZWmNrMkZYbk
|
||||
HTTP/1.1 200
|
||||
Content-Type: application/json
|
||||
|
||||
{
|
||||
"message":"Annotation deleted"
|
||||
}
|
||||
{"message":"Annotation deleted"}
|
||||
```
|
||||
|
||||
## Delete Annotation By RegionId
|
||||
@@ -274,7 +225,5 @@ Authorization: Bearer eyJrIjoiT0tTcG1pUlY2RnVKZTFVaDFsNFZXdE9ZWmNrMkZYbk
|
||||
HTTP/1.1 200
|
||||
Content-Type: application/json
|
||||
|
||||
{
|
||||
"message":"Annotation region deleted"
|
||||
}
|
||||
{"message":"Annotation region deleted"}
|
||||
```
|
||||
|
||||
@@ -188,8 +188,8 @@ Authorization: Bearer eyJrIjoiT0tTcG1pUlY2RnVKZTFVaDFsNFZXdE9ZWmNrMkZYbk
|
||||
|
||||
```http
|
||||
HTTP/1.1 200
|
||||
Content-Type: application/json
|
||||
|
||||
Content-Type: application/json
|
||||
|
||||
```
|
||||
|
||||
## Data source proxy calls
|
||||
|
||||
@@ -105,7 +105,7 @@ POST /api/folders/nErXDvCkzz/permissions
|
||||
- **200** - Ok
|
||||
- **401** - Unauthorized
|
||||
- **403** - Access denied
|
||||
- **404** - Dashboard not found
|
||||
- **404** - Dashboard not found
|
||||
"items": [
|
||||
{
|
||||
"role": "Viewer",
|
||||
|
||||
Some files were not shown because too many files have changed in this diff Show More
Reference in New Issue
Block a user