mirror of
https://github.com/grafana/grafana.git
synced 2026-01-07 22:41:10 +08:00
Compare commits
500 Commits
v6.2.1
...
v6.3.0-bet
| Author | SHA1 | Date | |
|---|---|---|---|
|
|
57a57932af | ||
|
|
62a226b1c3 | ||
|
|
a38dcc3ac7 | ||
|
|
c39b0e246b | ||
|
|
f8f1f506ed | ||
|
|
9d57a1f192 | ||
|
|
ba4a870632 | ||
|
|
ef9ec32c32 | ||
|
|
17235e4bd1 | ||
|
|
eb82b77782 | ||
|
|
3af8aa5c4f | ||
|
|
5b588af73c | ||
|
|
5ec6eccfac | ||
|
|
237e0e8631 | ||
|
|
7a165febf3 | ||
|
|
fd7c38c62f | ||
|
|
00519f1105 | ||
|
|
c8740d98b0 | ||
|
|
54030deaf6 | ||
|
|
880f6b63a1 | ||
|
|
d8ddfa5622 | ||
|
|
9af2ea1b53 | ||
|
|
d98ee66bd8 | ||
|
|
d3ecc963e6 | ||
|
|
0961ec9748 | ||
|
|
a2c7570c5c | ||
|
|
9cbe0abb44 | ||
|
|
2fecdaf6b4 | ||
|
|
a5f360e50e | ||
|
|
99f2386bd9 | ||
|
|
bffa956068 | ||
|
|
1b7a54c084 | ||
|
|
8128eb6c77 | ||
|
|
10c4d6eccc | ||
|
|
8a062dde35 | ||
|
|
041c1c3cb1 | ||
|
|
aba6df2e09 | ||
|
|
5192504748 | ||
|
|
8a0e2ac3a4 | ||
|
|
373d082363 | ||
|
|
94765294a2 | ||
|
|
1f482a5f0b | ||
|
|
ae04813045 | ||
|
|
3d7c52dcd1 | ||
|
|
81f8158010 | ||
|
|
5de014a91d | ||
|
|
777311a759 | ||
|
|
829b5d0d40 | ||
|
|
12878409db | ||
|
|
ffa9429c68 | ||
|
|
6649c5d75b | ||
|
|
d6e8129588 | ||
|
|
6a3a2f5f94 | ||
|
|
5d3a60d46e | ||
|
|
5f0a7f43c3 | ||
|
|
ebff883016 | ||
|
|
81ff856568 | ||
|
|
648aa62264 | ||
|
|
c32365f424 | ||
|
|
6599bdc7f1 | ||
|
|
b44be990bc | ||
|
|
9e87dbb153 | ||
|
|
25506829be | ||
|
|
d918d1f5f4 | ||
|
|
332920954e | ||
|
|
78ca55f3d7 | ||
|
|
66a4d1a57e | ||
|
|
ccc3d88cee | ||
|
|
98ba3f34a6 | ||
|
|
c284a11a95 | ||
|
|
246358344c | ||
|
|
8f5df80161 | ||
|
|
962d4daabd | ||
|
|
bdaf0aa81a | ||
|
|
fcdc29746f | ||
|
|
3f15170914 | ||
|
|
baed5d7bd9 | ||
|
|
83366b91de | ||
|
|
8219fdf7c0 | ||
|
|
e2cf7c9698 | ||
|
|
88a2c6fce7 | ||
|
|
9b468caea4 | ||
|
|
b67905a963 | ||
|
|
e574147b1e | ||
|
|
c5b6365858 | ||
|
|
17b5f48cf6 | ||
|
|
e6b8a1529b | ||
|
|
48d5a1bcd3 | ||
|
|
b1a0bd115c | ||
|
|
315177fad7 | ||
|
|
d1588ec455 | ||
|
|
b2aa236bdf | ||
|
|
418dba4b21 | ||
|
|
de71875e6b | ||
|
|
7e95ded164 | ||
|
|
55b63905ea | ||
|
|
d4e9a8c009 | ||
|
|
57c220c93d | ||
|
|
3a18098760 | ||
|
|
cf37b5439f | ||
|
|
19ae5351fb | ||
|
|
9f351156c3 | ||
|
|
164fb13d99 | ||
|
|
22e2ac270b | ||
|
|
874b8abcc0 | ||
|
|
b1126cb0ed | ||
|
|
98147fd52b | ||
|
|
444c4d5999 | ||
|
|
2596974cd2 | ||
|
|
3d848d0fdf | ||
|
|
0d2be0a7ed | ||
|
|
1c291e26f8 | ||
|
|
b06ad02a74 | ||
|
|
2ae6adef26 | ||
|
|
498572d2d8 | ||
|
|
a2c1462675 | ||
|
|
3aed4d3613 | ||
|
|
9620ac4b92 | ||
|
|
caa1314f44 | ||
|
|
364f1f2e55 | ||
|
|
0a1bb97a2f | ||
|
|
8f150c67aa | ||
|
|
d71043609e | ||
|
|
e7c3d0ed97 | ||
|
|
c9f4cf8b53 | ||
|
|
ca136c7c22 | ||
|
|
5836427794 | ||
|
|
f3f03ceb6a | ||
|
|
c2affdee1e | ||
|
|
4e27ba9646 | ||
|
|
bd4a7ddf3a | ||
|
|
d94bdb930f | ||
|
|
0833f26b43 | ||
|
|
53db823511 | ||
|
|
c392a492ae | ||
|
|
d9fea07e6e | ||
|
|
70d4dfe9f7 | ||
|
|
742e0d56eb | ||
|
|
ead4b1f5c7 | ||
|
|
2379de53c4 | ||
|
|
0b9de3f761 | ||
|
|
8fcc370fe9 | ||
|
|
3045daedbd | ||
|
|
013a1abb6f | ||
|
|
5f3a71bc7a | ||
|
|
021f5351fa | ||
|
|
0a3f977ea2 | ||
|
|
3af7eeb331 | ||
|
|
f53f0c8063 | ||
|
|
8493965d31 | ||
|
|
7cac7435ce | ||
|
|
8541214c9e | ||
|
|
6fb36e705f | ||
|
|
40e5c4f8ba | ||
|
|
7acbb94bb8 | ||
|
|
dc9ec7dc91 | ||
|
|
19185bd0af | ||
|
|
654f1f2eb6 | ||
|
|
5aa13eeb76 | ||
|
|
b9fda28e27 | ||
|
|
4f1d495ba1 | ||
|
|
77375f3772 | ||
|
|
dad894f1cc | ||
|
|
40708bef10 | ||
|
|
2c5400c61e | ||
|
|
6be1606bd8 | ||
|
|
0904607eda | ||
|
|
e83953f24e | ||
|
|
31d2905490 | ||
|
|
335cec07a5 | ||
|
|
cbe057fce8 | ||
|
|
48570c4286 | ||
|
|
1b17b7893f | ||
|
|
75c29566a6 | ||
|
|
5713048f48 | ||
|
|
eecd8d1064 | ||
|
|
2fb45eeec8 | ||
|
|
e7e9d3619e | ||
|
|
4c97d26102 | ||
|
|
c41eba92fe | ||
|
|
bc94f85dee | ||
|
|
0412a28d2e | ||
|
|
0adbb001db | ||
|
|
d0852f0618 | ||
|
|
4ddeb94f52 | ||
|
|
dda8b731e8 | ||
|
|
70b4fc8483 | ||
|
|
0a74a3329c | ||
|
|
ec3b91e6b2 | ||
|
|
219d711597 | ||
|
|
49f0f0e89e | ||
|
|
57dadebbd8 | ||
|
|
6fd4aa4b46 | ||
|
|
428134482d | ||
|
|
c9ad411d8e | ||
|
|
433e5ac049 | ||
|
|
1c08e58605 | ||
|
|
17826796da | ||
|
|
7eb820081d | ||
|
|
35e1524b02 | ||
|
|
bd08d8ce8e | ||
|
|
401615847c | ||
|
|
efdfb1fce3 | ||
|
|
c784dadafe | ||
|
|
b6350fe6fb | ||
|
|
eca706f7c4 | ||
|
|
477d5643b6 | ||
|
|
12e417f2df | ||
|
|
8b8f2c4540 | ||
|
|
c75d026186 | ||
|
|
7d68d6ede2 | ||
|
|
3424b64299 | ||
|
|
d6ee96ee64 | ||
|
|
4c4c689907 | ||
|
|
b98bb48d59 | ||
|
|
b950eebf99 | ||
|
|
ed613194ac | ||
|
|
64841fe417 | ||
|
|
3563f71ba2 | ||
|
|
6de75de755 | ||
|
|
8192fa538e | ||
|
|
6fbca90269 | ||
|
|
aa1f9cdd40 | ||
|
|
8ffef57178 | ||
|
|
2f00087a08 | ||
|
|
f9b691bd54 | ||
|
|
c853ef7318 | ||
|
|
51c6b50582 | ||
|
|
37e9988e95 | ||
|
|
97f7c92455 | ||
|
|
2c5c333858 | ||
|
|
375dc333f2 | ||
|
|
74829f4898 | ||
|
|
1b1d951495 | ||
|
|
c78b6e2a67 | ||
|
|
a2370a379d | ||
|
|
7b70e7db2d | ||
|
|
e11edf3fc2 | ||
|
|
c59f308414 | ||
|
|
fabc6f4241 | ||
|
|
9e9fdb9cf1 | ||
|
|
d612beec25 | ||
|
|
e1df51109e | ||
|
|
073851f9c7 | ||
|
|
6170a039e5 | ||
|
|
6809d2bb29 | ||
|
|
df917663e6 | ||
|
|
8e1dfd32f9 | ||
|
|
d168057fc6 | ||
|
|
f41a6c8962 | ||
|
|
0a3af385e1 | ||
|
|
2a47c315df | ||
|
|
151fe240fc | ||
|
|
599514ad68 | ||
|
|
41fb38d522 | ||
|
|
3da8cff6e9 | ||
|
|
ab4e1526b3 | ||
|
|
39e23ba672 | ||
|
|
3e64214338 | ||
|
|
fcd2fb8b04 | ||
|
|
40f95a95c0 | ||
|
|
a20309d7d2 | ||
|
|
20f81539b8 | ||
|
|
756989c10b | ||
|
|
4121b5da6b | ||
|
|
c09fe3c3b4 | ||
|
|
826d33ea37 | ||
|
|
591ea0bfe3 | ||
|
|
a95c7bfa6f | ||
|
|
6a76a92aff | ||
|
|
4ddb860727 | ||
|
|
912df2e284 | ||
|
|
bc7c420ee8 | ||
|
|
2316414786 | ||
|
|
b17967e001 | ||
|
|
1aadb4426a | ||
|
|
c31b939e10 | ||
|
|
e06abb30aa | ||
|
|
34f314552d | ||
|
|
ad3f9c6663 | ||
|
|
606825703f | ||
|
|
0fa60a8450 | ||
|
|
ad744beb60 | ||
|
|
dd52ff5ac5 | ||
|
|
de7856cf93 | ||
|
|
02975256d1 | ||
|
|
1c3ad78672 | ||
|
|
8a602e86f3 | ||
|
|
a9da7b5f1f | ||
|
|
c8382ba435 | ||
|
|
87760d4fde | ||
|
|
574a37e46f | ||
|
|
10a4a89902 | ||
|
|
8ef961bba5 | ||
|
|
d1ab29c36d | ||
|
|
1e76f1a728 | ||
|
|
4066c55298 | ||
|
|
f43af0e644 | ||
|
|
96ba32d0c8 | ||
|
|
b7a9533476 | ||
|
|
fbf37eb402 | ||
|
|
fb39831df2 | ||
|
|
5761179ad9 | ||
|
|
20229a40eb | ||
|
|
4fe6eaa0f7 | ||
|
|
95012271ac | ||
|
|
936308366e | ||
|
|
76e5657b47 | ||
|
|
d8736a2547 | ||
|
|
60ddad8fdb | ||
|
|
1497f3d79a | ||
|
|
a0bb01103e | ||
|
|
5e7537878e | ||
|
|
a3092dc57b | ||
|
|
d4ef19737e | ||
|
|
e951e71843 | ||
|
|
0a92de623d | ||
|
|
fd741cbea4 | ||
|
|
afbdfe7cb4 | ||
|
|
5fa5d4bdd5 | ||
|
|
a1a498f96c | ||
|
|
9ff44b5037 | ||
|
|
1e508d7288 | ||
|
|
2dc660d533 | ||
|
|
27874a1881 | ||
|
|
382ebd6362 | ||
|
|
4b0ad174ff | ||
|
|
83af1bdff3 | ||
|
|
83187fd8ea | ||
|
|
a07296bf24 | ||
|
|
04d473b3e5 | ||
|
|
b547a0cb34 | ||
|
|
0b3768e551 | ||
|
|
4965e10db1 | ||
|
|
2146f837cf | ||
|
|
db32c7dcf5 | ||
|
|
5358c5fe6b | ||
|
|
3dda812f12 | ||
|
|
151b24b95f | ||
|
|
b9181df212 | ||
|
|
1a2841e244 | ||
|
|
de92c360a1 | ||
|
|
5884e235fc | ||
|
|
df6a4914c4 | ||
|
|
07d37b4a92 | ||
|
|
baa55ab6ae | ||
|
|
bc3a718107 | ||
|
|
2a52dbfb74 | ||
|
|
6acc7d37da | ||
|
|
a7aaed49b5 | ||
|
|
b0ea3a8c88 | ||
|
|
0d6c9d371f | ||
|
|
a3a7916597 | ||
|
|
c87b2c9913 | ||
|
|
8e434ad163 | ||
|
|
a04bf0cded | ||
|
|
972df40af8 | ||
|
|
9e7fa74682 | ||
|
|
ca6151e23f | ||
|
|
a9c94ec93b | ||
|
|
8749574975 | ||
|
|
9b7f9dd9be | ||
|
|
87688930a2 | ||
|
|
e9130210cc | ||
|
|
c31aaa1a25 | ||
|
|
23a941e880 | ||
|
|
7df4d635e3 | ||
|
|
350190e669 | ||
|
|
e421723992 | ||
|
|
577beebcca | ||
|
|
a96b522a42 | ||
|
|
cd9517c58b | ||
|
|
3ff3e0f2ac | ||
|
|
9cdf0f4f9c | ||
|
|
2d03815770 | ||
|
|
8d1909c56d | ||
|
|
1033f0f905 | ||
|
|
73e4178aef | ||
|
|
874039992f | ||
|
|
fa9ffe38d2 | ||
|
|
744682e648 | ||
|
|
f98095d629 | ||
|
|
5414a31101 | ||
|
|
3b35e9d5e8 | ||
|
|
3b008d06b4 | ||
|
|
c82df97bb2 | ||
|
|
b695dcd0eb | ||
|
|
66ba2aa524 | ||
|
|
7e3ac4ebde | ||
|
|
458bb3b0e3 | ||
|
|
bfa7c3d963 | ||
|
|
a0f5923b95 | ||
|
|
db48ec1f08 | ||
|
|
bd5bcea5d0 | ||
|
|
a564a54b13 | ||
|
|
058f5a1682 | ||
|
|
0e210dc271 | ||
|
|
2b32e768bd | ||
|
|
12e0616413 | ||
|
|
ae1df1cf89 | ||
|
|
0d34dfc775 | ||
|
|
35f227de11 | ||
|
|
1a80885180 | ||
|
|
32cdab4cbf | ||
|
|
756da8a134 | ||
|
|
0a9863a8b4 | ||
|
|
9bf577d125 | ||
|
|
73e405978b | ||
|
|
3dbc3251d1 | ||
|
|
2904e2d9fe | ||
|
|
8196642f25 | ||
|
|
b11eeadbd9 | ||
|
|
e6001f57a2 | ||
|
|
be66ed9dab | ||
|
|
8483a8366f | ||
|
|
f30e5cce59 | ||
|
|
b8e67a2a4c | ||
|
|
c55e6016bf | ||
|
|
fdd421e24c | ||
|
|
aed3d0d3ad | ||
|
|
d0ea98f6bd | ||
|
|
d8280b895d | ||
|
|
238a929262 | ||
|
|
a0b6ef4d01 | ||
|
|
7333f7ca17 | ||
|
|
68ad93f410 | ||
|
|
3df94c6f27 | ||
|
|
6c7224c74d | ||
|
|
74a31bd9b4 | ||
|
|
4bc1a66fe4 | ||
|
|
fd10aa902d | ||
|
|
ceb21bd653 | ||
|
|
51c99fc68d | ||
|
|
79ac3fd699 | ||
|
|
34f9b3ff2b | ||
|
|
13f137a17d | ||
|
|
a87a763d83 | ||
|
|
1001cd7ac3 | ||
|
|
bbb1427f46 | ||
|
|
01a7c1f098 | ||
|
|
3ce2f3b58d | ||
|
|
719c1c277f | ||
|
|
29ad72f048 | ||
|
|
597c380ead | ||
|
|
db95414d02 | ||
|
|
927e1cbd27 | ||
|
|
bf5b60f74a | ||
|
|
e0b760e08e | ||
|
|
2fff8f77dc | ||
|
|
0efb8821f9 | ||
|
|
ce38de4ad7 | ||
|
|
aa400d54e1 | ||
|
|
f12d47ef52 | ||
|
|
813e3ffc15 | ||
|
|
cf39a264ca | ||
|
|
37011dd8f3 | ||
|
|
e7930a27b5 | ||
|
|
6dbaa704bc | ||
|
|
8eb78ea931 | ||
|
|
d5a35f3631 | ||
|
|
675d43c753 | ||
|
|
1d7bb2a763 | ||
|
|
5573d28582 | ||
|
|
5e44f001fb | ||
|
|
34f6dda6e6 | ||
|
|
f617cd8975 | ||
|
|
56702902a1 | ||
|
|
4a9aff0b00 | ||
|
|
3c733638ee | ||
|
|
30bf9bf00f | ||
|
|
d4a35213e1 | ||
|
|
edcbc11774 | ||
|
|
0c1530c7a8 | ||
|
|
10098082b5 | ||
|
|
f0109be2bc | ||
|
|
a04b3a13e0 | ||
|
|
2abb009d68 | ||
|
|
7ebbeb09cb | ||
|
|
7b92c56055 | ||
|
|
e1d408a66f | ||
|
|
99c754c4a5 | ||
|
|
568d7373f7 | ||
|
|
1ef15283a4 | ||
|
|
a9e01d8b04 | ||
|
|
f58ab7945b | ||
|
|
e97853abc9 | ||
|
|
a4d287d2e1 | ||
|
|
ceb9f0855b | ||
|
|
e7a9afe983 | ||
|
|
4762cd671a | ||
|
|
a86b8c8a04 | ||
|
|
b426ff5292 | ||
|
|
17ce1273ca | ||
|
|
1d8786e3a6 | ||
|
|
b08cf1e7ac | ||
|
|
b24358aaba | ||
|
|
b07d0b1026 | ||
|
|
336655a46a | ||
|
|
08cdeb0eb1 | ||
|
|
b1fb113648 |
@@ -1,6 +1,7 @@
|
||||
[run]
|
||||
init_cmds = [
|
||||
["go", "run", "build.go", "-dev", "build-server"],
|
||||
["go", "run", "build.go", "-dev", "build-cli"],
|
||||
["go", "run", "build.go", "-dev", "build-server"],
|
||||
["./bin/grafana-server", "-packaging=dev", "cfg:app_mode=development"]
|
||||
]
|
||||
watch_all = true
|
||||
|
||||
@@ -19,7 +19,7 @@ version: 2
|
||||
jobs:
|
||||
mysql-integration-test:
|
||||
docker:
|
||||
- image: circleci/golang:1.12.4
|
||||
- image: circleci/golang:1.12.6
|
||||
- image: circleci/mysql:5.6-ram
|
||||
environment:
|
||||
MYSQL_ROOT_PASSWORD: rootpass
|
||||
@@ -39,7 +39,7 @@ jobs:
|
||||
|
||||
postgres-integration-test:
|
||||
docker:
|
||||
- image: circleci/golang:1.12.4
|
||||
- image: circleci/golang:1.12.6
|
||||
- image: circleci/postgres:9.3-ram
|
||||
environment:
|
||||
POSTGRES_USER: grafanatest
|
||||
@@ -58,7 +58,7 @@ jobs:
|
||||
|
||||
cache-server-test:
|
||||
docker:
|
||||
- image: circleci/golang:1.12.4
|
||||
- image: circleci/golang:1.12.6
|
||||
- image: circleci/redis:4-alpine
|
||||
- image: memcached
|
||||
working_directory: /go/src/github.com/grafana/grafana
|
||||
@@ -70,6 +70,62 @@ jobs:
|
||||
name: cache server tests
|
||||
command: './scripts/circle-test-cache-servers.sh'
|
||||
|
||||
end-to-end-test:
|
||||
docker:
|
||||
- image: circleci/node:10-browsers
|
||||
- image: grafana/grafana-dev:master-$CIRCLE_SHA1
|
||||
steps:
|
||||
- run: dockerize -wait tcp://127.0.0.1:3000 -timeout 120s
|
||||
- checkout
|
||||
- restore_cache:
|
||||
key: dependency-cache-{{ checksum "yarn.lock" }}
|
||||
- run:
|
||||
name: yarn install
|
||||
command: 'yarn install --pure-lockfile --no-progress'
|
||||
no_output_timeout: 5m
|
||||
- save_cache:
|
||||
key: dependency-cache-{{ checksum "yarn.lock" }}
|
||||
paths:
|
||||
- node_modules
|
||||
- run:
|
||||
name: run end-to-end tests
|
||||
command: 'env BASE_URL=http://127.0.0.1:3000 yarn e2e-tests'
|
||||
no_output_timeout: 5m
|
||||
- store_artifacts:
|
||||
path: public/e2e-test/screenShots/theTruth
|
||||
destination: expected-screenshots
|
||||
- store_artifacts:
|
||||
path: public/e2e-test/screenShots/theOutput
|
||||
destination: output-screenshots
|
||||
|
||||
end-to-end-test-release:
|
||||
docker:
|
||||
- image: circleci/node:10-browsers
|
||||
- image: grafana/grafana-dev:$CIRCLE_TAG
|
||||
steps:
|
||||
- run: dockerize -wait tcp://127.0.0.1:3000 -timeout 120s
|
||||
- checkout
|
||||
- restore_cache:
|
||||
key: dependency-cache-{{ checksum "yarn.lock" }}
|
||||
- run:
|
||||
name: yarn install
|
||||
command: 'yarn install --pure-lockfile --no-progress'
|
||||
no_output_timeout: 5m
|
||||
- save_cache:
|
||||
key: dependency-cache-{{ checksum "yarn.lock" }}
|
||||
paths:
|
||||
- node_modules
|
||||
- run:
|
||||
name: run end-to-end tests
|
||||
command: 'env BASE_URL=http://127.0.0.1:3000 yarn e2e-tests'
|
||||
no_output_timeout: 5m
|
||||
- store_artifacts:
|
||||
path: public/e2e-test/screenShots/theTruth
|
||||
destination: expected-screenshots
|
||||
- store_artifacts:
|
||||
path: public/e2e-test/screenShots/theOutput
|
||||
destination: output-screenshots
|
||||
|
||||
codespell:
|
||||
docker:
|
||||
- image: circleci/python
|
||||
@@ -86,9 +142,9 @@ jobs:
|
||||
name: check documentation spelling errors
|
||||
command: 'codespell -I ./words_to_ignore.txt docs/'
|
||||
|
||||
backend-lint:
|
||||
lint-go:
|
||||
docker:
|
||||
- image: circleci/golang:1.12.4
|
||||
- image: circleci/golang:1.12.6
|
||||
environment:
|
||||
# we need CGO because of go-sqlite3
|
||||
CGO_ENABLED: 1
|
||||
@@ -96,12 +152,21 @@ jobs:
|
||||
steps:
|
||||
- checkout
|
||||
- run:
|
||||
name: backend lint
|
||||
command: './scripts/backend-lint.sh'
|
||||
name: Lint Go
|
||||
command: 'make lint-go'
|
||||
|
||||
shellcheck:
|
||||
machine: true
|
||||
working_directory: ~/go/src/github.com/grafana/grafana
|
||||
steps:
|
||||
- checkout
|
||||
- run:
|
||||
name: ShellCheck
|
||||
command: 'make shellcheck'
|
||||
|
||||
test-frontend:
|
||||
docker:
|
||||
- image: circleci/node:8
|
||||
- image: circleci/node:10
|
||||
steps:
|
||||
- checkout
|
||||
- restore_cache:
|
||||
@@ -120,7 +185,7 @@ jobs:
|
||||
|
||||
test-backend:
|
||||
docker:
|
||||
- image: circleci/golang:1.12.4
|
||||
- image: circleci/golang:1.12.6
|
||||
working_directory: /go/src/github.com/grafana/grafana
|
||||
steps:
|
||||
- checkout
|
||||
@@ -130,7 +195,7 @@ jobs:
|
||||
|
||||
build-all:
|
||||
docker:
|
||||
- image: grafana/build-container:1.2.6
|
||||
- image: grafana/build-container:1.2.7
|
||||
working_directory: /go/src/github.com/grafana/grafana
|
||||
steps:
|
||||
- checkout
|
||||
@@ -174,7 +239,7 @@ jobs:
|
||||
|
||||
build:
|
||||
docker:
|
||||
- image: grafana/build-container:1.2.6
|
||||
- image: grafana/build-container:1.2.7
|
||||
working_directory: /go/src/github.com/grafana/grafana
|
||||
steps:
|
||||
- checkout
|
||||
@@ -200,7 +265,7 @@ jobs:
|
||||
|
||||
build-fast-backend:
|
||||
docker:
|
||||
- image: grafana/build-container:1.2.6
|
||||
- image: grafana/build-container:1.2.7
|
||||
working_directory: /go/src/github.com/grafana/grafana
|
||||
steps:
|
||||
- checkout
|
||||
@@ -217,7 +282,7 @@ jobs:
|
||||
|
||||
build-fast-frontend:
|
||||
docker:
|
||||
- image: grafana/build-container:1.2.6
|
||||
- image: grafana/build-container:1.2.7
|
||||
working_directory: /go/src/github.com/grafana/grafana
|
||||
steps:
|
||||
- checkout
|
||||
@@ -241,7 +306,7 @@ jobs:
|
||||
|
||||
build-fast-package:
|
||||
docker:
|
||||
- image: grafana/build-container:1.2.6
|
||||
- image: grafana/build-container:1.2.7
|
||||
working_directory: /go/src/github.com/grafana/grafana
|
||||
steps:
|
||||
- checkout
|
||||
@@ -268,7 +333,7 @@ jobs:
|
||||
|
||||
build-fast-save:
|
||||
docker:
|
||||
- image: grafana/build-container:1.2.6
|
||||
- image: grafana/build-container:1.2.7
|
||||
working_directory: /go/src/github.com/grafana/grafana
|
||||
steps:
|
||||
- checkout
|
||||
@@ -354,7 +419,7 @@ jobs:
|
||||
|
||||
build-enterprise:
|
||||
docker:
|
||||
- image: grafana/build-container:1.2.6
|
||||
- image: grafana/build-container:1.2.7
|
||||
working_directory: /go/src/github.com/grafana/grafana
|
||||
steps:
|
||||
- checkout
|
||||
@@ -386,7 +451,7 @@ jobs:
|
||||
|
||||
build-all-enterprise:
|
||||
docker:
|
||||
- image: grafana/build-container:1.2.6
|
||||
- image: grafana/build-container:1.2.7
|
||||
working_directory: /go/src/github.com/grafana/grafana
|
||||
steps:
|
||||
- checkout
|
||||
@@ -570,13 +635,31 @@ jobs:
|
||||
|
||||
store-build-artifacts:
|
||||
docker:
|
||||
- image: circleci/node:8
|
||||
- image: circleci/node:10
|
||||
steps:
|
||||
- attach_workspace:
|
||||
at: .
|
||||
- store_artifacts:
|
||||
path: ./dist
|
||||
|
||||
trigger-docs-update:
|
||||
docker:
|
||||
- image: circleci/python:3.6.8
|
||||
steps:
|
||||
- checkout
|
||||
- run:
|
||||
name: Trigger Docs update
|
||||
command: |
|
||||
if git diff --name-only HEAD^ | grep -q "^docs"; then
|
||||
echo "Build URL:"
|
||||
curl -s -u "$DOCS_CIRCLE_TOKEN:" \
|
||||
-d build_parameters[CIRCLE_JOB]=pull-submodule-changes \
|
||||
https://circleci.com/api/v1.1/project/github/grafana/docs.grafana.com/tree/staging \
|
||||
| jq .build_url
|
||||
else
|
||||
echo "-- no changes to docs files --"
|
||||
fi
|
||||
|
||||
workflows:
|
||||
version: 2
|
||||
build-master:
|
||||
@@ -587,7 +670,9 @@ workflows:
|
||||
filters: *filter-only-master
|
||||
- codespell:
|
||||
filters: *filter-only-master
|
||||
- backend-lint:
|
||||
- lint-go:
|
||||
filters: *filter-only-master
|
||||
- shellcheck:
|
||||
filters: *filter-only-master
|
||||
- test-frontend:
|
||||
filters: *filter-only-master
|
||||
@@ -603,7 +688,8 @@ workflows:
|
||||
- test-backend
|
||||
- test-frontend
|
||||
- codespell
|
||||
- backend-lint
|
||||
- lint-go
|
||||
- shellcheck
|
||||
- mysql-integration-test
|
||||
- postgres-integration-test
|
||||
- build-oss-msi
|
||||
@@ -615,7 +701,8 @@ workflows:
|
||||
- test-backend
|
||||
- test-frontend
|
||||
- codespell
|
||||
- backend-lint
|
||||
- lint-go
|
||||
- shellcheck
|
||||
- mysql-integration-test
|
||||
- postgres-integration-test
|
||||
filters: *filter-only-master
|
||||
@@ -625,7 +712,8 @@ workflows:
|
||||
- test-backend
|
||||
- test-frontend
|
||||
- codespell
|
||||
- backend-lint
|
||||
- lint-go
|
||||
- shellcheck
|
||||
- mysql-integration-test
|
||||
- postgres-integration-test
|
||||
- build-all-enterprise
|
||||
@@ -636,11 +724,19 @@ workflows:
|
||||
- test-backend
|
||||
- test-frontend
|
||||
- codespell
|
||||
- backend-lint
|
||||
- lint-go
|
||||
- shellcheck
|
||||
- mysql-integration-test
|
||||
- postgres-integration-test
|
||||
filters: *filter-only-master
|
||||
|
||||
- end-to-end-test:
|
||||
requires:
|
||||
- grafana-docker-master
|
||||
filters: *filter-only-master
|
||||
- trigger-docs-update:
|
||||
requires:
|
||||
- end-to-end-test
|
||||
filters: *filter-only-master
|
||||
release:
|
||||
jobs:
|
||||
- build-all:
|
||||
@@ -649,7 +745,9 @@ workflows:
|
||||
filters: *filter-only-release
|
||||
- codespell:
|
||||
filters: *filter-only-release
|
||||
- backend-lint:
|
||||
- lint-go:
|
||||
filters: *filter-only-release
|
||||
- shellcheck:
|
||||
filters: *filter-only-release
|
||||
- test-frontend:
|
||||
filters: *filter-only-release
|
||||
@@ -665,7 +763,8 @@ workflows:
|
||||
- test-backend
|
||||
- test-frontend
|
||||
- codespell
|
||||
- backend-lint
|
||||
- lint-go
|
||||
- shellcheck
|
||||
- mysql-integration-test
|
||||
- postgres-integration-test
|
||||
- build-oss-msi
|
||||
@@ -677,7 +776,8 @@ workflows:
|
||||
- test-backend
|
||||
- test-frontend
|
||||
- codespell
|
||||
- backend-lint
|
||||
- lint-go
|
||||
- shellcheck
|
||||
- mysql-integration-test
|
||||
- postgres-integration-test
|
||||
filters: *filter-only-release
|
||||
@@ -688,7 +788,8 @@ workflows:
|
||||
- test-backend
|
||||
- test-frontend
|
||||
- codespell
|
||||
- backend-lint
|
||||
- lint-go
|
||||
- shellcheck
|
||||
- mysql-integration-test
|
||||
- postgres-integration-test
|
||||
filters: *filter-only-release
|
||||
@@ -698,10 +799,15 @@ workflows:
|
||||
- test-backend
|
||||
- test-frontend
|
||||
- codespell
|
||||
- backend-lint
|
||||
- lint-go
|
||||
- shellcheck
|
||||
- mysql-integration-test
|
||||
- postgres-integration-test
|
||||
filters: *filter-only-release
|
||||
- end-to-end-test-release:
|
||||
requires:
|
||||
- grafana-docker-release
|
||||
filters: *filter-only-release
|
||||
|
||||
build-branches-and-prs:
|
||||
jobs:
|
||||
@@ -716,7 +822,11 @@ workflows:
|
||||
- build-fast-frontend
|
||||
- codespell:
|
||||
filters: *filter-not-release-or-master
|
||||
- backend-lint:
|
||||
- lint-go:
|
||||
filters: *filter-not-release-or-master
|
||||
- lint-go:
|
||||
filters: *filter-not-release-or-master
|
||||
- shellcheck:
|
||||
filters: *filter-not-release-or-master
|
||||
- test-frontend:
|
||||
filters: *filter-not-release-or-master
|
||||
@@ -734,7 +844,8 @@ workflows:
|
||||
- test-backend
|
||||
- test-frontend
|
||||
- codespell
|
||||
- backend-lint
|
||||
- lint-go
|
||||
- shellcheck
|
||||
- mysql-integration-test
|
||||
- postgres-integration-test
|
||||
- cache-server-test
|
||||
@@ -745,7 +856,8 @@ workflows:
|
||||
- test-backend
|
||||
- test-frontend
|
||||
- codespell
|
||||
- backend-lint
|
||||
- lint-go
|
||||
- shellcheck
|
||||
- mysql-integration-test
|
||||
- postgres-integration-test
|
||||
- cache-server-test
|
||||
|
||||
6
.gitignore
vendored
6
.gitignore
vendored
@@ -79,8 +79,12 @@ debug.test
|
||||
/scripts/build/release_publisher/release_publisher
|
||||
*.patch
|
||||
|
||||
|
||||
# Ignoring frontend packages specifics
|
||||
/packages/**/dist
|
||||
/packages/**/compiled
|
||||
/packages/**/.rpt2_cache
|
||||
|
||||
theOutput/
|
||||
|
||||
# Ignore go local build dependencies
|
||||
/scripts/go/bin/**
|
||||
|
||||
121
CHANGELOG.md
121
CHANGELOG.md
@@ -1,4 +1,106 @@
|
||||
# 6.2.0 (unreleased)
|
||||
# 6.3.0 (unreleased)
|
||||
|
||||
# 6.2.5 (2019-06-25)
|
||||
|
||||
### Features / Enhancements
|
||||
* **Grafana-CLI**: Wrapper for `grafana-cli` within RPM/DEB packages and config/homepath are now global flags. [#17695](https://github.com/grafana/grafana/pull/17695), [@gotjosh](https://github.com/gotjosh)
|
||||
* **Panel**: Fully escape html in drilldown links (was only sanitized before) . [#17731](https://github.com/grafana/grafana/pull/17731), [@dehrax](https://github.com/dehrax)
|
||||
|
||||
### Bug Fixes
|
||||
* **Config**: Fix connectionstring for remote_cache in defaults.ini. [#17675](https://github.com/grafana/grafana/pull/17675), [@kylebrandt](https://github.com/kylebrandt)
|
||||
* **Elasticsearch**: Fix empty query (via template variable) should be sent as wildcard. [#17488](https://github.com/grafana/grafana/pull/17488), [@davewat](https://github.com/davewat)
|
||||
* **HTTP-Server**: Fix Strict-Transport-Security header. [#17644](https://github.com/grafana/grafana/pull/17644), [@kylebrandt](https://github.com/kylebrandt)
|
||||
* **TablePanel**: fix annotations display. [#17646](https://github.com/grafana/grafana/pull/17646), [@ryantxu](https://github.com/ryantxu)
|
||||
|
||||
# 6.2.4 (2019-06-18)
|
||||
|
||||
### Bug Fixes
|
||||
* **Grafana-CLI**: Fix receiving flags via command line . [#17617](https://github.com/grafana/grafana/pull/17617), [@gotjosh](https://github.com/gotjosh)
|
||||
* **HTTPServer**: Fix X-XSS-Protection header formatting. [#17620](https://github.com/grafana/grafana/pull/17620), [@yverry](https://github.com/yverry)
|
||||
|
||||
# 6.2.3 (2019-06-17)
|
||||
|
||||
### Known issues
|
||||
* **grafana-cli**: The argument `--pluginsDir` is not working.
|
||||
* **docker**: Due to above problem with grafana-cli the docker run will fail to start the container if you're installing plugins using the `GF_INSTALL_PLUGINS` environment variable. We have removed 6.2.3 tag from docker hub and latest tag now points to 6.2.2.
|
||||
|
||||
More details in bug report: https://github.com/grafana/grafana/issues/17613
|
||||
|
||||
### Features / Enhancements
|
||||
* **AuthProxy**: Optimistic lock pattern for remote cache Set. [#17485](https://github.com/grafana/grafana/pull/17485), [@papagian](https://github.com/papagian)
|
||||
* **HTTPServer**: Options for returning new headers X-Content-Type-Options, X-XSS-Protection and Strict-Transport-Security. [#17522](https://github.com/grafana/grafana/pull/17522), [@kylebrandt](https://github.com/kylebrandt)
|
||||
|
||||
### Bug Fixes
|
||||
* **Auth Proxy**: Fix non-negative cache TTL. [#17495](https://github.com/grafana/grafana/pull/17495), [@kylebrandt](https://github.com/kylebrandt)
|
||||
* **Grafana-CLI**: Fix receiving configuration flags from the command line. [#17606](https://github.com/grafana/grafana/pull/17606), [@gotjosh](https://github.com/gotjosh)
|
||||
* **OAuth**: Fix for wrong user token updated on OAuth refresh in DS proxy. [#17541](https://github.com/grafana/grafana/pull/17541), [@redbaron](https://github.com/redbaron)
|
||||
* **remote_cache**: Fix redis. [#17483](https://github.com/grafana/grafana/pull/17483), [@kylebrandt](https://github.com/kylebrandt)
|
||||
|
||||
# 6.2.2 (2019-06-05)
|
||||
|
||||
### Features / Enhancements
|
||||
* **Security**: Prevent CSV formula injection attack when exporting data. [#17363](https://github.com/grafana/grafana/pull/17363), [@DanCech](https://github.com/DanCech)
|
||||
|
||||
### Bug Fixes
|
||||
* **CloudWatch**: Fixes error when hiding/disabling queries . [#17283](https://github.com/grafana/grafana/pull/17283), [@jpiccari](https://github.com/jpiccari)
|
||||
* **Database**: Fixed slow permission query in folder/dashboard search. [#17427](https://github.com/grafana/grafana/pull/17427), [@aocenas](https://github.com/aocenas)
|
||||
* **Explore**: Fixed updating time range before running queries. [#17349](https://github.com/grafana/grafana/pull/17349), [@marefr](https://github.com/marefr)
|
||||
* **Plugins**: Fixed plugin config page navigation when using subpath. [#17364](https://github.com/grafana/grafana/pull/17364), [@torkelo](https://github.com/torkelo)
|
||||
|
||||
# 6.2.1 (2019-05-27)
|
||||
|
||||
### Features / Enhancements
|
||||
* **CLI**: Add command to migrate all datasources to use encrypted password fields . [#17118](https://github.com/grafana/grafana/pull/17118), [@aocenas](https://github.com/aocenas)
|
||||
* **Gauge/BarGauge**: Improvements to auto value font size . [#17292](https://github.com/grafana/grafana/pull/17292), [@torkelo](https://github.com/torkelo)
|
||||
|
||||
### Bug Fixes
|
||||
* **Auth Proxy**: Resolve database is locked errors. [#17274](https://github.com/grafana/grafana/pull/17274), [@marefr](https://github.com/marefr)
|
||||
* **Database**: Retry transaction if sqlite returns database is locked error. [#17276](https://github.com/grafana/grafana/pull/17276), [@marefr](https://github.com/marefr)
|
||||
* **Explore**: Fixes so clicking in a Prometheus Table the query is filtered by clicked value. [#17083](https://github.com/grafana/grafana/pull/17083), [@hugohaggmark](https://github.com/hugohaggmark)
|
||||
* **Singlestat**: Fixes issue with value placement and line wraps. [#17249](https://github.com/grafana/grafana/pull/17249), [@torkelo](https://github.com/torkelo)
|
||||
* **Tech**: Update jQuery to 3.4.1 to fix issue on iOS 10 based browers as well as Chrome 53.x . [#17290](https://github.com/grafana/grafana/pull/17290), [@timbutler](https://github.com/timbutler)
|
||||
|
||||
# 6.2.0 (2019-05-22)
|
||||
|
||||
### Bug Fixes
|
||||
* **BarGauge**: Fix for negative min values. [#17192](https://github.com/grafana/grafana/pull/17192), [@torkelo](https://github.com/torkelo)
|
||||
* **Gauge/BarGauge**: Fix for issues editing min & max options. [#17174](https://github.com/grafana/grafana/pull/17174)
|
||||
* **Search**: Make only folder name only open search with current folder filter. [#17226](https://github.com/grafana/grafana/pull/17226)
|
||||
* **AzureMonitor**: Revert to clearing chained dropdowns. [#17212](https://github.com/grafana/grafana/pull/17212)
|
||||
|
||||
### Breaking Changes
|
||||
* **Plugins**: Data source plugins that process hidden queries need to add a "hiddenQueries: true" attribute in plugin.json. [#17124](https://github.com/grafana/grafana/pull/17124), [@ryantxu](https://github.com/ryantxu)
|
||||
|
||||
### Removal of old deprecated package repository
|
||||
|
||||
5 months ago we deprecated our old package cloud repository and [replaced it](https://grafana.com/blog/2019/01/05/moving-to-packages.grafana.com/) with our own. We will remove the old depreciated
|
||||
repo on July 1st. Make sure you have switched to the new repo by then. The new repository has all our old releases so you are not required to upgrade just to switch package repository.
|
||||
|
||||
# 6.2.0-beta2 (2019-05-15)
|
||||
|
||||
### Features / Enhancements
|
||||
* **Plugins**: Support templated urls in plugin routes. [#16599](https://github.com/grafana/grafana/pull/16599), [@briangann](https://github.com/briangann)
|
||||
* **Packaging**: New MSI windows installer package**. [#17073](https://github.com/grafana/grafana/pull/17073), [@briangann](https://github.com/briangann)
|
||||
|
||||
### Bug Fixes
|
||||
* **Dashboard**: Fixes blank dashboard after window resize with panel without title. [#16942](https://github.com/grafana/grafana/pull/16942), [@torkelo](https://github.com/torkelo)
|
||||
* **Dashboard**: Fixes lazy loading & expanding collapsed rows on mobile. [#17055](https://github.com/grafana/grafana/pull/17055), [@torkelo](https://github.com/torkelo)
|
||||
* **Dashboard**: Fixes scrolling issues for Edge browser. [#17033](https://github.com/grafana/grafana/pull/17033), [@jschill](https://github.com/jschill)
|
||||
* **Dashboard**: Show refresh button in first kiosk(tv) mode. [#17032](https://github.com/grafana/grafana/pull/17032), [@torkelo](https://github.com/torkelo)
|
||||
* **Explore**: Fix empty result from datasource should render logs container. [#16999](https://github.com/grafana/grafana/pull/16999), [@marefr](https://github.com/marefr)
|
||||
* **Explore**: Fixes so clicking in a Prometheus Table the query is filtered by clicked value. [#17083](https://github.com/grafana/grafana/pull/17083), [@hugohaggmark](https://github.com/hugohaggmark)
|
||||
* **Explore**: Makes it possible to zoom in Explore/Loki/Graph without exception. [#16991](https://github.com/grafana/grafana/pull/16991), [@hugohaggmark](https://github.com/hugohaggmark)
|
||||
* **Gauge**: Fixes orientation issue after switching from BarGauge to Gauge. [#17064](https://github.com/grafana/grafana/pull/17064), [@torkelo](https://github.com/torkelo)
|
||||
* **GettingStarted**: Fixes layout issues in getting started panel. [#16941](https://github.com/grafana/grafana/pull/16941), [@torkelo](https://github.com/torkelo)
|
||||
* **InfluxDB**: Fix HTTP method should default to GET. [#16949](https://github.com/grafana/grafana/pull/16949), [@StephenSorriaux](https://github.com/StephenSorriaux)
|
||||
* **Panels**: Fixed alert icon position in panel header. [#17070](https://github.com/grafana/grafana/pull/17070), [@torkelo](https://github.com/torkelo)
|
||||
* **Panels**: Fixes panel error tooltip not showing. [#16993](https://github.com/grafana/grafana/pull/16993), [@torkelo](https://github.com/torkelo)
|
||||
* **Plugins**: Fix how datemath utils are exposed to plugins. [#16976](https://github.com/grafana/grafana/pull/16976), [@marefr](https://github.com/marefr)
|
||||
* **Singlestat**: fixed centering issue for very small panels. [#16944](https://github.com/grafana/grafana/pull/16944), [@torkelo](https://github.com/torkelo)
|
||||
* **Search**: Scroll issue in dashboard search in latest Chrome. [#17054](https://github.com/grafana/grafana/pull/17054), [@jschill](https://github.com/jschill)
|
||||
* **Docker**: Prevent a permission denied error when writing files to the default provisioning directory. [#16831](https://github.com/grafana/grafana/pull/16831), [@wmedlar](https://github.com/wmedlar)
|
||||
* **Gauge**: Adds background shade to gauge track and improves height usage. [#17019](https://github.com/grafana/grafana/pull/17019), [@torkelo](https://github.com/torkelo)
|
||||
* **RemoteCache**: Avoid race condition in Set causing error on insert. . [#17082](https://github.com/grafana/grafana/pull/17082), [@bergquist](https://github.com/bergquist)
|
||||
|
||||
# 6.2.0-beta1 (2019-05-07)
|
||||
|
||||
@@ -8,6 +110,7 @@
|
||||
* **Alerting**: Adjust label for send on all alerts to default . [#16554](https://github.com/grafana/grafana/pull/16554), [@simPod](https://github.com/simPod)
|
||||
* **Alerting**: Makes timeouts and retries configurable. [#16259](https://github.com/grafana/grafana/pull/16259), [@kobehaha](https://github.com/kobehaha)
|
||||
* **Alerting**: No notification when going from no data to pending. [#16905](https://github.com/grafana/grafana/pull/16905), [@bergquist](https://github.com/bergquist)
|
||||
* **Alerting**: Pushover alert, support for different sound for OK. [#16525](https://github.com/grafana/grafana/pull/16525), [@Hofls](https://github.com/Hofls)
|
||||
* **Auth**: Enable retries and transaction for some db calls for auth tokens . [#16785](https://github.com/grafana/grafana/pull/16785), [@bergquist](https://github.com/bergquist)
|
||||
* **AzureMonitor**: Adds support for multiple subscriptions per datasource. [#16922](https://github.com/grafana/grafana/pull/16922), [@daniellee](https://github.com/daniellee)
|
||||
* **Bar Gauge**: New multi series enabled gauge like panel with horizontal and vertical layouts and 3 display modes. [#16918](https://github.com/grafana/grafana/pull/16918), [@torkelo](https://github.com/torkelo)
|
||||
@@ -22,19 +125,23 @@
|
||||
* **Explore**: Adds reconnect for failing datasource. [#16226](https://github.com/grafana/grafana/pull/16226), [@hugohaggmark](https://github.com/hugohaggmark)
|
||||
* **Explore**: Support user timezone. [#16469](https://github.com/grafana/grafana/pull/16469), [@marefr](https://github.com/marefr)
|
||||
* **InfluxDB**: Add support for POST HTTP verb. [#16690](https://github.com/grafana/grafana/pull/16690), [@StephenSorriaux](https://github.com/StephenSorriaux)
|
||||
* **Loki**: Search is now case insensitive. [#15948](https://github.com/grafana/grafana/pull/15948), [@steven-sheehy](https://github.com/steven-sheehy)
|
||||
* **OAuth**: Update jwt regexp to include `=`. [#16521](https://github.com/grafana/grafana/pull/16521), [@DanCech](https://github.com/DanCech)
|
||||
* **Panels**: No title will no longer make panel header take up space. [#16884](https://github.com/grafana/grafana/pull/16884), [@torkelo](https://github.com/torkelo)
|
||||
* **Prometheus**: Adds tracing headers for Prometheus datasource. [#16724](https://github.com/grafana/grafana/pull/16724), [@svagner](https://github.com/svagner)
|
||||
* **Provisioning**: Add API endpoint to reload provisioning configs. [#16579](https://github.com/grafana/grafana/pull/16579), [@aocenas](https://github.com/aocenas)
|
||||
* **Provisioning**: Do not allow deletion of provisioned dashboards. [#16211](https://github.com/grafana/grafana/pull/16211), [@aocenas](https://github.com/aocenas)
|
||||
* **Provisioning**: Interpolate env vars in provisioning files. [#16499](https://github.com/grafana/grafana/pull/16499), [@aocenas](https://github.com/aocenas)
|
||||
* **Provisioning**: Support FolderUid in Dashboard Provisioning Config. [#16559](https://github.com/grafana/grafana/pull/16559), [@swtch1](https://github.com/swtch1)
|
||||
* **Security**: Add new setting allow_embedding. [#16853](https://github.com/grafana/grafana/pull/16853), [@marefr](https://github.com/marefr)
|
||||
* **Security**: Store datasource passwords encrypted in secureJsonData. [#16175](https://github.com/grafana/grafana/pull/16175), [@aocenas](https://github.com/aocenas)
|
||||
* **UX**: Improve Grafana usage for smaller screens . [#16783](https://github.com/grafana/grafana/pull/16783), [@torkelo](https://github.com/torkelo)
|
||||
* **UX**: Improve Grafana usage for smaller screens. [#16783](https://github.com/grafana/grafana/pull/16783), [@torkelo](https://github.com/torkelo)
|
||||
* **Units**: Add angle units, Arc Minutes and Seconds. [#16271](https://github.com/grafana/grafana/pull/16271), [@Dripoul](https://github.com/Dripoul)
|
||||
|
||||
### Bug Fixes
|
||||
### Bug Fixes
|
||||
* **Build**: Fix bug where grafana didn't start after mysql on rpm packages. [#16917](https://github.com/grafana/grafana/pull/16917), [@bergquist](https://github.com/bergquist)
|
||||
* **CloudWatch**: Fixes query order not affecting series ordering & color. [#16408](https://github.com/grafana/grafana/pull/16408), [@mtanda](https://github.com/mtanda)
|
||||
* **CloudWatch**: Use default alias if there is no alias for metrics . [#16732](https://github.com/grafana/grafana/pull/16732), [@utkarshcmu](https://github.com/utkarshcmu)
|
||||
* **CloudWatch**: Use default alias if there is no alias for metrics. [#16732](https://github.com/grafana/grafana/pull/16732), [@utkarshcmu](https://github.com/utkarshcmu)
|
||||
* **Config**: Fixes bug where timeouts for alerting was not parsed correctly. [#16784](https://github.com/grafana/grafana/pull/16784), [@aocenas](https://github.com/aocenas)
|
||||
* **Elasticsearch**: Fix view percentiles metric in table without date histogram. [#15686](https://github.com/grafana/grafana/pull/15686), [@Igor-Ratsuk](https://github.com/Igor-Ratsuk)
|
||||
* **Explore**: Prevents histogram loading from killing Prometheus instance. [#16768](https://github.com/grafana/grafana/pull/16768), [@hugohaggmark](https://github.com/hugohaggmark)
|
||||
@@ -45,7 +152,7 @@
|
||||
|
||||
### Breaking changes
|
||||
|
||||
* **Gauge Panel**: The suffix / prefix options have been removed from the new Guage Panel (introduced in v6.0). [#16870](https://github.com/grafana/grafana/issues/16870).
|
||||
* **Gauge Panel**: The suffix / prefix options have been removed from the new Gauge Panel (introduced in v6.0). [#16870](https://github.com/grafana/grafana/issues/16870).
|
||||
|
||||
|
||||
# 6.1.6 (2019-04-29)
|
||||
@@ -302,6 +409,10 @@
|
||||
* **Text Panel**: The text panel does no longer by default allow unsantizied HTML. [#4117](https://github.com/grafana/grafana/issues/4117). This means that if you have text panels with scripts tags they will no longer work as before. To enable unsafe javascript execution in text panels enable the settings `disable_sanitize_html` under the section `[panels]` in your Grafana ini file, or set env variable `GF_PANELS_DISABLE_SANITIZE_HTML=true`.
|
||||
* **Dashboard**: Panel property `minSpan` replaced by `maxPerRow`. Dashboard migration will automatically migrate all dashboard panels using the `minSpan` property to the new `maxPerRow` property [#12991](https://github.com/grafana/grafana/pull/12991)
|
||||
|
||||
# 5.4.4 (2019-04-29)
|
||||
|
||||
* **Security**: Urgent security patch release. Please read more in our [blog](https://grafana.com/blog/2019/04/29/grafana-5.4.4-and-6.1.6-released-with-important-security-fix/)
|
||||
|
||||
# 5.4.3 (2019-01-14)
|
||||
|
||||
### Tech
|
||||
|
||||
@@ -1,18 +1,19 @@
|
||||
|
||||
# Contributing
|
||||
|
||||
Grafana uses GitHub to manage contributions.
|
||||
Contributions take the form of pull requests that will be reviewed by the core team.
|
||||
|
||||
* If you are a new contributor see: [Steps to Contribute](#steps-to-contribute)
|
||||
- If you are a new contributor see: [Steps to Contribute](#steps-to-contribute)
|
||||
|
||||
* If you have a trivial fix or improvement, go ahead and create a pull request.
|
||||
- If you have a trivial fix or improvement, go ahead and create a pull request.
|
||||
|
||||
* If you plan to do something more involved, discuss your idea on the respective [issue](https://github.com/grafana/grafana/issues) or create a [new issue](https://github.com/grafana/grafana/issues/new) if it does not exist. This will avoid unnecessary work and surely give you and us a good deal of inspiration.
|
||||
- If you plan to do something more involved, discuss your idea on the respective [issue](https://github.com/grafana/grafana/issues) or create a [new issue](https://github.com/grafana/grafana/issues/new) if it does not exist. This will avoid unnecessary work and surely give you and us a good deal of inspiration.
|
||||
|
||||
* Sign our [CLA](http://docs.grafana.org/contribute/cla/).
|
||||
- Sign our [CLA](http://docs.grafana.org/contribute/cla/).
|
||||
|
||||
* For changes in the backend, follow the style guides used in Go [Code Review Comments](https://code.google.com/p/go-wiki/wiki/CodeReviewComments) and Peter Bourgon's [Go: Best Practices for Production Environments](http://peter.bourgon.org/go-in-production/#formatting-and-style)
|
||||
- Make sure to follow the code style guides
|
||||
- [Backend](https://github.com/grafana/grafana/tree/master/pkg)
|
||||
- [Frontend](https://github.com/grafana/grafana/tree/master/style_guides)
|
||||
|
||||
## Steps to Contribute
|
||||
|
||||
@@ -22,61 +23,40 @@ Please check the [`beginner friendly`](https://github.com/grafana/grafana/issues
|
||||
|
||||
To setup a local development environment we recommend reading [Building Grafana from source](http://docs.grafana.org/project/building_from_source/)
|
||||
|
||||
|
||||
## Pull Request Checklist
|
||||
|
||||
* Branch from the master branch and, if needed, rebase to the current master branch before submitting your pull request. If it doesn't merge cleanly with master you may be asked to rebase your changes.
|
||||
- Branch from the master branch and, if needed, rebase to the current master branch before submitting your pull request. If it doesn't merge cleanly with master you may be asked to rebase your changes.
|
||||
|
||||
* If your patch is not getting reviewed or you need a specific person to review it, you can @-reply a reviewer asking for a review in the pull request or a comment.
|
||||
- If your patch is not getting reviewed or you need a specific person to review it, you can @-reply a reviewer asking for a review in the pull request or a comment.
|
||||
|
||||
* Add tests relevant to the fixed bug or new feature.
|
||||
- Add tests relevant to the fixed bug or new feature.
|
||||
|
||||
### Pull requests with new features
|
||||
Commits should be as small as possible, while ensuring that each commit is correct independently (i.e., each commit should compile and pass tests).
|
||||
- Follow [PR and commit messages guidelines](#PR-and-commit-messages-guidelines)
|
||||
|
||||
Make sure to include `Closes #<issue number>` or `Fixes #<issue number>` in the pull request description.
|
||||
### Pull Requests titles and message
|
||||
|
||||
### Pull requests with bug fixes
|
||||
Please make all changes in one commit if possible. Include `Closes #<issue number>` in bottom of the commit message.
|
||||
A commit message for a bug fix should look something like this.
|
||||
Pull request titles should follow this format: `Area: Name of the change`.
|
||||
Titles are used to generate the changelog so they should be as descriptive as possible in one line.
|
||||
|
||||
```
|
||||
avoid infinite loop in the dashboard provisioner
|
||||
Good Examples
|
||||
|
||||
if one dashboard with an uid is refered to by two
|
||||
provsioners each provisioner overwrite each other.
|
||||
filling up dashboard_versions quite fast if using
|
||||
default settings.
|
||||
- `Explore: Adds Live option for supported datasources`
|
||||
- `GraphPanel: Don't sort series when legend table & sort column is not visible`
|
||||
- `Build: Support publishing MSI to grafana.com`
|
||||
|
||||
Closes #12864
|
||||
```
|
||||
The message in the Pull requests should contain a reference so the issue if there is one. Ex `Closes #<issue number>`, `Fixes #<issue number>`, or `Ref #<issue number>` if the change is related to an issue but does not close it. Make sure to explain what problem the pull request is solving and why its implemented this way. As a new contributor its often better to overcommunicate to avoid back and forth communication, as it consumes time and energy.
|
||||
|
||||
If the pull request needs changes before its merged the new commits should be rebased into one commit before its merged.
|
||||
### GIT commit formating.
|
||||
|
||||
## Backend dependency management
|
||||
Grafana Squash Pull requests when merging them into master. This means the maintainer will be responsible for the title in the git commit message.
|
||||
The commit message of the commits in the Pull Request can still be part of the git commit body. So it's always encouraged to write informative commit messages.
|
||||
|
||||
The Grafana project uses [Go modules](https://golang.org/cmd/go/#hdr-Modules__module_versions__and_more) to manage dependencies on external packages. This requires a working Go environment with version 1.11 or greater installed.
|
||||
The Git commit title should be short, descriptive and include the Pull Request ID.
|
||||
|
||||
All dependencies are vendored in the `vendor/` directory.
|
||||
Good Examples
|
||||
|
||||
To add or update a new dependency, use the `go get` command:
|
||||
- `Explore: Live supprt in datasources (#12345)`
|
||||
- `GraphPanel: Fix legend sorting issues (#12345)`
|
||||
- `Build: Support publishing MSI to grafana.com (#12345)`
|
||||
|
||||
```bash
|
||||
# Pick the latest tagged release.
|
||||
go get example.com/some/module/pkg
|
||||
|
||||
# Pick a specific version.
|
||||
go get example.com/some/module/pkg@vX.Y.Z
|
||||
```
|
||||
|
||||
Tidy up the `go.mod` and `go.sum` files and copy the new/updated dependency to the `vendor/` directory:
|
||||
|
||||
|
||||
```bash
|
||||
# The GO111MODULE variable can be omitted when the code isn't located in GOPATH.
|
||||
GO111MODULE=on go mod tidy
|
||||
|
||||
GO111MODULE=on go mod vendor
|
||||
```
|
||||
|
||||
You have to commit the changes to `go.mod`, `go.sum` and the `vendor/` directory before submitting the pull request.
|
||||
Its also good practice to include a reference to the issue in the git commit body when possible.
|
||||
|
||||
@@ -33,7 +33,9 @@ ENV NODE_ENV production
|
||||
RUN ./node_modules/.bin/grunt build
|
||||
|
||||
# Final container
|
||||
FROM debian:stretch-slim
|
||||
FROM ubuntu:18.04
|
||||
|
||||
LABEL maintainer="Grafana team <hello@grafana.com>"
|
||||
|
||||
ARG GF_UID="472"
|
||||
ARG GF_GID="472"
|
||||
|
||||
384
ISSUE_TRIAGE.md
Normal file
384
ISSUE_TRIAGE.md
Normal file
@@ -0,0 +1,384 @@
|
||||
Triaging of issues
|
||||
------------------
|
||||
|
||||
Grafana being a popular open source project there are a lot of incoming issues. The main goal of issue triage is to categorize all incoming issues and make sure it has all basic information needed for anyone else to understand and/or being able to start working with it.
|
||||
|
||||
The core maintainers of the Grafana project is responsible for categorizing all incoming issues and delegate any critical and/or important issue to other maintainers. Currently there's one maintainer each week responsible. Besides that part, triage provides an important way to contribute to an open source project. Triage helps ensure issues resolve quickly by:
|
||||
|
||||
* Describing the issue's intent and purpose is conveyed precisely. This is necessary because it can be difficult for an issue to explain how an end user experiences a problem and what actions they took.
|
||||
* Giving a contributor the information they need before they commit to resolving an issue.
|
||||
* Lowering the issue count by preventing duplicate issues.
|
||||
* Streamlining the development process by preventing duplicate discussions.
|
||||
* If you don't have the knowledge or time to code, consider helping with triage. The community will thank you for saving them time by spending some of yours.
|
||||
|
||||
**Simplified flowchart diagram of the issue triage process:**
|
||||
<!-- https://textik.com/#610afa78553def29 -->
|
||||
```
|
||||
+--------------------------+
|
||||
+----------------+ New issue opened/ |
|
||||
| | more information added |
|
||||
| +-------------+------------+
|
||||
| Ask for more |
|
||||
| information +-------------+------------+
|
||||
| | All information needed |
|
||||
| +--------+ to categorize the issue? +--------+
|
||||
| | | | |
|
||||
| | NO +--------------------------+ YES |
|
||||
| | |
|
||||
+------+-------+-------------+ +------------+---------+ +----------------------------+
|
||||
| | | | | |
|
||||
| label: needs more details | | Needs investigation? +--YES---+ label: needs investigation |
|
||||
| | | | | |
|
||||
+----------------------------+ +----------------+-----+ +--------------+-------------+
|
||||
NO | |
|
||||
| Investigate |
|
||||
+-----------+----------+ |
|
||||
| label: type/* | |
|
||||
| label: area/* +------------------+
|
||||
| label: datasource/* |
|
||||
+-----|----------+-----+
|
||||
| |
|
||||
| |
|
||||
| +--+--------------------+ +--------------------+
|
||||
| | | | label: priority/* |
|
||||
| | Needs priority? +--YES---+| milestone? |
|
||||
| | | | |
|
||||
| +--------------------+--+ +----+---------------+
|
||||
| NO | |
|
||||
| | |
|
||||
+----+-------------+ +---+----------+ |
|
||||
| | | | |
|
||||
| Close issue +----------+ Done +------+
|
||||
| | | |
|
||||
+------------------+ +--------------+
|
||||
```
|
||||
|
||||
## How you can help
|
||||
|
||||
There are multiple ways that you can help with the Grafana project, especially without writing a single line of code. Everyone in the Grafana community will be greatly thankful you for helping out with any of the below tasks.
|
||||
|
||||
### Answer/ask questions
|
||||
|
||||
The [community site](https://community.grafana.com/) is the main channel to be used for asking and answering questions related to the Grafana project. This may be the first place a new or existing Grafana user look/ask for help after they found that the [documentation](https://grafana.com/docs) wasn't answering their questions. It's very important to help new and existing users so that these new users can find proper answers and eventually help out other users and by that keep growing the Grafana community.
|
||||
|
||||
Please signup to the Grafana [community site](https://community.grafana.com/) and start help other Grafana users by answering their questions and/or ask for help.
|
||||
|
||||
### Report documentation enhancements
|
||||
|
||||
If you visit the [documentation site](https://grafana.com/docs) and find typos/error/lack of information please report these by clicking on the `Request doc changes` link found on every page and/or contribute the changes yourself by clicking on `Edit this page` and open a pull request. Everyone in the community will greatly thank you for.
|
||||
|
||||
Please read about how documentation issues is triaged [below](#documentation-issue) to understand what kind of documentation may be suitable to request/add.
|
||||
|
||||
### Report a security vulnerability
|
||||
|
||||
Please review the [security policy](https://github.com/grafana/grafana/security/policy) for more details.
|
||||
|
||||
### Report bugs
|
||||
|
||||
Report a bug you found when using Grafana by [opening a new bug report](https://github.com/grafana/grafana/issues/new?labels=type%3A+bug&template=1-bug_report.md).
|
||||
|
||||
### Request enhancements/new features
|
||||
|
||||
Suggest an enhancement or new feature for the Grafana project by [opening a new enhancement issue](https://github.com/grafana/grafana/issues/new?labels=type%3A+feature+request&template=2-feature_request.md).
|
||||
|
||||
Alternatively, help make Grafana be better at being accessible to all by [opening a new accessibility issue](https://github.com/grafana/grafana/issues/new?labels=type%3A+accessibility&template=3-accessibility.md).
|
||||
|
||||
### Report inaccurate issue information
|
||||
|
||||
If you find an issue that have a badly formatted title and/or description, bad language/grammar and/or wrong labels it's important to let the issue author or maintainers know so it can be fixed. See [good practices](#good-practices) regarding basic information for issues below.
|
||||
|
||||
### Request closing of issues
|
||||
|
||||
The Grafana project have a lot of open issues and the main goal is to only have issues open if their still relevant. If you find an issue that you think already have been resolved or no longer is relevant please report by adding a comment and explain why you think it should be closed including related issues (`#<issue number>`), if applicable, and optionally mention one of the maintainers.
|
||||
|
||||
### Investigate issues
|
||||
|
||||
See [investigation of issues](#investigation-of-issues).
|
||||
|
||||
### Vote on enhancements/bugs
|
||||
|
||||
Helping the Grafana project to know which issues are most important by users and the community is crucial for the success of the project. Read more about [prioritizing issues](#4-prioritization-of-issues) for details about how issues are being prioritized. The Grafana project use GitGub issues and reactions for collecting votes on enhancement and bugs.
|
||||
|
||||
**Please don't add `+1` issue comments or similar since that will notify everyone that have subscribed to an issue and it doesn't add any useful update, rather it creates a bad .**
|
||||
|
||||
If you want to show your interest or importance of an issue, please use [GitHub's reactions](https://help.github.com/en/articles/about-conversations-on-github#reacting-to-ideas-in-comments).
|
||||
|
||||
### Report duplicates
|
||||
|
||||
If you find two issues describing the same bug/enhancement/feature please add a comment in one of the issue and explain which issues (`#<issue number>`) you think is a duplicate of another issue (`#<issue number>`).
|
||||
|
||||
### Suggest ideas for resolving bugs/enhancements
|
||||
|
||||
Related to how [issues are being prioritized](#4-prioritization-of-issues) it's important to help anyone that's interested in contributing code for resolving a bug or enhancement. This can be anything from getting started and setup the development environment to reference code and files where changes probably needs to be made and/or suggest ideas on how enhancements may function/be implemented.
|
||||
|
||||
Please read about how [help from the community](#5-requesting-help-from-the-community) may be requested when issues being triaged.
|
||||
|
||||
## 1. Find uncategorized issues
|
||||
|
||||
To get started with issue triage and finding issues that haven't been triaged you have two alternatives.
|
||||
|
||||
### Browse unlabeled issues
|
||||
|
||||
The easiest and straigt forward way of getting started and finding issues that haven't been triaged is to browse [unlabeled issues](https://github.com/grafana/grafana/issues?q=is%3Aopen+is%3Aissue+no%3Alabel) and starting from the bottom and working yourself to the top.
|
||||
|
||||
### Subscribe to all notifications
|
||||
|
||||
The more advanced, but recommended way is to subscribe to all notifications from this repository which means that all new issues, pull requests, comments and important status changes are sent to your configured email address. Read this [guide](https://help.github.com/en/articles/watching-and-unwatching-repositories#watching-a-single-repository) for help with setting this up.
|
||||
|
||||
It's highly recommended that you setup filters to automatically remove emails from the inbox and label/categorize them accordingly to make it easy for you to understand when you need to act upon a notification or where to look for finding issues that haven't been triaged etc.
|
||||
|
||||
Instructions for setting up filters in Gmail can be found [here](#setting-up-gmail-filters). Another alternative is to use [Trailer](https://github.com/ptsochantaris/trailer) or similar software.
|
||||
|
||||
## 2. Ensure the issue contains basic information
|
||||
|
||||
Before triaging an issue very far, make sure that the issue's author provided the standard issue information. This will help you make an educated recommendation on how to categorize the issue. The Grafana project utilizes [GitHub issue templates](https://help.github.com/en/articles/creating-issue-templates-for-your-repository) to guide contributors to provide standard information that must be included for each type of template or type of issue.
|
||||
|
||||
### Standard issue information that must be included
|
||||
|
||||
Given a certain [issue template]([template](https://github.com/grafana/grafana/issues/new/choose)) have been used by the issue author or depending how the issue is perceived by the issue triage responsible, the following should help you understand what standard issue information that must be included.
|
||||
|
||||
#### Bug report?
|
||||
|
||||
Should explain what happened, what was expected and how to reproduce it together with any additional information that may help giving a complete picture of what happened such as screenshots, [query inspector](https://community.grafana.com/t/using-grafanas-query-inspector-to-troubleshoot-issues/2630) output and any environment related information that's applicable and/or maybe related to the reported problem:
|
||||
- Grafana version
|
||||
- Data source type & version
|
||||
- Platform & OS Grafana is installed on
|
||||
- User OS & Browser + versions
|
||||
- Using docker + what environment
|
||||
- Which plugins
|
||||
- Configuration database in use (sqlite, mysql, postgres)
|
||||
- Reverse proxy in front of Grafana, what version and configuration
|
||||
- Non-default configuration settings
|
||||
- Development environment like Go and Node versions, if applicable
|
||||
|
||||
#### Enhancement request?
|
||||
|
||||
Should explain what enhancement or feature that the author wants to be added and why that is needed.
|
||||
|
||||
#### Accessibility issue?
|
||||
|
||||
This is a mix between a bug report and enhancement request but focused on accessibility issues to help make Grafana improve keyboard navigation, screen-reader support and being accessible to everyone. The report should include relevant WCAG criteria, if applicable.
|
||||
|
||||
#### Support request?
|
||||
|
||||
In general, if the issue description and title is perceived as a question no more information is needed.
|
||||
|
||||
### Good practices
|
||||
|
||||
To make it easier for everyone to understand and find issues they're searching for it's suggested as a general rule of thumbs to:
|
||||
|
||||
* Make sure that issue titles are named to explain the subject of the issue, has a correct spelling and doesn't include irrelevant information and/or sensitive information.
|
||||
* Make sure that issue descriptions doesn't include irrelevant information, information from template that haven't been filled out and/or sensitive information.
|
||||
* Do your best effort to change title and description or request suggested changes by adding a comment.
|
||||
|
||||
Note: Above rules is applicable to both new and existing issues of the Grafana project.
|
||||
|
||||
### Do you have all the information needed to categorize an issue?
|
||||
|
||||
Depending on the issue, you might not feel all this information is needed. Use your best judgement. If you cannot triage an issue using what its author provided, explain kindly to the author that they must provide the above information to clarify the problem. Label issue with `needs more detail` and add any related `area/*` or `datasource/*` labels.
|
||||
|
||||
If the author provides the standard information but you are still unable to triage the issue, request additional information. Do this kindly and politely because you are asking for more of the author's time.
|
||||
|
||||
If the author does not respond requested information within the timespan of a week, close the issue with a kind note stating that the author can request for the issue to be reopened when the necessary information is provided.
|
||||
|
||||
When you feel you have all the information needed you're ready to [categorizing the issue](#3-categorizing-an-issue).
|
||||
|
||||
## 3. Categorizing an issue
|
||||
|
||||
An issue can have multiple of the following labels. Typically, a properly categorized issue should at least have:
|
||||
|
||||
- One label identifying its type (`type/*`).
|
||||
- One or multiple labels identifying the functional areas of interest or component (`area/*`) and/or datasource (`datasource/*`), if applicable.
|
||||
|
||||
Label | Description
|
||||
------- | --------
|
||||
`type/bug` | A feature isn't working as expected given design or documentation.
|
||||
`type/feature-request` | Request for a new feature or enhancement.
|
||||
`type/docs` | Documentation problem or enhancement.
|
||||
`type/accessibility` | Accessibility problem or enhancement.
|
||||
`type/question` | Issue is or perceived as a question.
|
||||
`type/duplicate` | An existing issue of the same subject/request have already been reported.
|
||||
`type/works-as-intended` | A reported bug works as intended/by design.
|
||||
`type/build-packaging` | Build or packaging problem or enhancement.
|
||||
`area/*` | Subject is related to a functional area of interest or component.
|
||||
`datasource/*` | Subject is related to a core datasource plugin.
|
||||
|
||||
### Duplicate issue?
|
||||
|
||||
Make sure that it's not a duplicate by searching existing issues using related terms from the issue title and description. If you think you know there are an existing issue, but can't find it please reach out to one of the maintainers and ask for help. If you identify that the issue is a duplicate of an existing issue:
|
||||
|
||||
1. Add a comment `Duplicate of #<issue number>`. GitHub will recognize this and add some additional context to the issue activity.
|
||||
2. Close the issue and label it with `type/duplicate`.
|
||||
3. Optionally add any related `area/*` or `datasource/*` labels.
|
||||
4. If applicable, add a comment with additional information.
|
||||
|
||||
### Bug report?
|
||||
|
||||
If it's not perfectly clear that it's an actual bug, quickly try to reproduce it.
|
||||
|
||||
**It's a bug/it can be reproduced:**
|
||||
|
||||
1. Add a comment describing detailed steps for how to reproduce it, if applicable.
|
||||
2. Label the issue `type/bug` and at least one `area/*` or `datasource/*` label.
|
||||
3. If you know that maintainers wont be able to put any resources into it for some time then label the issue with `help wanted` and optionally `beginner friendly` together with pointers on which code to update to fix the bug. This should signal to the community that we would appreciate any help we can get to resolve this.
|
||||
4. Move on to [prioritizing the issue](#4-prioritization-of-issues).
|
||||
|
||||
**It can't be reproduced:**
|
||||
1. Either [ask for more information](#2-ensure-the-issue-contains-basic-information) needed to investigate it more thoroughly.
|
||||
2. Either [delegate further investigations](#investigation-of-issues) to someone else.
|
||||
|
||||
**It works as intended/by design:**
|
||||
1. Kindly and politely add a comment explaining briefly why we think it works as intended and close the issue.
|
||||
2. Label the issue `type/works-as-intended`.
|
||||
|
||||
### Enhancement/feature?
|
||||
|
||||
1. Label the issue `type/feature-request` and at least one `area/*` or `datasource/*` label.
|
||||
2. Move on to [prioritizing the issue](#4-prioritization-of-issues).
|
||||
|
||||
### Documentation issue?
|
||||
|
||||
First, evaluate if the documentation makes sense to be included in the Grafana project:
|
||||
|
||||
- Is this something we want/can maintain as a project?
|
||||
- Is this referring to usage of some specific integration/tool and in that case are those a popular use case in combination with Grafana?
|
||||
- If unsure, kindly and politely add a comment explaining that we would need [upvotes](https://help.github.com/en/articles/about-conversations-on-github#reacting-to-ideas-in-comments) to identify that lots of other users wants/needs this.
|
||||
|
||||
Second, label the issue `type/docs` and at least one `area/*` or `datasource/*` label.
|
||||
|
||||
**Minor typo/error/lack of information:**
|
||||
|
||||
There's a minor typo/error/lack of information that adds a lot of confusion for users and given the amount of work is a big win to make sure fixing it:
|
||||
1. Either update the documentation yourself and open a pull request.
|
||||
2. Either delegate the work to someone else by assigning that person to the issue and add the issue to next major/minor milestone.
|
||||
|
||||
**Major error/lack of information:**
|
||||
|
||||
1. Label the issue with `help wanted` and `beginner friendly`, if applicable, to signal that we find this important to fix and we would appreciate any help we can get from the community.
|
||||
2. Move on to [prioritizing the issue](#4-prioritization-of-issues).
|
||||
|
||||
### Accessibility issue?
|
||||
|
||||
1. Label the issue `type/accessibility` and at least one `area/*` or `datasource/*` label.
|
||||
|
||||
### Support request?
|
||||
|
||||
1. Kindly and politely direct the issue author to the [community site](https://community.grafana.com/) and explain that GitHub is mainly used for tracking bugs and feature requests. If possible, it's usually a good idea to add some pointers to the issue author's question.
|
||||
2. Close the issue and label it with `type/question`.
|
||||
|
||||
## 4. Prioritization of issues
|
||||
|
||||
In general bugs and enhancement issues should be labeled with a priority.
|
||||
|
||||
This is the most difficult thing with triaging issues since it requires a lot of knowledge, context and experience before being able to think of and start feel comfortable adding a certain priority label.
|
||||
|
||||
The key here is asking for help and discuss issues to understand how more experienced project members thinks and reason. By doing that you learn more and eventually be more and more comfortable with prioritizing issues.
|
||||
|
||||
In any case there are uncertainty around the priorization of an issue, please ask the maintainers for help.
|
||||
|
||||
Label | Description
|
||||
------- | --------
|
||||
`priority/critical` | Highest priority. Must be actively worked on as someone's top priority right now.
|
||||
`priority/support-subscription` | This is important for one or several customers having a paid Grafana support subscription.
|
||||
`priority/important-soon` | Must be staffed and worked on either currently, or very soon, ideally in time for the next release.
|
||||
`priority/important-longterm` | Important over the long term, but may not be staffed and/or may need multiple releases to complete.
|
||||
`priority/nice-to-have` | It's a good idea, but not scheduled for any release.
|
||||
`priority/awaiting-more-evidence` | Lowest priority. Possibly useful, but not yet enough interest in it.
|
||||
`priority/unscheduled` | Something to look into before and to be discussed during the planning of the next (upcoming) major/minor stable release.
|
||||
|
||||
**Critical bug?**
|
||||
|
||||
1. If a bug have been categorized and any of the following problems applies the bug should be labeled as critical and must be actively worked on as someone's top priority right now.
|
||||
|
||||
- Results in any data loss
|
||||
- Critical security or performance issues
|
||||
- Problem that makes a feature unusable
|
||||
- Multiple users experience a severe problem affecting their business, users etc.
|
||||
|
||||
2. Label the issue `priority/critical`.
|
||||
3. If applicable, label the issue `priority/support-subscription`.
|
||||
4. Add the issue to the next upcoming patch release milestone. Create a new milestone if there are none.
|
||||
5. Escalate the problem to the maintainers.
|
||||
6. Assign or ask a maintainer for help assigning someone to make this issue their top priority right now.
|
||||
|
||||
**Important short-term?**
|
||||
|
||||
1. Label the issue `priority/important-soon`.
|
||||
2. If applicable, label the issue `priority/support-subscription`.
|
||||
3. Add the issue to the next upcoming patch or major/minor stable release milestone. Ask maintainers for help if unsure if it's a patch or not. Create a new milestone if there are none.
|
||||
4. Make sure to add the issue to a suitable backlog of a GitHub project and prioritize it or assign someone to work on it now or very soon.
|
||||
5. Consider requesting [help from the community](#5-requesting-help-from-the-community), even though it may be problematic given a short amount of time until it should be released.
|
||||
|
||||
**Important long-term?**
|
||||
|
||||
1. Label the issue `priority/important-longterm`.
|
||||
2. Consider requesting [help from the community](#5-requesting-help-from-the-community).
|
||||
|
||||
**Nice to have?**
|
||||
|
||||
1. Label the issue `priority/nice-to-have`.
|
||||
2. Consider requesting [help from the community](#5-requesting-help-from-the-community).
|
||||
|
||||
**Not critical, but unsure?**
|
||||
|
||||
1. Label the issue `priority/unscheduled`.
|
||||
2. Consider requesting [help from the community](#5-requesting-help-from-the-community).
|
||||
|
||||
## 5. Requesting help from the community
|
||||
|
||||
Depending on the issue and/or priority, it's always a good idea to consider signalling to the community that help from community is appreciated and needed in case an issue is not prioritized to be worked on by maintainers. Use your best judgement. In general, when requesting help from the community it means a contribution has a good chance of getting accepted and merged.
|
||||
|
||||
In many cases the issue author or community as a whole is more suitable to contribute changes since they're experts in their domain. It's also quite common that someone has tried to get something to work using the documentation without success and made an effort to get it to work and/or reached out to the [community site](https://community.grafana.com/) to get the missing information. In especially these areas it's more likely that there exists experts in their own domain and usually a good idea to request help from contributors:
|
||||
|
||||
- Database setups
|
||||
- Authentication like OAuth providers and LDAP setups
|
||||
- Platform specific things
|
||||
- Reverse proxy setups
|
||||
- Alert notifiers
|
||||
|
||||
1. Kindly and politely add a comment to signal to users subscribed to updates of the issue.
|
||||
- Explain that the issue would be nice to get resolved, but it isn't prioritized to work on by maintainers for an unforseen future.
|
||||
- If possible or applicable, try to help contributors getting starting by adding pointers and references to what code/files need to be changed and/or ideas of a good way to solve/implement the issue.
|
||||
2. Label the issue with `help wanted`.
|
||||
3. If applicable, label the issue with `beginner friendly` to denote that the issue is suitable for a beginner to work on.
|
||||
4. If possible, try to estimate the amount of work by adding `effort/small`, `effort/medium` or `effort/large`.
|
||||
|
||||
## Investigation of issues
|
||||
|
||||
When an issue has all basic information provided, but the triage responsible haven't been able to reproduce the reported problem at a first glance, the issue is labeled [Needs investigation](https://github.com/grafana/grafana/labels/needs%20investigation). Depending of the perceived severity and/or number of [upvotes](https://help.github.com/en/articles/about-conversations-on-github#reacting-to-ideas-in-comments), the investigation will either be delegated to another maintainer for further investigation or either put on hold until someone else (maintainer or contributor) picks it up and eventually start investigating it.
|
||||
|
||||
Investigating issues can be a very time consuming task, especially for the maintainers given the huge number of combinations of plugins, datasources, platforms, databases, browsers, tools, hardware, integrations, versions and cloud services etc that are being used with Grafana. There are a certain amount of combinations that are more common than others and these are in general easier for maintainers to investigate.
|
||||
|
||||
For some other combinations there may not be possible at all for a maintainer to setup a proper test environment for being able to investigate. In these cases we really appreciate any help we can get from the community. Otherwise the issue is highly likely to be closed.
|
||||
|
||||
Even if you don't have the time or knowledge to investigate an issue we highly recommend that you [upvote](https://help.github.com/en/articles/about-conversations-on-github#reacting-to-ideas-in-comments) the issue if you happen to have the same problem. If you have further details that may help investigating the issue please provide as much information as possible.
|
||||
|
||||
## Appendix
|
||||
|
||||
### Setting up Gmail filters
|
||||
|
||||
If you're using Gmail it's highly recommened that you setup filters to automatically remove email from the inbox and label them accordingly to make it easy for you to understand when you need to act upon a notification or process all incoming issues that haven't been triaged.
|
||||
|
||||
This may be setup by personal preference, but here's a working configuration for reference.
|
||||
1. Follow instructions in [gist](https://gist.github.com/marefr/9167c2e31466f6316c1cba118874e74f)
|
||||
2. In Gmail, go to Settings -> Filters and Blocked Addresses
|
||||
3. Import filters -> select xml file -> Open file
|
||||
4. Review filters
|
||||
5. Optional, Check Apply new filters to existing email
|
||||
6. Create filters
|
||||
|
||||
This will give you a structure of labels in the sidebar similar to the following:
|
||||
```
|
||||
- Inbox
|
||||
...
|
||||
- Github (mine)
|
||||
- activity
|
||||
- assigned
|
||||
- mentions
|
||||
- Github (other)
|
||||
- Grafana
|
||||
```
|
||||
|
||||
* All notifications you’ll need to read/take action on shows up as unread in Github (mine) and its sub-labels.
|
||||
* All other notifications you don’t need to take action on shows up as unread in Github (other) and its sub-labels
|
||||
* This is convenient for issue triage and to follow the activity in the Grafana project.
|
||||
94
Makefile
94
Makefile
@@ -1,6 +1,10 @@
|
||||
-include local/Makefile
|
||||
|
||||
.PHONY: all deps-go deps-js deps build-go build-server build-cli build-js build build-docker-dev build-docker-full lint-go test-go test-js test run clean
|
||||
.PHONY: all deps-go deps-js deps build-go build-server build-cli build-js build build-docker-dev build-docker-full lint-go gosec revive golangci-lint go-vet test-go test-js test run clean devenv devenv-down revive-alerting
|
||||
|
||||
GO = GO111MODULE=on go
|
||||
GO_FILES ?= ./pkg/...
|
||||
SH_FILES ?= $(shell find ./scripts -name *.sh)
|
||||
|
||||
all: deps build
|
||||
|
||||
@@ -40,10 +44,6 @@ build-docker-full:
|
||||
@echo "build docker container"
|
||||
docker build --tag grafana/grafana:dev .
|
||||
|
||||
lint-go:
|
||||
@echo "lint go source"
|
||||
scripts/backend-lint.sh
|
||||
|
||||
test-go:
|
||||
@echo "test backend"
|
||||
GO111MODULE=on go test -v ./pkg/...
|
||||
@@ -54,10 +54,6 @@ test-js:
|
||||
|
||||
test: test-go test-js
|
||||
|
||||
run:
|
||||
@echo "start a server"
|
||||
./bin/grafana-server
|
||||
|
||||
clean:
|
||||
@echo "cleaning"
|
||||
rm -rf node_modules
|
||||
@@ -66,3 +62,83 @@ clean:
|
||||
node_modules: package.json yarn.lock
|
||||
@echo "install frontend dependencies"
|
||||
yarn install --pure-lockfile --no-progress
|
||||
|
||||
scripts/go/bin/revive: scripts/go/go.mod
|
||||
@cd scripts/go; \
|
||||
$(GO) build -o ./bin/revive github.com/mgechev/revive
|
||||
|
||||
scripts/go/bin/gosec: scripts/go/go.mod
|
||||
@cd scripts/go; \
|
||||
$(GO) build -o ./bin/gosec github.com/securego/gosec/cmd/gosec
|
||||
|
||||
scripts/go/bin/bra: scripts/go/go.mod
|
||||
@cd scripts/go; \
|
||||
$(GO) build -o ./bin/bra github.com/Unknwon/bra
|
||||
|
||||
scripts/go/bin/golangci-lint: scripts/go/go.mod
|
||||
@cd scripts/go; \
|
||||
$(GO) build -o ./bin/golangci-lint github.com/golangci/golangci-lint/cmd/golangci-lint
|
||||
|
||||
revive: scripts/go/bin/revive
|
||||
@echo "lint via revive"
|
||||
@scripts/go/bin/revive \
|
||||
-formatter stylish \
|
||||
-config ./scripts/go/configs/revive.toml \
|
||||
$(GO_FILES)
|
||||
|
||||
revive-alerting: scripts/go/bin/revive
|
||||
@echo "lint alerting via revive"
|
||||
@scripts/go/bin/revive \
|
||||
-formatter stylish \
|
||||
./pkg/services/alerting/...
|
||||
|
||||
# TODO recheck the rules and leave only necessary exclusions
|
||||
gosec: scripts/go/bin/gosec
|
||||
@echo "lint via gosec"
|
||||
@scripts/go/bin/gosec -quiet \
|
||||
-exclude=G104,G107,G201,G202,G204,G301,G304,G401,G402,G501 \
|
||||
-conf=./scripts/go/configs/gosec.json \
|
||||
$(GO_FILES)
|
||||
|
||||
golangci-lint: scripts/go/bin/golangci-lint
|
||||
@echo "lint via golangci-lint"
|
||||
@scripts/go/bin/golangci-lint run \
|
||||
--config ./scripts/go/configs/.golangci.yml \
|
||||
$(GO_FILES)
|
||||
|
||||
go-vet:
|
||||
@echo "lint via go vet"
|
||||
@go vet $(GO_FILES)
|
||||
|
||||
lint-go: go-vet golangci-lint revive revive-alerting gosec
|
||||
|
||||
# with disabled SC1071 we are ignored some TCL,Expect `/usr/bin/env expect` scripts
|
||||
shellcheck: $(SH_FILES)
|
||||
@docker run --rm -v "$$PWD:/mnt" koalaman/shellcheck:stable \
|
||||
$(SH_FILES) -e SC1071
|
||||
|
||||
run: scripts/go/bin/bra
|
||||
@scripts/go/bin/bra run
|
||||
|
||||
# create docker-compose file with provided sources and start them
|
||||
# example: make devenv sources=postgres,openldap
|
||||
ifeq ($(sources),)
|
||||
devenv:
|
||||
@printf 'You have to define sources for this command \nexample: make devenv sources=postgres,openldap\n'
|
||||
else
|
||||
devenv: devenv-down
|
||||
$(eval targets := $(shell echo '$(sources)' | tr "," " "))
|
||||
|
||||
@cd devenv; \
|
||||
./create_docker_compose.sh $(targets) || \
|
||||
(rm -rf docker-compose.yaml; exit 1)
|
||||
|
||||
@cd devenv; \
|
||||
docker-compose up -d --build
|
||||
endif
|
||||
|
||||
# drop down the envs
|
||||
devenv-down:
|
||||
@cd devenv; \
|
||||
test -f docker-compose.yaml && \
|
||||
docker-compose down || exit 0;
|
||||
|
||||
70
README.md
70
README.md
@@ -1,5 +1,5 @@
|
||||
[Grafana](https://grafana.com) [](https://circleci.com/gh/grafana/grafana) [](https://goreportcard.com/report/github.com/grafana/grafana) [](https://codecov.io/gh/grafana/grafana)
|
||||
================
|
||||
# [Grafana](https://grafana.com) [](https://circleci.com/gh/grafana/grafana) [](https://goreportcard.com/report/github.com/grafana/grafana) [](https://codecov.io/gh/grafana/grafana)
|
||||
|
||||
[Website](https://grafana.com) |
|
||||
[Twitter](https://twitter.com/grafana) |
|
||||
[Community & Forum](https://community.grafana.com)
|
||||
@@ -12,19 +12,21 @@ Graphite, Elasticsearch, OpenTSDB, Prometheus and InfluxDB.
|
||||
-->
|
||||
|
||||
## Installation
|
||||
|
||||
Head to [docs.grafana.org](http://docs.grafana.org/installation/) for documentation or [download](https://grafana.com/get) to get the latest release.
|
||||
|
||||
## Documentation & Support
|
||||
|
||||
Be sure to read the [getting started guide](http://docs.grafana.org/guides/gettingstarted/) and the other feature guides.
|
||||
|
||||
## Run from master
|
||||
|
||||
If you want to build a package yourself, or contribute - here is a guide for how to do that. You can always find
|
||||
the latest master builds [here](https://grafana.com/grafana/download)
|
||||
|
||||
### Dependencies
|
||||
|
||||
- Go (Latest Stable)
|
||||
- bra [`go get github.com/Unknwon/bra`]
|
||||
- Node.js LTS
|
||||
- yarn [`npm install -g yarn`]
|
||||
|
||||
@@ -37,23 +39,6 @@ go get github.com/grafana/grafana
|
||||
cd $GOPATH/src/github.com/grafana/grafana
|
||||
```
|
||||
|
||||
### Building
|
||||
|
||||
#### The backend
|
||||
|
||||
```bash
|
||||
go run build.go setup
|
||||
go run build.go build
|
||||
```
|
||||
|
||||
#### Frontend assets
|
||||
|
||||
*For this you need Node.js (LTS version).*
|
||||
|
||||
```bash
|
||||
yarn install --pure-lockfile
|
||||
```
|
||||
|
||||
### Run and rebuild on source change
|
||||
|
||||
#### Backend
|
||||
@@ -61,7 +46,7 @@ yarn install --pure-lockfile
|
||||
To run the backend and rebuild on source change:
|
||||
|
||||
```bash
|
||||
$GOPATH/bin/bra run
|
||||
make run
|
||||
```
|
||||
|
||||
#### Frontend
|
||||
@@ -80,7 +65,7 @@ yarn start:hot
|
||||
env GRAFANA_THEME=light yarn start:hot
|
||||
```
|
||||
|
||||
*Note: HMR for Angular is not supported. If you edit files in the Angular part of the app, the whole page will reload.*
|
||||
_Note: HMR for Angular is not supported. If you edit files in the Angular part of the app, the whole page will reload._
|
||||
|
||||
Run tests and rebuild on source change:
|
||||
|
||||
@@ -90,6 +75,23 @@ yarn jest
|
||||
|
||||
**Open grafana in your browser (default: e.g. `http://localhost:3000`) and login with admin user (default: `user/pass = admin/admin`).**
|
||||
|
||||
### Building
|
||||
|
||||
#### The backend
|
||||
|
||||
```bash
|
||||
go run build.go setup
|
||||
go run build.go build
|
||||
```
|
||||
|
||||
#### Frontend assets
|
||||
|
||||
_For this you need Node.js (LTS version)._
|
||||
|
||||
```bash
|
||||
yarn install --pure-lockfile
|
||||
```
|
||||
|
||||
### Building a Docker image
|
||||
|
||||
There are two different ways to build a Grafana docker image. If your machine is setup for Grafana development and you run linux/amd64 you can build just the image. Otherwise, there is the option to build Grafana completely within Docker.
|
||||
@@ -128,7 +130,9 @@ In your custom.ini uncomment (remove the leading `;`) sign. And set `app_mode =
|
||||
### Running tests
|
||||
|
||||
#### Frontend
|
||||
|
||||
Execute all frontend tests
|
||||
|
||||
```bash
|
||||
yarn test
|
||||
```
|
||||
@@ -139,6 +143,7 @@ Writing & watching frontend tests
|
||||
- Jest will run all test files that end with the name ".test.ts"
|
||||
|
||||
#### Backend
|
||||
|
||||
```bash
|
||||
# Run Golang tests using sqlite3 as database (default)
|
||||
go test ./pkg/...
|
||||
@@ -150,6 +155,26 @@ GRAFANA_TEST_DB=mysql go test ./pkg/...
|
||||
GRAFANA_TEST_DB=postgres go test ./pkg/...
|
||||
```
|
||||
|
||||
#### End-to-end
|
||||
|
||||
Execute all end-to-end tests
|
||||
|
||||
```bash
|
||||
yarn e2e-tests
|
||||
```
|
||||
|
||||
Execute all end-to-end tests using using a specific url
|
||||
|
||||
```bash
|
||||
ENV BASE_URL=http://localhost:3333 yarn e2e-tests
|
||||
```
|
||||
|
||||
Debugging all end-to-end tests (BROWSER=1 will start the browser and SLOWMO=1 will delay each puppeteer operation by 100ms)
|
||||
|
||||
```bash
|
||||
ENV BROWSER=1 SLOWMO=1 yarn e2e-tests
|
||||
```
|
||||
|
||||
### Datasource and dashboard provisioning
|
||||
|
||||
[Here](https://github.com/grafana/grafana/tree/master/devenv) you can find helpful scripts and docker-compose setup
|
||||
@@ -171,4 +196,3 @@ plugin development.
|
||||
## License
|
||||
|
||||
Grafana is distributed under [Apache 2.0 License](https://github.com/grafana/grafana/blob/master/LICENSE).
|
||||
|
||||
|
||||
17
SECURITY.md
Normal file
17
SECURITY.md
Normal file
@@ -0,0 +1,17 @@
|
||||
Reporting Security Issues
|
||||
------------------
|
||||
|
||||
If you think you have found a security vulnerability, please send a report to [security@grafana.com](mailto:security@grafana.com). This address can be used for all of Grafana Labs's open source and commercial products (including but not limited to Grafana, Grafana Cloud, Grafana Enterprise, and grafana.com). We can accept only vulnerability reports at this address. We would prefer that you encrypt your message to us; please use our PGP key. The key fingerprint is:
|
||||
|
||||
F988 7BEA 027A 049F AE8E 5CAA D125 8932 BE24 C5CA
|
||||
|
||||
The key is available from [pgp.mit.edu](https://pgp.mit.edu/pks/lookup?op=get&search=0xF9887BEA027A049FAE8E5CAAD1258932BE24C5CA) by searching for [grafana](https://pgp.mit.edu/pks/lookup?search=grafana&op=index).
|
||||
|
||||
Grafana Labs will send you a response indicating the next steps in handling your report. After the initial reply to your report, the security team will keep you informed of the progress towards a fix and full announcement, and may ask for additional information or guidance.
|
||||
|
||||
**Important:** We ask you to not disclose the vulnerability before it have been fixed and announced, unless you have got a response from the Grafana Labs security team that you can do that.
|
||||
|
||||
### Security Announcements
|
||||
|
||||
We maintain a category on the community site called [Security Announcements](https://community.grafana.com/c/security-announcements),
|
||||
where we will post a summary, remediation, and mitigation details for any patch containing security fixes. You can also subscribe to email updates to this category if you have a grafana.com account and sign on to the community site or track updates via an [RSS feed](https://community.grafana.com/c/security-announcements.rss).
|
||||
9
SUPPORT.md
Normal file
9
SUPPORT.md
Normal file
@@ -0,0 +1,9 @@
|
||||
Need help or support?
|
||||
------------------
|
||||
|
||||
**Please note:**
|
||||
- Only submit issues for bug reports, feature requests or enhancements.
|
||||
- Grafana project uses GitHub mainly for tracking bugs and feature requests.
|
||||
- Asking a question by opening an issue will directly result in issue being closed.
|
||||
|
||||
If you require help or support then ask a question and/or find existing questions/answers in the [Grafana community site](https://community.grafana.com/).
|
||||
@@ -22,18 +22,30 @@ The Grafana project uses [Go modules](https://golang.org/cmd/go/#hdr-Modules__mo
|
||||
|
||||
All dependencies are vendored in the `vendor/` directory.
|
||||
|
||||
_Note:_ Since most developers of Grafana still use the `GOPATH` we need to specify `GO111MODULE=on` to make `go mod` and `got get` work as intended. If you have setup Grafana outside of the `GOPATH` on your machine you can skip `GO111MODULE=on` when running the commands below.
|
||||
|
||||
To add or update a new dependency, use the `go get` command:
|
||||
|
||||
```bash
|
||||
# The GO111MODULE variable can be omitted when the code isn't located in GOPATH.
|
||||
# Pick the latest tagged release.
|
||||
go get example.com/some/module/pkg
|
||||
GO111MODULE=on go get example.com/some/module/pkg
|
||||
|
||||
# Pick a specific version.
|
||||
go get example.com/some/module/pkg@vX.Y.Z
|
||||
GO111MODULE=on go get example.com/some/module/pkg@vX.Y.Z
|
||||
```
|
||||
|
||||
Tidy up the `go.mod` and `go.sum` files and copy the new/updated dependency to the `vendor/` directory:
|
||||
|
||||
```bash
|
||||
# The GO111MODULE variable can be omitted when the code isn't located in GOPATH.
|
||||
GO111MODULE=on go mod tidy
|
||||
|
||||
GO111MODULE=on go mod vendor
|
||||
```
|
||||
|
||||
You have to commit the changes to `go.mod`, `go.sum` and the `vendor/` directory before submitting the pull request.
|
||||
|
||||
## Node.js Dependencies
|
||||
|
||||
Updated using `yarn`.
|
||||
@@ -60,7 +72,7 @@ Our builds run on CircleCI through our build script.
|
||||
|
||||
The main build step (in CircleCI) is built using a custom build container that comes pre-baked with some of the necessary dependencies.
|
||||
|
||||
Link: [grafana-build-container](https://github.com/grafana/grafana-build-container)
|
||||
Link: [grafana/build-container](https://github.com/grafana/grafana/tree/master/scripts/build/ci-build)
|
||||
|
||||
#### Dependencies
|
||||
|
||||
|
||||
53
build.go
53
build.go
@@ -43,7 +43,9 @@ var (
|
||||
workingDir string
|
||||
includeBuildId bool = true
|
||||
buildId string = "0"
|
||||
binaries []string = []string{"grafana-server", "grafana-cli"}
|
||||
serverBinary string = "grafana-server"
|
||||
cliBinary string = "grafana-cli"
|
||||
binaries []string = []string{serverBinary, cliBinary}
|
||||
isDev bool = false
|
||||
enterprise bool = false
|
||||
skipRpmGen bool = false
|
||||
@@ -230,6 +232,7 @@ type linuxPackageOptions struct {
|
||||
packageType string
|
||||
packageArch string
|
||||
homeDir string
|
||||
homeBinDir string
|
||||
binPath string
|
||||
serverBinPath string
|
||||
cliBinPath string
|
||||
@@ -240,10 +243,11 @@ type linuxPackageOptions struct {
|
||||
initdScriptFilePath string
|
||||
systemdServiceFilePath string
|
||||
|
||||
postinstSrc string
|
||||
initdScriptSrc string
|
||||
defaultFileSrc string
|
||||
systemdFileSrc string
|
||||
postinstSrc string
|
||||
initdScriptSrc string
|
||||
defaultFileSrc string
|
||||
systemdFileSrc string
|
||||
cliBinaryWrapperSrc string
|
||||
|
||||
depends []string
|
||||
}
|
||||
@@ -258,6 +262,7 @@ func createDebPackages() {
|
||||
packageType: "deb",
|
||||
packageArch: debPkgArch,
|
||||
homeDir: "/usr/share/grafana",
|
||||
homeBinDir: "/usr/share/grafana/bin",
|
||||
binPath: "/usr/sbin",
|
||||
configDir: "/etc/grafana",
|
||||
etcDefaultPath: "/etc/default",
|
||||
@@ -265,10 +270,11 @@ func createDebPackages() {
|
||||
initdScriptFilePath: "/etc/init.d/grafana-server",
|
||||
systemdServiceFilePath: "/usr/lib/systemd/system/grafana-server.service",
|
||||
|
||||
postinstSrc: "packaging/deb/control/postinst",
|
||||
initdScriptSrc: "packaging/deb/init.d/grafana-server",
|
||||
defaultFileSrc: "packaging/deb/default/grafana-server",
|
||||
systemdFileSrc: "packaging/deb/systemd/grafana-server.service",
|
||||
postinstSrc: "packaging/deb/control/postinst",
|
||||
initdScriptSrc: "packaging/deb/init.d/grafana-server",
|
||||
defaultFileSrc: "packaging/deb/default/grafana-server",
|
||||
systemdFileSrc: "packaging/deb/systemd/grafana-server.service",
|
||||
cliBinaryWrapperSrc: "packaging/wrappers/grafana-cli",
|
||||
|
||||
depends: []string{"adduser", "libfontconfig1"},
|
||||
})
|
||||
@@ -286,6 +292,7 @@ func createRpmPackages() {
|
||||
packageType: "rpm",
|
||||
packageArch: rpmPkgArch,
|
||||
homeDir: "/usr/share/grafana",
|
||||
homeBinDir: "/usr/share/grafana/bin",
|
||||
binPath: "/usr/sbin",
|
||||
configDir: "/etc/grafana",
|
||||
etcDefaultPath: "/etc/sysconfig",
|
||||
@@ -293,10 +300,11 @@ func createRpmPackages() {
|
||||
initdScriptFilePath: "/etc/init.d/grafana-server",
|
||||
systemdServiceFilePath: "/usr/lib/systemd/system/grafana-server.service",
|
||||
|
||||
postinstSrc: "packaging/rpm/control/postinst",
|
||||
initdScriptSrc: "packaging/rpm/init.d/grafana-server",
|
||||
defaultFileSrc: "packaging/rpm/sysconfig/grafana-server",
|
||||
systemdFileSrc: "packaging/rpm/systemd/grafana-server.service",
|
||||
postinstSrc: "packaging/rpm/control/postinst",
|
||||
initdScriptSrc: "packaging/rpm/init.d/grafana-server",
|
||||
defaultFileSrc: "packaging/rpm/sysconfig/grafana-server",
|
||||
systemdFileSrc: "packaging/rpm/systemd/grafana-server.service",
|
||||
cliBinaryWrapperSrc: "packaging/wrappers/grafana-cli",
|
||||
|
||||
depends: []string{"/sbin/service", "fontconfig", "freetype", "urw-fonts"},
|
||||
})
|
||||
@@ -323,10 +331,12 @@ func createPackage(options linuxPackageOptions) {
|
||||
runPrint("mkdir", "-p", filepath.Join(packageRoot, "/usr/lib/systemd/system"))
|
||||
runPrint("mkdir", "-p", filepath.Join(packageRoot, "/usr/sbin"))
|
||||
|
||||
// copy binary
|
||||
for _, binary := range binaries {
|
||||
runPrint("cp", "-p", filepath.Join(workingDir, "tmp/bin/"+binary), filepath.Join(packageRoot, "/usr/sbin/"+binary))
|
||||
}
|
||||
// copy grafana-cli wrapper
|
||||
runPrint("cp", "-p", options.cliBinaryWrapperSrc, filepath.Join(packageRoot, "/usr/sbin/"+cliBinary))
|
||||
|
||||
// copy grafana-server binary
|
||||
runPrint("cp", "-p", filepath.Join(workingDir, "tmp/bin/"+serverBinary), filepath.Join(packageRoot, "/usr/sbin/"+serverBinary))
|
||||
|
||||
// copy init.d script
|
||||
runPrint("cp", "-p", options.initdScriptSrc, filepath.Join(packageRoot, options.initdScriptFilePath))
|
||||
// copy environment var file
|
||||
@@ -338,6 +348,13 @@ func createPackage(options linuxPackageOptions) {
|
||||
// remove bin path
|
||||
runPrint("rm", "-rf", filepath.Join(packageRoot, options.homeDir, "bin"))
|
||||
|
||||
// create /bin within home
|
||||
runPrint("mkdir", "-p", filepath.Join(packageRoot, options.homeBinDir))
|
||||
// The grafana-cli binary is exposed through a wrapper to ensure a proper
|
||||
// configuration is in place. To enable that, we need to store the original
|
||||
// binary in a separate location to avoid conflicts.
|
||||
runPrint("cp", "-p", filepath.Join(workingDir, "tmp/bin/"+cliBinary), filepath.Join(packageRoot, options.homeBinDir, cliBinary))
|
||||
|
||||
args := []string{
|
||||
"-s", "dir",
|
||||
"--description", "Grafana",
|
||||
@@ -391,7 +408,7 @@ func createPackage(options linuxPackageOptions) {
|
||||
args = append(args, "--iteration", linuxPackageIteration)
|
||||
}
|
||||
|
||||
// add dependenciesj
|
||||
// add dependencies
|
||||
for _, dep := range options.depends {
|
||||
args = append(args, "--depends", dep)
|
||||
}
|
||||
|
||||
@@ -47,6 +47,9 @@ enforce_domain = false
|
||||
# The full public facing url
|
||||
root_url = %(protocol)s://%(domain)s:%(http_port)s/
|
||||
|
||||
# Serve Grafana from subpath specified in `root_url` setting. By default it is set to `false` for compatibility reasons.
|
||||
serve_from_sub_path = false
|
||||
|
||||
# Log web requests
|
||||
router_logging = false
|
||||
|
||||
@@ -113,7 +116,7 @@ type = database
|
||||
|
||||
# cache connectionstring options
|
||||
# database: will use Grafana primary database.
|
||||
# redis: config like redis server e.g. `addr=127.0.0.1:6379,pool_size=100,db=grafana`
|
||||
# redis: config like redis server e.g. `addr=127.0.0.1:6379,pool_size=100,db=0`. Only addr is required.
|
||||
# memcache: 127.0.0.1:11211
|
||||
connstr =
|
||||
|
||||
@@ -179,6 +182,31 @@ cookie_samesite = lax
|
||||
# set to true if you want to allow browsers to render Grafana in a <frame>, <iframe>, <embed> or <object>. default is false.
|
||||
allow_embedding = false
|
||||
|
||||
# Set to true if you want to enable http strict transport security (HSTS) response header.
|
||||
# This is only sent when HTTPS is enabled in this configuration.
|
||||
# HSTS tells browsers that the site should only be accessed using HTTPS.
|
||||
# The default will change to true in the next minor release, 6.3.
|
||||
strict_transport_security = false
|
||||
|
||||
# Sets how long a browser should cache HSTS. Only applied if strict_transport_security is enabled.
|
||||
strict_transport_security_max_age_seconds = 86400
|
||||
|
||||
# Set to true if to enable HSTS preloading option. Only applied if strict_transport_security is enabled.
|
||||
strict_transport_security_preload = false
|
||||
|
||||
# Set to true if to enable the HSTS includeSubDomains option. Only applied if strict_transport_security is enabled.
|
||||
strict_transport_security_subdomains = false
|
||||
|
||||
# Set to true to enable the X-Content-Type-Options response header.
|
||||
# The X-Content-Type-Options response HTTP header is a marker used by the server to indicate that the MIME types advertised
|
||||
# in the Content-Type headers should not be changed and be followed. The default will change to true in the next minor release, 6.3.
|
||||
x_content_type_options = false
|
||||
|
||||
# Set to true to enable the X-XSS-Protection header, which tells browsers to stop pages from loading
|
||||
# when they detect reflected cross-site scripting (XSS) attacks. The default will change to true in the next minor release, 6.3.
|
||||
x_xss_protection = false
|
||||
|
||||
|
||||
#################################### Snapshots ###########################
|
||||
[snapshots]
|
||||
# snapshot sharing options
|
||||
@@ -259,6 +287,9 @@ signout_redirect_url =
|
||||
# This setting is ignored if multiple OAuth providers are configured.
|
||||
oauth_auto_login = false
|
||||
|
||||
# limit of api_key seconds to live before expiration
|
||||
api_key_max_seconds_to_live = -1
|
||||
|
||||
#################################### Anonymous Auth ######################
|
||||
[auth.anonymous]
|
||||
# enable anonymous access
|
||||
@@ -346,6 +377,47 @@ tls_client_key =
|
||||
tls_client_ca =
|
||||
send_client_credentials_via_post = false
|
||||
|
||||
#################################### SAML Auth ###########################
|
||||
[auth.saml] # Enterprise only
|
||||
# Defaults to false. If true, the feature is enabled
|
||||
enabled = false
|
||||
|
||||
# Base64-encoded public X.509 certificate. Used to sign requests to the IdP
|
||||
certificate =
|
||||
|
||||
# Path to the public X.509 certificate. Used to sign requests to the IdP
|
||||
certificate_path =
|
||||
|
||||
# Base64-encoded private key. Used to decrypt assertions from the IdP
|
||||
private_key =
|
||||
|
||||
# Path to the private key. Used to decrypt assertions from the IdP
|
||||
private_key_path =
|
||||
|
||||
# Base64-encoded IdP SAML metadata XML. Used to verify and obtain binding locations from the IdP
|
||||
idp_metadata =
|
||||
|
||||
# Path to the SAML metadata XML. Used to verify and obtain binding locations from the IdP
|
||||
idp_metadata_path =
|
||||
|
||||
# URL to fetch SAML IdP metadata. Used to verify and obtain binding locations from the IdP
|
||||
idp_metadata_url =
|
||||
|
||||
# Duration, since the IdP issued a response and the SP is allowed to process it. Defaults to 90 seconds
|
||||
max_issue_delay = 90s
|
||||
|
||||
# Duration, for how long the SP's metadata should be valid. Defaults to 48 hours
|
||||
metadata_valid_duration = 48h
|
||||
|
||||
# Friendly name or name of the attribute within the SAML assertion to use as the user's name
|
||||
assertion_attribute_name = displayName
|
||||
|
||||
# Friendly name or name of the attribute within the SAML assertion to use as the user's login handle
|
||||
assertion_attribute_login = mail
|
||||
|
||||
# Friendly name or name of the attribute within the SAML assertion to use as the user's email
|
||||
assertion_attribute_email = mail
|
||||
|
||||
#################################### Basic Auth ##########################
|
||||
[auth.basic]
|
||||
enabled = true
|
||||
@@ -367,8 +439,9 @@ config_file = /etc/grafana/ldap.toml
|
||||
allow_sign_up = true
|
||||
|
||||
# LDAP backround sync (Enterprise only)
|
||||
sync_cron = @hourly
|
||||
active_sync_enabled = false
|
||||
# At 1 am every day
|
||||
sync_cron = "0 0 1 * * *"
|
||||
active_sync_enabled = true
|
||||
|
||||
#################################### SMTP / Emailing #####################
|
||||
[smtp]
|
||||
@@ -550,6 +623,11 @@ sampler_type = const
|
||||
# and indicates the initial sampling rate before the actual one
|
||||
# is received from the mothership
|
||||
sampler_param = 1
|
||||
# Whether or not to use Zipkin span propagation (x-b3- HTTP headers).
|
||||
zipkin_propagation = false
|
||||
# Setting this to true disables shared RPC spans.
|
||||
# Not disabling is the most common setting when using Zipkin elsewhere in your infrastructure.
|
||||
disable_shared_zipkin_spans = false
|
||||
|
||||
#################################### External Image Storage ##############
|
||||
[external_image_storage]
|
||||
|
||||
53
conf/ldap_multiple.toml
Normal file
53
conf/ldap_multiple.toml
Normal file
@@ -0,0 +1,53 @@
|
||||
# --- First LDAP Server ---
|
||||
|
||||
[[servers]]
|
||||
host = "10.0.0.1"
|
||||
port = 389
|
||||
use_ssl = false
|
||||
start_tls = false
|
||||
ssl_skip_verify = false
|
||||
bind_dn = "cn=admin,dc=grafana,dc=org"
|
||||
bind_password = 'grafana'
|
||||
search_filter = "(cn=%s)"
|
||||
search_base_dns = ["ou=users,dc=grafana,dc=org"]
|
||||
|
||||
[servers.attributes]
|
||||
name = "givenName"
|
||||
surname = "sn"
|
||||
username = "cn"
|
||||
member_of = "memberOf"
|
||||
email = "email"
|
||||
|
||||
[[servers.group_mappings]]
|
||||
group_dn = "cn=admins,ou=groups,dc=grafana,dc=org"
|
||||
org_role = "Admin"
|
||||
grafana_admin = true
|
||||
|
||||
# --- Second LDAP Server ---
|
||||
|
||||
[[servers]]
|
||||
host = "10.0.0.2"
|
||||
port = 389
|
||||
use_ssl = false
|
||||
start_tls = false
|
||||
ssl_skip_verify = false
|
||||
|
||||
bind_dn = "cn=admin,dc=grafana,dc=org"
|
||||
bind_password = 'grafana'
|
||||
search_filter = "(cn=%s)"
|
||||
search_base_dns = ["ou=users,dc=grafana,dc=org"]
|
||||
|
||||
[servers.attributes]
|
||||
name = "givenName"
|
||||
surname = "sn"
|
||||
username = "cn"
|
||||
member_of = "memberOf"
|
||||
email = "email"
|
||||
|
||||
[[servers.group_mappings]]
|
||||
group_dn = "cn=editors,ou=groups,dc=grafana,dc=org"
|
||||
org_role = "Editor"
|
||||
|
||||
[[servers.group_mappings]]
|
||||
group_dn = "*"
|
||||
org_role = "Viewer"
|
||||
@@ -48,6 +48,9 @@
|
||||
# If you use reverse proxy and sub path specify full url (with sub path)
|
||||
;root_url = http://localhost:3000
|
||||
|
||||
# Serve Grafana from subpath specified in `root_url` setting. By default it is set to `false` for compatibility reasons.
|
||||
;serve_from_sub_path = false
|
||||
|
||||
# Log web requests
|
||||
;router_logging = false
|
||||
|
||||
@@ -97,7 +100,7 @@
|
||||
;conn_max_lifetime = 14400
|
||||
|
||||
# Set to true to log the sql calls and execution times.
|
||||
log_queries =
|
||||
;log_queries =
|
||||
|
||||
# For "sqlite3" only. cache mode setting used for connecting to the database. (private, shared)
|
||||
;cache_mode = private
|
||||
@@ -109,7 +112,7 @@ log_queries =
|
||||
|
||||
# cache connectionstring options
|
||||
# database: will use Grafana primary database.
|
||||
# redis: config like redis server e.g. `addr=127.0.0.1:6379,pool_size=100,db=grafana`
|
||||
# redis: config like redis server e.g. `addr=127.0.0.1:6379,pool_size=100,db=0`. Only addr is required.
|
||||
# memcache: 127.0.0.1:11211
|
||||
;connstr =
|
||||
|
||||
@@ -175,6 +178,30 @@ log_queries =
|
||||
# set to true if you want to allow browsers to render Grafana in a <frame>, <iframe>, <embed> or <object>. default is false.
|
||||
;allow_embedding = false
|
||||
|
||||
# Set to true if you want to enable http strict transport security (HSTS) response header.
|
||||
# This is only sent when HTTPS is enabled in this configuration.
|
||||
# HSTS tells browsers that the site should only be accessed using HTTPS.
|
||||
# The default version will change to true in the next minor release, 6.3.
|
||||
;strict_transport_security = false
|
||||
|
||||
# Sets how long a browser should cache HSTS. Only applied if strict_transport_security is enabled.
|
||||
;strict_transport_security_max_age_seconds = 86400
|
||||
|
||||
# Set to true if to enable HSTS preloading option. Only applied if strict_transport_security is enabled.
|
||||
;strict_transport_security_preload = false
|
||||
|
||||
# Set to true if to enable the HSTS includeSubDomains option. Only applied if strict_transport_security is enabled.
|
||||
;strict_transport_security_subdomains = false
|
||||
|
||||
# Set to true to enable the X-Content-Type-Options response header.
|
||||
# The X-Content-Type-Options response HTTP header is a marker used by the server to indicate that the MIME types advertised
|
||||
# in the Content-Type headers should not be changed and be followed. The default will change to true in the next minor release, 6.3.
|
||||
;x_content_type_options = false
|
||||
|
||||
# Set to true to enable the X-XSS-Protection header, which tells browsers to stop pages from loading
|
||||
# when they detect reflected cross-site scripting (XSS) attacks. The default will change to true in the next minor release, 6.3.
|
||||
;x_xss_protection = false
|
||||
|
||||
#################################### Snapshots ###########################
|
||||
[snapshots]
|
||||
# snapshot sharing options
|
||||
@@ -306,6 +333,47 @@ log_queries =
|
||||
; This might be required if the OAuth provider is not RFC6749 compliant, only supporting credentials passed via POST payload
|
||||
;send_client_credentials_via_post = false
|
||||
|
||||
#################################### SAML Auth ###########################
|
||||
[auth.saml] # Enterprise only
|
||||
# Defaults to false. If true, the feature is enabled.
|
||||
;enabled = false
|
||||
|
||||
# Base64-encoded public X.509 certificate. Used to sign requests to the IdP
|
||||
;certificate =
|
||||
|
||||
# Path to the public X.509 certificate. Used to sign requests to the IdP
|
||||
;certificate_path =
|
||||
|
||||
# Base64-encoded private key. Used to decrypt assertions from the IdP
|
||||
;private_key =
|
||||
|
||||
;# Path to the private key. Used to decrypt assertions from the IdP
|
||||
;private_key_path =
|
||||
|
||||
# Base64-encoded IdP SAML metadata XML. Used to verify and obtain binding locations from the IdP
|
||||
;idp_metadata =
|
||||
|
||||
# Path to the SAML metadata XML. Used to verify and obtain binding locations from the IdP
|
||||
;idp_metadata_path =
|
||||
|
||||
# URL to fetch SAML IdP metadata. Used to verify and obtain binding locations from the IdP
|
||||
;idp_metadata_url =
|
||||
|
||||
# Duration, since the IdP issued a response and the SP is allowed to process it. Defaults to 90 seconds.
|
||||
;max_issue_delay = 90s
|
||||
|
||||
# Duration, for how long the SP's metadata should be valid. Defaults to 48 hours.
|
||||
;metadata_valid_duration = 48h
|
||||
|
||||
# Friendly name or name of the attribute within the SAML assertion to use as the user's name
|
||||
;assertion_attribute_name = displayName
|
||||
|
||||
# Friendly name or name of the attribute within the SAML assertion to use as the user's login handle
|
||||
;assertion_attribute_login = mail
|
||||
|
||||
# Friendly name or name of the attribute within the SAML assertion to use as the user's email
|
||||
;assertion_attribute_email = mail
|
||||
|
||||
#################################### Grafana.com Auth ####################
|
||||
[auth.grafana_com]
|
||||
;enabled = false
|
||||
@@ -335,6 +403,11 @@ log_queries =
|
||||
;config_file = /etc/grafana/ldap.toml
|
||||
;allow_sign_up = true
|
||||
|
||||
# LDAP backround sync (Enterprise only)
|
||||
# At 1 am every day
|
||||
;sync_cron = "0 0 1 * * *"
|
||||
;active_sync_enabled = true
|
||||
|
||||
#################################### SMTP / Emailing ##########################
|
||||
[smtp]
|
||||
;enabled = false
|
||||
@@ -473,6 +546,11 @@ log_queries =
|
||||
# and indicates the initial sampling rate before the actual one
|
||||
# is received from the mothership
|
||||
;sampler_param = 1
|
||||
# Whether or not to use Zipkin propagation (x-b3- HTTP headers).
|
||||
;zipkin_propagation = false
|
||||
# Setting this to true disables shared RPC spans.
|
||||
# Not disabling is the most common setting when using Zipkin elsewhere in your infrastructure.
|
||||
;disable_shared_zipkin_spans = false
|
||||
|
||||
#################################### Grafana.com integration ##########################
|
||||
# Url used to import dashboards directly from Grafana.com
|
||||
@@ -527,4 +605,3 @@ log_queries =
|
||||
[plugins]
|
||||
;enable_alpha = false
|
||||
;app_tls_skip_verify_insecure = false
|
||||
|
||||
|
||||
@@ -1,10 +1,11 @@
|
||||
|
||||
apiVersion: 1
|
||||
|
||||
datasources:
|
||||
- name: gdev-graphite
|
||||
type: graphite
|
||||
access: proxy
|
||||
url: http://localhost:8080
|
||||
url: http://localhost:8180
|
||||
jsonData:
|
||||
graphiteVersion: "1.1"
|
||||
|
||||
@@ -13,6 +14,11 @@ datasources:
|
||||
access: proxy
|
||||
url: http://localhost:9090
|
||||
|
||||
- name: gdev-slow-prometheus
|
||||
type: prometheus
|
||||
access: proxy
|
||||
url: http://localhost:3011
|
||||
|
||||
- name: gdev-testdata
|
||||
type: testdata
|
||||
isDefault: true
|
||||
@@ -28,6 +34,17 @@ datasources:
|
||||
secureJsonData:
|
||||
password: grafana
|
||||
|
||||
- name: gdev-influxdb-telegraf
|
||||
type: influxdb
|
||||
access: proxy
|
||||
database: telegraf
|
||||
user: grafana
|
||||
url: http://localhost:8086
|
||||
jsonData:
|
||||
timeInterval: "10s"
|
||||
secureJsonData:
|
||||
password: grafana
|
||||
|
||||
- name: gdev-opentsdb
|
||||
type: opentsdb
|
||||
access: proxy
|
||||
@@ -136,6 +153,20 @@ datasources:
|
||||
interval: Daily
|
||||
timeField: "@timestamp"
|
||||
esVersion: 70
|
||||
timeInterval: "10s"
|
||||
logMessageField: message
|
||||
logLevelField: fields.level
|
||||
|
||||
- name: gdev-elasticsearch-v7-metricbeat
|
||||
type: elasticsearch
|
||||
access: proxy
|
||||
database: "[metricbeat-]YYYY.MM.DD"
|
||||
url: http://localhost:12200
|
||||
jsonData:
|
||||
interval: Daily
|
||||
timeField: "@timestamp"
|
||||
esVersion: 70
|
||||
timeInterval: "10s"
|
||||
|
||||
- name: gdev-mysql
|
||||
type: mysql
|
||||
|
||||
2213
devenv/dev-dashboards/panel-common/lazy_loading.json
Normal file
2213
devenv/dev-dashboards/panel-common/lazy_loading.json
Normal file
File diff suppressed because it is too large
Load Diff
@@ -21,79 +21,62 @@
|
||||
"datasource": "gdev-testdata",
|
||||
"gridPos": {
|
||||
"h": 8,
|
||||
"w": 24,
|
||||
"w": 20,
|
||||
"x": 0,
|
||||
"y": 0
|
||||
},
|
||||
"id": 6,
|
||||
"links": [],
|
||||
"options-gauge": {
|
||||
"decimals": 0,
|
||||
"maxValue": 100,
|
||||
"minValue": 0,
|
||||
"options": {
|
||||
"decimals": 0,
|
||||
"maxValue": 100,
|
||||
"minValue": 0,
|
||||
"prefix": "",
|
||||
"showThresholdLabels": false,
|
||||
"showThresholdMarkers": true,
|
||||
"stat": "avg",
|
||||
"suffix": "",
|
||||
"thresholds": [],
|
||||
"unit": "none",
|
||||
"valueMappings": []
|
||||
"options": {
|
||||
"fieldOptions": {
|
||||
"calcs": ["mean"],
|
||||
"defaults": {
|
||||
"decimals": 0,
|
||||
"max": 100,
|
||||
"min": 0,
|
||||
"unit": "none"
|
||||
},
|
||||
"mappings": [],
|
||||
"override": {},
|
||||
"thresholds": [
|
||||
{
|
||||
"color": "#7EB26D",
|
||||
"index": 0,
|
||||
"value": null
|
||||
},
|
||||
{
|
||||
"color": "#EAB839",
|
||||
"index": 1,
|
||||
"value": 50
|
||||
},
|
||||
{
|
||||
"color": "#6ED0E0",
|
||||
"index": 2,
|
||||
"value": 75
|
||||
},
|
||||
{
|
||||
"color": "#EF843C",
|
||||
"index": 3,
|
||||
"value": 87.5
|
||||
},
|
||||
{
|
||||
"color": "#E24D42",
|
||||
"index": 4,
|
||||
"value": 93.75
|
||||
},
|
||||
{
|
||||
"color": "#1F78C1",
|
||||
"index": 5,
|
||||
"value": 96.875
|
||||
}
|
||||
],
|
||||
"values": false
|
||||
},
|
||||
"prefix": "",
|
||||
"orientation": "auto",
|
||||
"showThresholdLabels": false,
|
||||
"showThresholdMarkers": true,
|
||||
"stat": "avg",
|
||||
"suffix": "",
|
||||
"thresholds": [
|
||||
{
|
||||
"color": "#1F78C1",
|
||||
"index": 5,
|
||||
"value": 96.875
|
||||
},
|
||||
{
|
||||
"color": "#E24D42",
|
||||
"index": 4,
|
||||
"value": 93.75
|
||||
},
|
||||
{
|
||||
"color": "#EF843C",
|
||||
"index": 3,
|
||||
"value": 87.5
|
||||
},
|
||||
{
|
||||
"color": "#6ED0E0",
|
||||
"index": 2,
|
||||
"value": 75
|
||||
},
|
||||
{
|
||||
"color": "#EAB839",
|
||||
"index": 1,
|
||||
"value": 50
|
||||
},
|
||||
{
|
||||
"color": "#7EB26D",
|
||||
"index": 0,
|
||||
"value": null
|
||||
}
|
||||
],
|
||||
"unit": "none",
|
||||
"valueMappings": [
|
||||
{
|
||||
"from": "50",
|
||||
"id": 1,
|
||||
"operator": "",
|
||||
"text": "Hello :) ",
|
||||
"to": "90",
|
||||
"type": 2,
|
||||
"value": ""
|
||||
}
|
||||
]
|
||||
"showThresholdMarkers": true
|
||||
},
|
||||
"pluginVersion": "6.3.0-pre",
|
||||
"targets": [
|
||||
{
|
||||
"refId": "A",
|
||||
@@ -124,129 +107,48 @@
|
||||
{
|
||||
"datasource": "gdev-testdata",
|
||||
"gridPos": {
|
||||
"h": 8,
|
||||
"w": 24,
|
||||
"x": 0,
|
||||
"y": 8
|
||||
},
|
||||
"id": 2,
|
||||
"links": [],
|
||||
"options-gauge": {
|
||||
"decimals": 0,
|
||||
"maxValue": 100,
|
||||
"minValue": 0,
|
||||
"options": {
|
||||
"decimals": 0,
|
||||
"maxValue": 100,
|
||||
"minValue": 0,
|
||||
"prefix": "",
|
||||
"showThresholdLabels": false,
|
||||
"showThresholdMarkers": true,
|
||||
"stat": "avg",
|
||||
"suffix": "",
|
||||
"thresholds": [],
|
||||
"unit": "none",
|
||||
"valueMappings": []
|
||||
},
|
||||
"prefix": "",
|
||||
"showThresholdLabels": false,
|
||||
"showThresholdMarkers": true,
|
||||
"stat": "avg",
|
||||
"suffix": "",
|
||||
"thresholds": [
|
||||
{
|
||||
"color": "#EAB839",
|
||||
"index": 1,
|
||||
"value": 50
|
||||
},
|
||||
{
|
||||
"color": "#7EB26D",
|
||||
"index": 0,
|
||||
"value": null
|
||||
}
|
||||
],
|
||||
"unit": "none",
|
||||
"valueMappings": []
|
||||
},
|
||||
"targets": [
|
||||
{
|
||||
"refId": "A",
|
||||
"scenarioId": "random_walk"
|
||||
},
|
||||
{
|
||||
"refId": "B",
|
||||
"scenarioId": "random_walk"
|
||||
},
|
||||
{
|
||||
"refId": "C",
|
||||
"scenarioId": "random_walk"
|
||||
},
|
||||
{
|
||||
"refId": "D",
|
||||
"scenarioId": "random_walk"
|
||||
},
|
||||
{
|
||||
"refId": "E",
|
||||
"scenarioId": "random_walk"
|
||||
}
|
||||
],
|
||||
"timeFrom": null,
|
||||
"timeShift": null,
|
||||
"title": "Repeat horizontal",
|
||||
"type": "gauge"
|
||||
},
|
||||
{
|
||||
"datasource": "gdev-testdata",
|
||||
"gridPos": {
|
||||
"h": 14,
|
||||
"w": 5,
|
||||
"x": 0,
|
||||
"y": 16
|
||||
"h": 28,
|
||||
"w": 4,
|
||||
"x": 20,
|
||||
"y": 0
|
||||
},
|
||||
"id": 4,
|
||||
"links": [],
|
||||
"options-gauge": {
|
||||
"decimals": 0,
|
||||
"maxValue": "200",
|
||||
"minValue": 0,
|
||||
"options": {
|
||||
"decimals": 0,
|
||||
"maxValue": 100,
|
||||
"minValue": 0,
|
||||
"prefix": "",
|
||||
"showThresholdLabels": false,
|
||||
"showThresholdMarkers": true,
|
||||
"stat": "avg",
|
||||
"suffix": "",
|
||||
"thresholds": [],
|
||||
"unit": "none",
|
||||
"valueMappings": []
|
||||
"options": {
|
||||
"fieldOptions": {
|
||||
"calcs": ["max"],
|
||||
"defaults": {
|
||||
"decimals": 0,
|
||||
"max": "200",
|
||||
"min": 0,
|
||||
"unit": "none"
|
||||
},
|
||||
"mappings": [],
|
||||
"override": {},
|
||||
"thresholds": [
|
||||
{
|
||||
"color": "#7EB26D",
|
||||
"index": 0,
|
||||
"value": null
|
||||
},
|
||||
{
|
||||
"color": "#EAB839",
|
||||
"index": 1,
|
||||
"value": 50
|
||||
},
|
||||
{
|
||||
"color": "#6ED0E0",
|
||||
"index": 2,
|
||||
"value": 75
|
||||
}
|
||||
],
|
||||
"values": false
|
||||
},
|
||||
"prefix": "",
|
||||
"orientation": "auto",
|
||||
"showThresholdLabels": false,
|
||||
"showThresholdMarkers": true,
|
||||
"stat": "max",
|
||||
"suffix": "",
|
||||
"thresholds": [
|
||||
{
|
||||
"color": "#6ED0E0",
|
||||
"index": 2,
|
||||
"value": 75
|
||||
},
|
||||
{
|
||||
"color": "#EAB839",
|
||||
"index": 1,
|
||||
"value": 50
|
||||
},
|
||||
{
|
||||
"color": "#7EB26D",
|
||||
"index": 0,
|
||||
"value": null
|
||||
}
|
||||
],
|
||||
"unit": "none",
|
||||
"valueMappings": []
|
||||
"showThresholdMarkers": true
|
||||
},
|
||||
"pluginVersion": "6.3.0-pre",
|
||||
"targets": [
|
||||
{
|
||||
"refId": "A",
|
||||
@@ -273,9 +175,76 @@
|
||||
"timeShift": null,
|
||||
"title": "Vertical",
|
||||
"type": "gauge"
|
||||
},
|
||||
{
|
||||
"datasource": "gdev-testdata",
|
||||
"gridPos": {
|
||||
"h": 20,
|
||||
"w": 20,
|
||||
"x": 0,
|
||||
"y": 8
|
||||
},
|
||||
"id": 2,
|
||||
"links": [],
|
||||
"options": {
|
||||
"fieldOptions": {
|
||||
"calcs": ["mean"],
|
||||
"defaults": {
|
||||
"decimals": 0,
|
||||
"max": 100,
|
||||
"min": 0,
|
||||
"unit": "none"
|
||||
},
|
||||
"mappings": [],
|
||||
"override": {},
|
||||
"thresholds": [
|
||||
{
|
||||
"color": "#7EB26D",
|
||||
"index": 0,
|
||||
"value": null
|
||||
},
|
||||
{
|
||||
"color": "#EAB839",
|
||||
"index": 1,
|
||||
"value": 50
|
||||
}
|
||||
],
|
||||
"values": false
|
||||
},
|
||||
"orientation": "auto",
|
||||
"showThresholdLabels": false,
|
||||
"showThresholdMarkers": true
|
||||
},
|
||||
"pluginVersion": "6.3.0-pre",
|
||||
"targets": [
|
||||
{
|
||||
"refId": "A",
|
||||
"scenarioId": "random_walk"
|
||||
},
|
||||
{
|
||||
"refId": "B",
|
||||
"scenarioId": "random_walk"
|
||||
},
|
||||
{
|
||||
"refId": "C",
|
||||
"scenarioId": "random_walk"
|
||||
},
|
||||
{
|
||||
"refId": "D",
|
||||
"scenarioId": "random_walk"
|
||||
},
|
||||
{
|
||||
"refId": "E",
|
||||
"scenarioId": "random_walk"
|
||||
}
|
||||
],
|
||||
"timeFrom": null,
|
||||
"timeShift": null,
|
||||
"title": "Repeat horizontal",
|
||||
"type": "gauge"
|
||||
}
|
||||
],
|
||||
"schemaVersion": 17,
|
||||
"schemaVersion": 18,
|
||||
"style": "dark",
|
||||
"tags": ["panel-tests", "gdev", "gauge"],
|
||||
"templating": {
|
||||
@@ -292,5 +261,5 @@
|
||||
"timezone": "",
|
||||
"title": "Panel Tests - Gauge Multi Series",
|
||||
"uid": "szkuR1umk",
|
||||
"version": 7
|
||||
"version": 2
|
||||
}
|
||||
|
||||
383
devenv/dev-dashboards/panel-graph/graph-gradient-area-fills.json
Normal file
383
devenv/dev-dashboards/panel-graph/graph-gradient-area-fills.json
Normal file
@@ -0,0 +1,383 @@
|
||||
{
|
||||
"annotations": {
|
||||
"list": [
|
||||
{
|
||||
"builtIn": 1,
|
||||
"datasource": "-- Grafana --",
|
||||
"enable": true,
|
||||
"hide": true,
|
||||
"iconColor": "rgba(0, 211, 255, 1)",
|
||||
"name": "Annotations & Alerts",
|
||||
"type": "dashboard"
|
||||
}
|
||||
]
|
||||
},
|
||||
"editable": true,
|
||||
"gnetId": null,
|
||||
"graphTooltip": 0,
|
||||
"links": [],
|
||||
"panels": [
|
||||
{
|
||||
"aliasColors": {
|
||||
"A-series": "rgb(48, 139, 237)"
|
||||
},
|
||||
"bars": false,
|
||||
"dashLength": 10,
|
||||
"dashes": false,
|
||||
"fill": 1,
|
||||
"fillGradient": 5,
|
||||
"gridPos": {
|
||||
"h": 8,
|
||||
"w": 11,
|
||||
"x": 0,
|
||||
"y": 0
|
||||
},
|
||||
"id": 2,
|
||||
"interval": "1m",
|
||||
"legend": {
|
||||
"avg": false,
|
||||
"current": false,
|
||||
"max": false,
|
||||
"min": false,
|
||||
"show": false,
|
||||
"total": false,
|
||||
"values": false
|
||||
},
|
||||
"lines": true,
|
||||
"linewidth": 2,
|
||||
"links": [],
|
||||
"nullPointMode": "null",
|
||||
"options": {},
|
||||
"percentage": false,
|
||||
"pointradius": 2,
|
||||
"points": false,
|
||||
"renderer": "flot",
|
||||
"seriesOverrides": [],
|
||||
"spaceLength": 10,
|
||||
"stack": false,
|
||||
"steppedLine": false,
|
||||
"targets": [
|
||||
{
|
||||
"refId": "A",
|
||||
"scenarioId": "random_walk"
|
||||
}
|
||||
],
|
||||
"thresholds": [],
|
||||
"timeFrom": null,
|
||||
"timeRegions": [],
|
||||
"timeShift": null,
|
||||
"title": "Req/s",
|
||||
"tooltip": {
|
||||
"shared": true,
|
||||
"sort": 0,
|
||||
"value_type": "individual"
|
||||
},
|
||||
"type": "graph",
|
||||
"xaxis": {
|
||||
"buckets": null,
|
||||
"mode": "time",
|
||||
"name": null,
|
||||
"show": true,
|
||||
"values": []
|
||||
},
|
||||
"yaxes": [
|
||||
{
|
||||
"format": "short",
|
||||
"label": null,
|
||||
"logBase": 1,
|
||||
"max": null,
|
||||
"min": null,
|
||||
"show": true
|
||||
},
|
||||
{
|
||||
"format": "short",
|
||||
"label": null,
|
||||
"logBase": 1,
|
||||
"max": null,
|
||||
"min": null,
|
||||
"show": true
|
||||
}
|
||||
],
|
||||
"yaxis": {
|
||||
"align": false,
|
||||
"alignLevel": null
|
||||
}
|
||||
},
|
||||
{
|
||||
"aliasColors": {
|
||||
"A-series": "rgb(87, 186, 242)"
|
||||
},
|
||||
"bars": false,
|
||||
"dashLength": 10,
|
||||
"dashes": false,
|
||||
"fill": 4,
|
||||
"fillGradient": 4,
|
||||
"gridPos": {
|
||||
"h": 15,
|
||||
"w": 13,
|
||||
"x": 11,
|
||||
"y": 0
|
||||
},
|
||||
"id": 11,
|
||||
"interval": "1m",
|
||||
"legend": {
|
||||
"avg": false,
|
||||
"current": false,
|
||||
"max": false,
|
||||
"min": false,
|
||||
"show": true,
|
||||
"total": false,
|
||||
"values": false
|
||||
},
|
||||
"lines": true,
|
||||
"linewidth": 1,
|
||||
"links": [],
|
||||
"nullPointMode": "null",
|
||||
"options": {},
|
||||
"percentage": false,
|
||||
"pointradius": 2,
|
||||
"points": false,
|
||||
"renderer": "flot",
|
||||
"seriesOverrides": [],
|
||||
"spaceLength": 10,
|
||||
"stack": false,
|
||||
"steppedLine": false,
|
||||
"targets": [
|
||||
{
|
||||
"refId": "A",
|
||||
"scenarioId": "random_walk"
|
||||
}
|
||||
],
|
||||
"thresholds": [],
|
||||
"timeFrom": null,
|
||||
"timeRegions": [],
|
||||
"timeShift": null,
|
||||
"title": "Req/s",
|
||||
"tooltip": {
|
||||
"shared": true,
|
||||
"sort": 0,
|
||||
"value_type": "individual"
|
||||
},
|
||||
"type": "graph",
|
||||
"xaxis": {
|
||||
"buckets": null,
|
||||
"mode": "time",
|
||||
"name": null,
|
||||
"show": true,
|
||||
"values": []
|
||||
},
|
||||
"yaxes": [
|
||||
{
|
||||
"format": "short",
|
||||
"label": null,
|
||||
"logBase": 1,
|
||||
"max": null,
|
||||
"min": null,
|
||||
"show": true
|
||||
},
|
||||
{
|
||||
"format": "short",
|
||||
"label": null,
|
||||
"logBase": 1,
|
||||
"max": null,
|
||||
"min": null,
|
||||
"show": true
|
||||
}
|
||||
],
|
||||
"yaxis": {
|
||||
"align": false,
|
||||
"alignLevel": null
|
||||
}
|
||||
},
|
||||
{
|
||||
"aliasColors": {
|
||||
"A-series": "red"
|
||||
},
|
||||
"bars": false,
|
||||
"dashLength": 10,
|
||||
"dashes": false,
|
||||
"fill": 1,
|
||||
"fillGradient": 5,
|
||||
"gridPos": {
|
||||
"h": 7,
|
||||
"w": 11,
|
||||
"x": 0,
|
||||
"y": 8
|
||||
},
|
||||
"id": 7,
|
||||
"interval": "1m",
|
||||
"legend": {
|
||||
"avg": false,
|
||||
"current": false,
|
||||
"max": false,
|
||||
"min": false,
|
||||
"show": false,
|
||||
"total": false,
|
||||
"values": false
|
||||
},
|
||||
"lines": true,
|
||||
"linewidth": 1,
|
||||
"links": [],
|
||||
"nullPointMode": "null",
|
||||
"options": {},
|
||||
"percentage": false,
|
||||
"pointradius": 2,
|
||||
"points": false,
|
||||
"renderer": "flot",
|
||||
"seriesOverrides": [],
|
||||
"spaceLength": 10,
|
||||
"stack": false,
|
||||
"steppedLine": false,
|
||||
"targets": [
|
||||
{
|
||||
"refId": "A",
|
||||
"scenarioId": "random_walk"
|
||||
}
|
||||
],
|
||||
"thresholds": [],
|
||||
"timeFrom": null,
|
||||
"timeRegions": [],
|
||||
"timeShift": null,
|
||||
"title": "Memory",
|
||||
"tooltip": {
|
||||
"shared": true,
|
||||
"sort": 0,
|
||||
"value_type": "individual"
|
||||
},
|
||||
"type": "graph",
|
||||
"xaxis": {
|
||||
"buckets": null,
|
||||
"mode": "time",
|
||||
"name": null,
|
||||
"show": true,
|
||||
"values": []
|
||||
},
|
||||
"yaxes": [
|
||||
{
|
||||
"format": "decgbytes",
|
||||
"label": null,
|
||||
"logBase": 1,
|
||||
"max": null,
|
||||
"min": null,
|
||||
"show": true
|
||||
},
|
||||
{
|
||||
"format": "short",
|
||||
"label": null,
|
||||
"logBase": 1,
|
||||
"max": null,
|
||||
"min": null,
|
||||
"show": true
|
||||
}
|
||||
],
|
||||
"yaxis": {
|
||||
"align": false,
|
||||
"alignLevel": null
|
||||
}
|
||||
},
|
||||
{
|
||||
"aliasColors": {
|
||||
"A-series": "green"
|
||||
},
|
||||
"bars": false,
|
||||
"dashLength": 10,
|
||||
"dashes": false,
|
||||
"fill": 2,
|
||||
"fillGradient": 10,
|
||||
"gridPos": {
|
||||
"h": 8,
|
||||
"w": 24,
|
||||
"x": 0,
|
||||
"y": 15
|
||||
},
|
||||
"id": 10,
|
||||
"interval": "1m",
|
||||
"legend": {
|
||||
"avg": false,
|
||||
"current": false,
|
||||
"max": false,
|
||||
"min": false,
|
||||
"show": false,
|
||||
"total": false,
|
||||
"values": false
|
||||
},
|
||||
"lines": true,
|
||||
"linewidth": 0,
|
||||
"links": [],
|
||||
"nullPointMode": "null",
|
||||
"options": {},
|
||||
"percentage": false,
|
||||
"pointradius": 2,
|
||||
"points": false,
|
||||
"renderer": "flot",
|
||||
"seriesOverrides": [],
|
||||
"spaceLength": 10,
|
||||
"stack": false,
|
||||
"steppedLine": false,
|
||||
"targets": [
|
||||
{
|
||||
"refId": "A",
|
||||
"scenarioId": "random_walk"
|
||||
}
|
||||
],
|
||||
"thresholds": [],
|
||||
"timeFrom": null,
|
||||
"timeRegions": [],
|
||||
"timeShift": null,
|
||||
"title": "Req/s",
|
||||
"tooltip": {
|
||||
"shared": true,
|
||||
"sort": 0,
|
||||
"value_type": "individual"
|
||||
},
|
||||
"type": "graph",
|
||||
"xaxis": {
|
||||
"buckets": null,
|
||||
"mode": "time",
|
||||
"name": null,
|
||||
"show": true,
|
||||
"values": []
|
||||
},
|
||||
"yaxes": [
|
||||
{
|
||||
"format": "short",
|
||||
"label": null,
|
||||
"logBase": 1,
|
||||
"max": null,
|
||||
"min": null,
|
||||
"show": true
|
||||
},
|
||||
{
|
||||
"format": "short",
|
||||
"label": null,
|
||||
"logBase": 1,
|
||||
"max": null,
|
||||
"min": null,
|
||||
"show": true
|
||||
}
|
||||
],
|
||||
"yaxis": {
|
||||
"align": false,
|
||||
"alignLevel": null
|
||||
}
|
||||
}
|
||||
],
|
||||
"schemaVersion": 18,
|
||||
"style": "dark",
|
||||
"tags": ["gdev", "panel-tests", "graph"],
|
||||
"templating": {
|
||||
"list": []
|
||||
},
|
||||
"time": {
|
||||
"from": "now-6h",
|
||||
"to": "now"
|
||||
},
|
||||
"timepicker": {
|
||||
"refresh_intervals": ["5s", "10s", "30s", "1m", "5m", "15m", "30m", "1h", "2h", "1d"],
|
||||
"time_options": ["5m", "15m", "1h", "6h", "12h", "24h", "2d", "7d", "30d"]
|
||||
},
|
||||
"timezone": "",
|
||||
"title": "Panel Tests - Graph - Gradient Area Fills",
|
||||
"uid": "37Dq903mk",
|
||||
"version": 25
|
||||
}
|
||||
@@ -21,3 +21,19 @@
|
||||
- ./docker/blocks/elastic7/filebeat.yml:/usr/share/filebeat/filebeat.yml:ro
|
||||
- /var/log:/var/log:ro
|
||||
- ../data/log:/var/log/grafana:ro
|
||||
|
||||
metricbeat7:
|
||||
image: docker.elastic.co/beats/metricbeat-oss:7.0.0
|
||||
network_mode: host
|
||||
command: metricbeat -e -strict.perms=false
|
||||
user: root
|
||||
volumes:
|
||||
- ./docker/blocks/elastic7/metricbeat.yml:/usr/share/metricbeat/metricbeat.yml:ro
|
||||
- /var/run/docker.sock:/var/run/docker.sock:ro
|
||||
|
||||
kibana7:
|
||||
image: docker.elastic.co/kibana/kibana-oss:7.0.0
|
||||
ports:
|
||||
- "5601:5601"
|
||||
environment:
|
||||
ELASTICSEARCH_HOSTS: http://elasticsearch7:9200
|
||||
|
||||
38
devenv/docker/blocks/elastic7/metricbeat.yml
Normal file
38
devenv/docker/blocks/elastic7/metricbeat.yml
Normal file
@@ -0,0 +1,38 @@
|
||||
metricbeat.config:
|
||||
modules:
|
||||
path: ${path.config}/modules.d/*.yml
|
||||
# Reload module configs as they change:
|
||||
reload.enabled: false
|
||||
|
||||
metricbeat.autodiscover:
|
||||
providers:
|
||||
- type: docker
|
||||
hints.enabled: true
|
||||
|
||||
metricbeat.modules:
|
||||
- module: docker
|
||||
metricsets:
|
||||
- "container"
|
||||
- "cpu"
|
||||
- "diskio"
|
||||
- "healthcheck"
|
||||
- "info"
|
||||
#- "image"
|
||||
- "memory"
|
||||
- "network"
|
||||
hosts: ["unix:///var/run/docker.sock"]
|
||||
period: 10s
|
||||
enabled: true
|
||||
|
||||
processors:
|
||||
- add_cloud_metadata: ~
|
||||
|
||||
output.elasticsearch:
|
||||
hosts: ["localhost:12200"]
|
||||
index: "metricbeat-%{+yyyy.MM.dd}"
|
||||
|
||||
setup.template.name: "metricbeat"
|
||||
setup.template.pattern: "metricbeat-*"
|
||||
setup.template.settings:
|
||||
index.number_of_shards: 1
|
||||
index.number_of_replicas: 1
|
||||
@@ -1,5 +1,5 @@
|
||||
influxdb:
|
||||
image: influxdb:latest
|
||||
image: influxdb:1.7.6
|
||||
container_name: influxdb
|
||||
ports:
|
||||
- '2004:2004'
|
||||
@@ -15,3 +15,13 @@
|
||||
environment:
|
||||
FD_DATASOURCE: influxdb
|
||||
FD_PORT: 8086
|
||||
|
||||
telegraf:
|
||||
image: telegraf:1.10.4
|
||||
links:
|
||||
- influxdb
|
||||
volumes:
|
||||
- ./docker/blocks/influxdb/telegraf.conf:/etc/telegraf/telegraf.conf:ro
|
||||
- /var/log:/var/log
|
||||
- ../data/log:/var/log/grafana
|
||||
|
||||
|
||||
5265
devenv/docker/blocks/influxdb/telegraf.conf
Normal file
5265
devenv/docker/blocks/influxdb/telegraf.conf
Normal file
File diff suppressed because it is too large
Load Diff
@@ -0,0 +1,30 @@
|
||||
# Fork of https://github.com/dinkel/docker-openldap
|
||||
|
||||
FROM debian:jessie
|
||||
|
||||
LABEL maintainer="Grafana team <hello@grafana.com>"
|
||||
|
||||
ENV OPENLDAP_VERSION 2.4.40
|
||||
|
||||
RUN apt-get update && \
|
||||
DEBIAN_FRONTEND=noninteractive apt-get install --no-install-recommends -y \
|
||||
slapd=${OPENLDAP_VERSION}* \
|
||||
ldap-utils && \
|
||||
apt-get clean && \
|
||||
rm -rf /var/lib/apt/lists/*
|
||||
|
||||
RUN mv /etc/ldap /etc/ldap.dist
|
||||
|
||||
EXPOSE 389
|
||||
|
||||
VOLUME ["/etc/ldap", "/var/lib/ldap"]
|
||||
|
||||
COPY admins-ldap-server/modules/ /etc/ldap.dist/modules
|
||||
COPY admins-ldap-server/prepopulate/ /etc/ldap.dist/prepopulate
|
||||
|
||||
COPY ./entrypoint.sh /entrypoint.sh
|
||||
COPY ./prepopulate.sh /prepopulate.sh
|
||||
|
||||
ENTRYPOINT ["/entrypoint.sh"]
|
||||
|
||||
CMD ["slapd", "-d", "32768", "-u", "openldap", "-g", "openldap"]
|
||||
@@ -0,0 +1,33 @@
|
||||
dn: cn=module,cn=config
|
||||
cn: module
|
||||
objectClass: olcModuleList
|
||||
objectClass: top
|
||||
olcModulePath: /usr/lib/ldap
|
||||
olcModuleLoad: memberof.la
|
||||
|
||||
dn: olcOverlay={0}memberof,olcDatabase={1}hdb,cn=config
|
||||
objectClass: olcConfig
|
||||
objectClass: olcMemberOf
|
||||
objectClass: olcOverlayConfig
|
||||
objectClass: top
|
||||
olcOverlay: memberof
|
||||
olcMemberOfDangling: ignore
|
||||
olcMemberOfRefInt: TRUE
|
||||
olcMemberOfGroupOC: groupOfNames
|
||||
olcMemberOfMemberAD: member
|
||||
olcMemberOfMemberOfAD: memberOf
|
||||
|
||||
dn: cn=module,cn=config
|
||||
cn: module
|
||||
objectClass: olcModuleList
|
||||
objectClass: top
|
||||
olcModulePath: /usr/lib/ldap
|
||||
olcModuleLoad: refint.la
|
||||
|
||||
dn: olcOverlay={1}refint,olcDatabase={1}hdb,cn=config
|
||||
objectClass: olcConfig
|
||||
objectClass: olcOverlayConfig
|
||||
objectClass: olcRefintConfig
|
||||
objectClass: top
|
||||
olcOverlay: {1}refint
|
||||
olcRefintAttribute: memberof member manager owner
|
||||
@@ -0,0 +1,9 @@
|
||||
dn: ou=groups,dc=grafana,dc=org
|
||||
ou: Groups
|
||||
objectclass: top
|
||||
objectclass: organizationalUnit
|
||||
|
||||
dn: ou=users,dc=grafana,dc=org
|
||||
ou: Users
|
||||
objectclass: top
|
||||
objectclass: organizationalUnit
|
||||
@@ -0,0 +1,20 @@
|
||||
# ldap-admin
|
||||
dn: cn=ldap-admin,ou=users,dc=grafana,dc=org
|
||||
mail: ldap-admin@grafana.com
|
||||
userPassword: grafana
|
||||
objectClass: person
|
||||
objectClass: top
|
||||
objectClass: inetOrgPerson
|
||||
objectClass: organizationalPerson
|
||||
sn: ldap-admin
|
||||
cn: ldap-admin
|
||||
|
||||
dn: cn=ldap-torkel,ou=users,dc=grafana,dc=org
|
||||
mail: ldap-torkel@grafana.com
|
||||
userPassword: grafana
|
||||
objectClass: person
|
||||
objectClass: top
|
||||
objectClass: inetOrgPerson
|
||||
objectClass: organizationalPerson
|
||||
sn: ldap-torkel
|
||||
cn: ldap-torkel
|
||||
@@ -0,0 +1,6 @@
|
||||
dn: cn=admins,ou=groups,dc=grafana,dc=org
|
||||
cn: admins
|
||||
objectClass: groupOfNames
|
||||
objectClass: top
|
||||
member: cn=ldap-admin,ou=users,dc=grafana,dc=org
|
||||
member: cn=ldap-torkel,ou=users,dc=grafana,dc=org
|
||||
23
devenv/docker/blocks/multiple-openldap/docker-compose.yaml
Normal file
23
devenv/docker/blocks/multiple-openldap/docker-compose.yaml
Normal file
@@ -0,0 +1,23 @@
|
||||
admins-openldap:
|
||||
build:
|
||||
context: docker/blocks/multiple-openldap
|
||||
dockerfile: ./admins-ldap-server.Dockerfile
|
||||
environment:
|
||||
SLAPD_PASSWORD: grafana
|
||||
SLAPD_DOMAIN: grafana.org
|
||||
SLAPD_ADDITIONAL_MODULES: memberof
|
||||
ports:
|
||||
- "389:389"
|
||||
|
||||
openldap:
|
||||
build:
|
||||
context: docker/blocks/multiple-openldap
|
||||
dockerfile: ./ldap-server.Dockerfile
|
||||
environment:
|
||||
SLAPD_PASSWORD: grafana
|
||||
SLAPD_DOMAIN: grafana.org
|
||||
SLAPD_ADDITIONAL_MODULES: memberof
|
||||
ports:
|
||||
- "388:389"
|
||||
|
||||
|
||||
98
devenv/docker/blocks/multiple-openldap/entrypoint.sh
Executable file
98
devenv/docker/blocks/multiple-openldap/entrypoint.sh
Executable file
@@ -0,0 +1,98 @@
|
||||
#!/bin/bash
|
||||
|
||||
# When not limiting the open file descritors limit, the memory consumption of
|
||||
# slapd is absurdly high. See https://github.com/docker/docker/issues/8231
|
||||
ulimit -n 8192
|
||||
|
||||
|
||||
set -e
|
||||
|
||||
chown -R openldap:openldap /var/lib/ldap/
|
||||
|
||||
if [[ ! -d /etc/ldap/slapd.d ]]; then
|
||||
|
||||
if [[ -z "$SLAPD_PASSWORD" ]]; then
|
||||
echo -n >&2 "Error: Container not configured and SLAPD_PASSWORD not set. "
|
||||
echo >&2 "Did you forget to add -e SLAPD_PASSWORD=... ?"
|
||||
exit 1
|
||||
fi
|
||||
|
||||
if [[ -z "$SLAPD_DOMAIN" ]]; then
|
||||
echo -n >&2 "Error: Container not configured and SLAPD_DOMAIN not set. "
|
||||
echo >&2 "Did you forget to add -e SLAPD_DOMAIN=... ?"
|
||||
exit 1
|
||||
fi
|
||||
|
||||
SLAPD_ORGANIZATION="${SLAPD_ORGANIZATION:-${SLAPD_DOMAIN}}"
|
||||
|
||||
cp -a /etc/ldap.dist/* /etc/ldap
|
||||
|
||||
cat <<-EOF | debconf-set-selections
|
||||
slapd slapd/no_configuration boolean false
|
||||
slapd slapd/password1 password $SLAPD_PASSWORD
|
||||
slapd slapd/password2 password $SLAPD_PASSWORD
|
||||
slapd shared/organization string $SLAPD_ORGANIZATION
|
||||
slapd slapd/domain string $SLAPD_DOMAIN
|
||||
slapd slapd/backend select HDB
|
||||
slapd slapd/allow_ldap_v2 boolean false
|
||||
slapd slapd/purge_database boolean false
|
||||
slapd slapd/move_old_database boolean true
|
||||
EOF
|
||||
|
||||
dpkg-reconfigure -f noninteractive slapd >/dev/null 2>&1
|
||||
|
||||
dc_string=""
|
||||
|
||||
IFS="."; declare -a dc_parts=($SLAPD_DOMAIN)
|
||||
|
||||
for dc_part in "${dc_parts[@]}"; do
|
||||
dc_string="$dc_string,dc=$dc_part"
|
||||
done
|
||||
|
||||
base_string="BASE ${dc_string:1}"
|
||||
|
||||
sed -i "s/^#BASE.*/${base_string}/g" /etc/ldap/ldap.conf
|
||||
|
||||
if [[ -n "$SLAPD_CONFIG_PASSWORD" ]]; then
|
||||
password_hash=`slappasswd -s "${SLAPD_CONFIG_PASSWORD}"`
|
||||
|
||||
sed_safe_password_hash=${password_hash//\//\\\/}
|
||||
|
||||
slapcat -n0 -F /etc/ldap/slapd.d -l /tmp/config.ldif
|
||||
sed -i "s/\(olcRootDN: cn=admin,cn=config\)/\1\nolcRootPW: ${sed_safe_password_hash}/g" /tmp/config.ldif
|
||||
rm -rf /etc/ldap/slapd.d/*
|
||||
slapadd -n0 -F /etc/ldap/slapd.d -l /tmp/config.ldif >/dev/null 2>&1
|
||||
fi
|
||||
|
||||
if [[ -n "$SLAPD_ADDITIONAL_SCHEMAS" ]]; then
|
||||
IFS=","; declare -a schemas=($SLAPD_ADDITIONAL_SCHEMAS); unset IFS
|
||||
|
||||
for schema in "${schemas[@]}"; do
|
||||
slapadd -n0 -F /etc/ldap/slapd.d -l "/etc/ldap/schema/${schema}.ldif" >/dev/null 2>&1
|
||||
done
|
||||
fi
|
||||
|
||||
if [[ -n "$SLAPD_ADDITIONAL_MODULES" ]]; then
|
||||
IFS=","; declare -a modules=($SLAPD_ADDITIONAL_MODULES); unset IFS
|
||||
|
||||
for module in "${modules[@]}"; do
|
||||
echo "Adding module ${module}"
|
||||
slapadd -n0 -F /etc/ldap/slapd.d -l "/etc/ldap/modules/${module}.ldif" >/dev/null 2>&1
|
||||
done
|
||||
fi
|
||||
|
||||
# This needs to run in background
|
||||
# Will prepopulate entries after ldap daemon has started
|
||||
./prepopulate.sh &
|
||||
|
||||
chown -R openldap:openldap /etc/ldap/slapd.d/ /var/lib/ldap/ /var/run/slapd/
|
||||
else
|
||||
slapd_configs_in_env=`env | grep 'SLAPD_'`
|
||||
|
||||
if [ -n "${slapd_configs_in_env:+x}" ]; then
|
||||
echo "Info: Container already configured, therefore ignoring SLAPD_xxx environment variables"
|
||||
fi
|
||||
fi
|
||||
|
||||
exec "$@"
|
||||
|
||||
@@ -0,0 +1,30 @@
|
||||
# Fork of https://github.com/dinkel/docker-openldap
|
||||
|
||||
FROM debian:jessie
|
||||
|
||||
LABEL maintainer="Grafana team <hello@grafana.com>"
|
||||
|
||||
ENV OPENLDAP_VERSION 2.4.40
|
||||
|
||||
RUN apt-get update && \
|
||||
DEBIAN_FRONTEND=noninteractive apt-get install --no-install-recommends -y \
|
||||
slapd=${OPENLDAP_VERSION}* \
|
||||
ldap-utils && \
|
||||
apt-get clean && \
|
||||
rm -rf /var/lib/apt/lists/*
|
||||
|
||||
RUN mv /etc/ldap /etc/ldap.dist
|
||||
|
||||
EXPOSE 389
|
||||
|
||||
VOLUME ["/etc/ldap", "/var/lib/ldap"]
|
||||
|
||||
COPY ldap-server/modules/ /etc/ldap.dist/modules
|
||||
COPY ldap-server/prepopulate/ /etc/ldap.dist/prepopulate
|
||||
|
||||
COPY ./entrypoint.sh /entrypoint.sh
|
||||
COPY ./prepopulate.sh /prepopulate.sh
|
||||
|
||||
ENTRYPOINT ["/entrypoint.sh"]
|
||||
|
||||
CMD ["slapd", "-d", "32768", "-u", "openldap", "-g", "openldap"]
|
||||
@@ -0,0 +1,33 @@
|
||||
dn: cn=module,cn=config
|
||||
cn: module
|
||||
objectClass: olcModuleList
|
||||
objectClass: top
|
||||
olcModulePath: /usr/lib/ldap
|
||||
olcModuleLoad: memberof.la
|
||||
|
||||
dn: olcOverlay={0}memberof,olcDatabase={1}hdb,cn=config
|
||||
objectClass: olcConfig
|
||||
objectClass: olcMemberOf
|
||||
objectClass: olcOverlayConfig
|
||||
objectClass: top
|
||||
olcOverlay: memberof
|
||||
olcMemberOfDangling: ignore
|
||||
olcMemberOfRefInt: TRUE
|
||||
olcMemberOfGroupOC: groupOfNames
|
||||
olcMemberOfMemberAD: member
|
||||
olcMemberOfMemberOfAD: memberOf
|
||||
|
||||
dn: cn=module,cn=config
|
||||
cn: module
|
||||
objectClass: olcModuleList
|
||||
objectClass: top
|
||||
olcModulePath: /usr/lib/ldap
|
||||
olcModuleLoad: refint.la
|
||||
|
||||
dn: olcOverlay={1}refint,olcDatabase={1}hdb,cn=config
|
||||
objectClass: olcConfig
|
||||
objectClass: olcOverlayConfig
|
||||
objectClass: olcRefintConfig
|
||||
objectClass: top
|
||||
olcOverlay: {1}refint
|
||||
olcRefintAttribute: memberof member manager owner
|
||||
@@ -0,0 +1,9 @@
|
||||
dn: ou=groups,dc=grafana,dc=org
|
||||
ou: Groups
|
||||
objectclass: top
|
||||
objectclass: organizationalUnit
|
||||
|
||||
dn: ou=users,dc=grafana,dc=org
|
||||
ou: Users
|
||||
objectclass: top
|
||||
objectclass: organizationalUnit
|
||||
@@ -0,0 +1,59 @@
|
||||
dn: cn=ldap-editor,ou=users,dc=grafana,dc=org
|
||||
mail: ldap-editor@grafana.com
|
||||
userPassword: grafana
|
||||
objectClass: person
|
||||
objectClass: top
|
||||
objectClass: inetOrgPerson
|
||||
objectClass: organizationalPerson
|
||||
sn: ldap-editor
|
||||
cn: ldap-editor
|
||||
|
||||
dn: cn=ldap-viewer,ou=users,dc=grafana,dc=org
|
||||
mail: ldap-viewer@grafana.com
|
||||
userPassword: grafana
|
||||
objectClass: person
|
||||
objectClass: top
|
||||
objectClass: inetOrgPerson
|
||||
objectClass: organizationalPerson
|
||||
sn: ldap-viewer
|
||||
cn: ldap-viewer
|
||||
|
||||
dn: cn=ldap-carl,ou=users,dc=grafana,dc=org
|
||||
mail: ldap-carl@grafana.com
|
||||
userPassword: grafana
|
||||
objectClass: person
|
||||
objectClass: top
|
||||
objectClass: inetOrgPerson
|
||||
objectClass: organizationalPerson
|
||||
sn: ldap-carl
|
||||
cn: ldap-carl
|
||||
|
||||
dn: cn=ldap-daniel,ou=users,dc=grafana,dc=org
|
||||
mail: ldap-daniel@grafana.com
|
||||
userPassword: grafana
|
||||
objectClass: person
|
||||
objectClass: top
|
||||
objectClass: inetOrgPerson
|
||||
objectClass: organizationalPerson
|
||||
sn: ldap-daniel
|
||||
cn: ldap-daniel
|
||||
|
||||
dn: cn=ldap-leo,ou=users,dc=grafana,dc=org
|
||||
mail: ldap-leo@grafana.com
|
||||
userPassword: grafana
|
||||
objectClass: person
|
||||
objectClass: top
|
||||
objectClass: inetOrgPerson
|
||||
objectClass: organizationalPerson
|
||||
sn: ldap-leo
|
||||
cn: ldap-leo
|
||||
|
||||
dn: cn=ldap-tobias,ou=users,dc=grafana,dc=org
|
||||
mail: ldap-tobias@grafana.com
|
||||
userPassword: grafana
|
||||
objectClass: person
|
||||
objectClass: top
|
||||
objectClass: inetOrgPerson
|
||||
objectClass: organizationalPerson
|
||||
sn: ldap-tobias
|
||||
cn: ldap-tobias
|
||||
@@ -0,0 +1,23 @@
|
||||
dn: cn=admins,ou=groups,dc=grafana,dc=org
|
||||
cn: admins
|
||||
objectClass: groupOfNames
|
||||
objectClass: top
|
||||
|
||||
dn: cn=editors,ou=groups,dc=grafana,dc=org
|
||||
cn: editors
|
||||
objectClass: groupOfNames
|
||||
member: cn=ldap-editor,ou=users,dc=grafana,dc=org
|
||||
|
||||
dn: cn=backend,ou=groups,dc=grafana,dc=org
|
||||
cn: backend
|
||||
objectClass: groupOfNames
|
||||
member: cn=ldap-carl,ou=users,dc=grafana,dc=org
|
||||
member: cn=ldap-leo,ou=users,dc=grafana,dc=org
|
||||
member: cn=ldap-torkel,ou=users,dc=grafana,dc=org
|
||||
|
||||
dn: cn=frontend,ou=groups,dc=grafana,dc=org
|
||||
cn: frontend
|
||||
objectClass: groupOfNames
|
||||
member: cn=ldap-torkel,ou=users,dc=grafana,dc=org
|
||||
member: cn=ldap-daniel,ou=users,dc=grafana,dc=org
|
||||
member: cn=ldap-leo,ou=users,dc=grafana,dc=org
|
||||
59
devenv/docker/blocks/multiple-openldap/ldap_dev.toml
Normal file
59
devenv/docker/blocks/multiple-openldap/ldap_dev.toml
Normal file
@@ -0,0 +1,59 @@
|
||||
# To troubleshoot and get more log info enable ldap debug logging in grafana.ini
|
||||
# [log]
|
||||
# filters = ldap:debug
|
||||
|
||||
# For the verbose comments options see "openldap" env block
|
||||
|
||||
# --- First LDAP Server (only admins) ---
|
||||
|
||||
[[servers]]
|
||||
host = "127.0.0.1"
|
||||
port = 389
|
||||
use_ssl = false
|
||||
start_tls = false
|
||||
ssl_skip_verify = false
|
||||
bind_dn = "cn=admin,dc=grafana,dc=org"
|
||||
bind_password = 'grafana'
|
||||
search_filter = "(cn=%s)"
|
||||
search_base_dns = ["ou=users,dc=grafana,dc=org"]
|
||||
|
||||
[servers.attributes]
|
||||
name = "givenName"
|
||||
surname = "sn"
|
||||
username = "cn"
|
||||
member_of = "memberOf"
|
||||
email = "email"
|
||||
|
||||
[[servers.group_mappings]]
|
||||
group_dn = "cn=admins,ou=groups,dc=grafana,dc=org"
|
||||
org_role = "Admin"
|
||||
grafana_admin = true
|
||||
|
||||
# --- Second LDAP Server (rest of the users) ---
|
||||
|
||||
[[servers]]
|
||||
host = "127.0.0.1"
|
||||
port = 388
|
||||
use_ssl = false
|
||||
start_tls = false
|
||||
ssl_skip_verify = false
|
||||
|
||||
bind_dn = "cn=admin,dc=grafana,dc=org"
|
||||
bind_password = 'grafana'
|
||||
search_filter = "(cn=%s)"
|
||||
search_base_dns = ["ou=users,dc=grafana,dc=org"]
|
||||
|
||||
[servers.attributes]
|
||||
name = "givenName"
|
||||
surname = "sn"
|
||||
username = "cn"
|
||||
member_of = "memberOf"
|
||||
email = "email"
|
||||
|
||||
[[servers.group_mappings]]
|
||||
group_dn = "cn=editors,ou=groups,dc=grafana,dc=org"
|
||||
org_role = "Editor"
|
||||
|
||||
[[servers.group_mappings]]
|
||||
group_dn = "*"
|
||||
org_role = "Viewer"
|
||||
38
devenv/docker/blocks/multiple-openldap/notes.md
Normal file
38
devenv/docker/blocks/multiple-openldap/notes.md
Normal file
@@ -0,0 +1,38 @@
|
||||
# Notes on Multiple OpenLdap Docker Block
|
||||
|
||||
This is very similar to openldap docker block, but it creates multiple ldap servers instead of one.
|
||||
|
||||
Any ldif files added to the prepopulate subdirectory will be automatically imported into the OpenLdap database.
|
||||
|
||||
"admins-ldap-server" block contains admin group and admin users. The "ldap-server" block has all the rest of the users. See below for the full list of users.
|
||||
|
||||
This blocks are here to help with testing multiple LDAP servers, for any other LDAP related development and testing "openldap" block should be used.
|
||||
|
||||
## Enabling LDAP in Grafana
|
||||
|
||||
Copy the ldap_dev.toml file in this folder into your `conf` folder (it is gitignored already). To enable it in the .ini file to get Grafana to use this block:
|
||||
|
||||
```ini
|
||||
[auth.ldap]
|
||||
enabled = true
|
||||
config_file = conf/ldap_dev.toml
|
||||
; allow_sign_up = true
|
||||
```
|
||||
|
||||
## Groups & Users
|
||||
|
||||
admins
|
||||
ldap-admin
|
||||
ldap-torkel
|
||||
backend
|
||||
ldap-carl
|
||||
ldap-torkel
|
||||
ldap-leo
|
||||
frontend
|
||||
ldap-torkel
|
||||
ldap-tobias
|
||||
ldap-daniel
|
||||
editors
|
||||
ldap-editor
|
||||
no groups
|
||||
ldap-viewer
|
||||
14
devenv/docker/blocks/multiple-openldap/prepopulate.sh
Executable file
14
devenv/docker/blocks/multiple-openldap/prepopulate.sh
Executable file
@@ -0,0 +1,14 @@
|
||||
#!/bin/bash
|
||||
|
||||
echo "Pre-populating ldap entries, first waiting for ldap to start"
|
||||
|
||||
sleep 3
|
||||
|
||||
adminUserDn="cn=admin,dc=grafana,dc=org"
|
||||
adminPassword="grafana"
|
||||
|
||||
for file in `ls /etc/ldap/prepopulate/*.ldif`; do
|
||||
ldapadd -x -D $adminUserDn -w $adminPassword -f "$file"
|
||||
done
|
||||
|
||||
|
||||
4
devenv/docker/blocks/nginx_proxy_mac/Dockerfile
Normal file
4
devenv/docker/blocks/nginx_proxy_mac/Dockerfile
Normal file
@@ -0,0 +1,4 @@
|
||||
FROM nginx:alpine
|
||||
|
||||
COPY nginx.conf /etc/nginx/nginx.conf
|
||||
COPY htpasswd /etc/nginx/htpasswd
|
||||
11
devenv/docker/blocks/nginx_proxy_mac/docker-compose.yaml
Normal file
11
devenv/docker/blocks/nginx_proxy_mac/docker-compose.yaml
Normal file
@@ -0,0 +1,11 @@
|
||||
# This will proxy all requests for http://localhost:10080/grafana/ to
|
||||
# http://localhost:3000 (Grafana running locally)
|
||||
#
|
||||
# Please note that you'll need to change the root_url in the Grafana configuration:
|
||||
# root_url = %(protocol)s://%(domain)s:10080/grafana/
|
||||
|
||||
nginxproxy:
|
||||
build: docker/blocks/nginx_proxy
|
||||
ports:
|
||||
- "10080:10080"
|
||||
|
||||
3
devenv/docker/blocks/nginx_proxy_mac/htpasswd
Executable file
3
devenv/docker/blocks/nginx_proxy_mac/htpasswd
Executable file
@@ -0,0 +1,3 @@
|
||||
user1:$apr1$1odeeQb.$kwV8D/VAAGUDU7pnHuKoV0
|
||||
user2:$apr1$A2kf25r.$6S0kp3C7vIuixS5CL0XA9.
|
||||
admin:$apr1$IWn4DoRR$E2ol7fS/dkI18eU4bXnBO1
|
||||
39
devenv/docker/blocks/nginx_proxy_mac/nginx.conf
Normal file
39
devenv/docker/blocks/nginx_proxy_mac/nginx.conf
Normal file
@@ -0,0 +1,39 @@
|
||||
events { worker_connections 1024; }
|
||||
|
||||
http {
|
||||
sendfile on;
|
||||
|
||||
proxy_redirect off;
|
||||
proxy_set_header Host $host;
|
||||
proxy_set_header X-Real-IP $remote_addr;
|
||||
proxy_set_header X-Forwarded-For $proxy_add_x_forwarded_for;
|
||||
proxy_set_header X-Forwarded-Host $server_name;
|
||||
|
||||
server {
|
||||
listen 10080;
|
||||
|
||||
location /grafana/ {
|
||||
################################################################
|
||||
# Enable these settings to test with basic auth and an auth proxy header
|
||||
# the htpasswd file contains an admin user with password admin and
|
||||
# user1: grafana and user2: grafana
|
||||
################################################################
|
||||
|
||||
# auth_basic "Restricted Content";
|
||||
# auth_basic_user_file /etc/nginx/htpasswd;
|
||||
|
||||
################################################################
|
||||
# To use the auth proxy header, set the following in custom.ini:
|
||||
# [auth.proxy]
|
||||
# enabled = true
|
||||
# header_name = X-WEBAUTH-USER
|
||||
# header_property = username
|
||||
################################################################
|
||||
|
||||
# proxy_set_header X-WEBAUTH-USER $remote_user;
|
||||
|
||||
# this url works only on mac
|
||||
proxy_pass http://host.docker.internal:3000/;
|
||||
}
|
||||
}
|
||||
}
|
||||
@@ -2,7 +2,7 @@
|
||||
|
||||
FROM debian:jessie
|
||||
|
||||
LABEL maintainer="Christian Luginbühl <dinke@pimprecords.com>"
|
||||
LABEL maintainer="Grafana team <hello@grafana.com>"
|
||||
|
||||
ENV OPENLDAP_VERSION 2.4.40
|
||||
|
||||
@@ -19,6 +19,8 @@ EXPOSE 389
|
||||
|
||||
VOLUME ["/etc/ldap", "/var/lib/ldap"]
|
||||
|
||||
COPY ldap.conf /etc/ldap.dist/ldap.conf
|
||||
|
||||
COPY modules/ /etc/ldap.dist/modules
|
||||
COPY prepopulate/ /etc/ldap.dist/prepopulate
|
||||
|
||||
|
||||
@@ -1,4 +1,5 @@
|
||||
openldap:
|
||||
container_name: ldap
|
||||
build: docker/blocks/openldap
|
||||
environment:
|
||||
SLAPD_PASSWORD: grafana
|
||||
|
||||
@@ -49,10 +49,6 @@ EOF
|
||||
dc_string="$dc_string,dc=$dc_part"
|
||||
done
|
||||
|
||||
base_string="BASE ${dc_string:1}"
|
||||
|
||||
sed -i "s/^#BASE.*/${base_string}/g" /etc/ldap/ldap.conf
|
||||
|
||||
if [[ -n "$SLAPD_CONFIG_PASSWORD" ]]; then
|
||||
password_hash=`slappasswd -s "${SLAPD_CONFIG_PASSWORD}"`
|
||||
|
||||
|
||||
16
devenv/docker/blocks/openldap/ldap.conf
Normal file
16
devenv/docker/blocks/openldap/ldap.conf
Normal file
@@ -0,0 +1,16 @@
|
||||
#
|
||||
# LDAP Defaults
|
||||
#
|
||||
|
||||
# See ldap.conf(5) for details
|
||||
# This file should be world readable but not world writable.
|
||||
|
||||
BASE dc=grafana,dc=org
|
||||
#URI ldap://ldap.example.com ldap://ldap-master.example.com:666
|
||||
|
||||
SIZELIMIT 1000
|
||||
#TIMELIMIT 15
|
||||
#DEREF never
|
||||
|
||||
# TLS certificates (needed for GnuTLS)
|
||||
TLS_CACERT /etc/ssl/certs/ca-certificates.crt
|
||||
@@ -28,38 +28,6 @@ search_filter = "(cn=%s)"
|
||||
# An array of base dns to search through
|
||||
search_base_dns = ["dc=grafana,dc=org"]
|
||||
|
||||
# In POSIX LDAP schemas, without memberOf attribute a secondary query must be made for groups.
|
||||
# This is done by enabling group_search_filter below. You must also set member_of= "cn"
|
||||
# in [servers.attributes] below.
|
||||
|
||||
# Users with nested/recursive group membership and an LDAP server that supports LDAP_MATCHING_RULE_IN_CHAIN
|
||||
# can set group_search_filter, group_search_filter_user_attribute, group_search_base_dns and member_of
|
||||
# below in such a way that the user's recursive group membership is considered.
|
||||
#
|
||||
# Nested Groups + Active Directory (AD) Example:
|
||||
#
|
||||
# AD groups store the Distinguished Names (DNs) of members, so your filter must
|
||||
# recursively search your groups for the authenticating user's DN. For example:
|
||||
#
|
||||
# group_search_filter = "(member:1.2.840.113556.1.4.1941:=%s)"
|
||||
# group_search_filter_user_attribute = "distinguishedName"
|
||||
# group_search_base_dns = ["ou=groups,dc=grafana,dc=org"]
|
||||
#
|
||||
# [servers.attributes]
|
||||
# ...
|
||||
# member_of = "distinguishedName"
|
||||
|
||||
## Group search filter, to retrieve the groups of which the user is a member (only set if memberOf attribute is not available)
|
||||
# group_search_filter = "(&(objectClass=posixGroup)(memberUid=%s))"
|
||||
## Group search filter user attribute defines what user attribute gets substituted for %s in group_search_filter.
|
||||
## Defaults to the value of username in [server.attributes]
|
||||
## Valid options are any of your values in [servers.attributes]
|
||||
## If you are using nested groups you probably want to set this and member_of in
|
||||
## [servers.attributes] to "distinguishedName"
|
||||
# group_search_filter_user_attribute = "distinguishedName"
|
||||
## An array of the base DNs to search through for groups. Typically uses ou=groups
|
||||
# group_search_base_dns = ["ou=groups,dc=grafana,dc=org"]
|
||||
|
||||
# Specify names of the ldap attributes your ldap uses
|
||||
[servers.attributes]
|
||||
name = "givenName"
|
||||
|
||||
57
devenv/docker/blocks/openldap/ldap_posix_dev.toml
Normal file
57
devenv/docker/blocks/openldap/ldap_posix_dev.toml
Normal file
@@ -0,0 +1,57 @@
|
||||
# To troubleshoot and get more log info enable ldap debug logging in grafana.ini
|
||||
# [log]
|
||||
# filters = ldap:debug
|
||||
|
||||
[[servers]]
|
||||
# Ldap server host (specify multiple hosts space separated)
|
||||
host = "127.0.0.1"
|
||||
# Default port is 389 or 636 if use_ssl = true
|
||||
port = 389
|
||||
# Set to true if ldap server supports TLS
|
||||
use_ssl = false
|
||||
# Set to true if connect ldap server with STARTTLS pattern (create connection in insecure, then upgrade to secure connection with TLS)
|
||||
start_tls = false
|
||||
# set to true if you want to skip ssl cert validation
|
||||
ssl_skip_verify = false
|
||||
# set to the path to your root CA certificate or leave unset to use system defaults
|
||||
# root_ca_cert = "/path/to/certificate.crt"
|
||||
|
||||
# Search user bind dn
|
||||
bind_dn = "cn=admin,dc=grafana,dc=org"
|
||||
# Search user bind password
|
||||
# If the password contains # or ; you have to wrap it with triple quotes. Ex """#password;"""
|
||||
bind_password = 'grafana'
|
||||
|
||||
# An array of base dns to search through
|
||||
search_base_dns = ["dc=grafana,dc=org"]
|
||||
|
||||
search_filter = "(uid=%s)"
|
||||
|
||||
group_search_filter = "(&(objectClass=posixGroup)(memberUid=%s))"
|
||||
group_search_filter_user_attribute = "uid"
|
||||
group_search_base_dns = ["ou=groups,dc=grafana,dc=org"]
|
||||
|
||||
[servers.attributes]
|
||||
name = "givenName"
|
||||
surname = "sn"
|
||||
username = "cn"
|
||||
member_of = "memberOf"
|
||||
email = "email"
|
||||
|
||||
# Map ldap groups to grafana org roles
|
||||
[[servers.group_mappings]]
|
||||
group_dn = "cn=posix-admins,ou=groups,dc=grafana,dc=org"
|
||||
org_role = "Admin"
|
||||
grafana_admin = true
|
||||
|
||||
# The Grafana organization database id, optional, if left out the default org (id 1) will be used
|
||||
# org_id = 1
|
||||
|
||||
[[servers.group_mappings]]
|
||||
group_dn = "cn=editors,ou=groups,dc=grafana,dc=org"
|
||||
org_role = "Editor"
|
||||
|
||||
[[servers.group_mappings]]
|
||||
# If you want to match all (or no ldap groups) then you can use wildcard
|
||||
group_dn = "*"
|
||||
org_role = "Viewer"
|
||||
@@ -2,8 +2,6 @@
|
||||
|
||||
Any ldif files added to the prepopulate subdirectory will be automatically imported into the OpenLdap database.
|
||||
|
||||
The ldif files add eight users, `ldap-admin`, `ldap-editor`, `ldap-viewer`, `ldap-carl`, `ldap-daniel`, `ldap-leo`, `ldap-tobias` and `ldap-torkel`. Two groups, `admins` and `users`, are added that correspond with the group mappings in the default conf/ldap.toml. `ldap-admin` is a member of `admins` and `ldap-editor` is a member of `users`.
|
||||
|
||||
Note that users that are added here need to specify a `memberOf` attribute manually as well as the `member` attribute for the group. The `memberOf` module usually does this automatically (if you add a group in Apache Directory Studio for example) but this does not work in the entrypoint script as it uses the `slapadd` command to add entries before the server has started and before the `memberOf` module is loaded.
|
||||
|
||||
After adding ldif files to `prepopulate`:
|
||||
@@ -14,7 +12,7 @@ After adding ldif files to `prepopulate`:
|
||||
|
||||
## Enabling LDAP in Grafana
|
||||
|
||||
Copy the ldap_dev.toml file in this folder into your `conf` folder (it is gitignored already). To enable it in the .ini file to get Grafana to use this block:
|
||||
If you want to use users/groups with `memberOf` support Copy the ldap_dev.toml file in this folder into your `conf` folder (it is gitignored already). To enable it in the .ini file to get Grafana to use this block:
|
||||
|
||||
```ini
|
||||
[auth.ldap]
|
||||
@@ -23,12 +21,13 @@ config_file = conf/ldap_dev.toml
|
||||
; allow_sign_up = true
|
||||
```
|
||||
|
||||
Test groups & users
|
||||
Otherwise perform same actions for `ldap_dev_posix.toml` config.
|
||||
|
||||
## Groups & Users
|
||||
|
||||
admins
|
||||
ldap-admin
|
||||
ldap-torkel
|
||||
ldap-daniel
|
||||
backend
|
||||
ldap-carl
|
||||
ldap-torkel
|
||||
@@ -41,3 +40,11 @@ editors
|
||||
ldap-editors
|
||||
no groups
|
||||
ldap-viewer
|
||||
|
||||
|
||||
## Groups & Users (POSIX)
|
||||
|
||||
admins
|
||||
ldap-posix-admin
|
||||
no groups
|
||||
ldap-posix
|
||||
|
||||
@@ -78,3 +78,31 @@ objectClass: inetOrgPerson
|
||||
objectClass: organizationalPerson
|
||||
sn: ldap-torkel
|
||||
cn: ldap-torkel
|
||||
|
||||
# admin for posix group (without support for memberOf attribute)
|
||||
dn: uid=ldap-posix-admin,ou=users,dc=grafana,dc=org
|
||||
mail: ldap-posix-admin@grafana.com
|
||||
userPassword: grafana
|
||||
objectclass: top
|
||||
objectclass: posixAccount
|
||||
objectclass: inetOrgPerson
|
||||
homedirectory: /home/ldap-posix-admin
|
||||
sn: ldap-posix-admin
|
||||
cn: ldap-posix-admin
|
||||
uid: ldap-posix-admin
|
||||
uidnumber: 1
|
||||
gidnumber: 1
|
||||
|
||||
# user for posix group (without support for memberOf attribute)
|
||||
dn: uid=ldap-posix,ou=users,dc=grafana,dc=org
|
||||
mail: ldap-posix@grafana.com
|
||||
userPassword: grafana
|
||||
objectclass: top
|
||||
objectclass: posixAccount
|
||||
objectclass: inetOrgPerson
|
||||
homedirectory: /home/ldap-posix
|
||||
sn: ldap-posix
|
||||
cn: ldap-posix
|
||||
uid: ldap-posix
|
||||
uidnumber: 2
|
||||
gidnumber: 2
|
||||
|
||||
@@ -23,3 +23,21 @@ objectClass: groupOfNames
|
||||
member: cn=ldap-torkel,ou=users,dc=grafana,dc=org
|
||||
member: cn=ldap-daniel,ou=users,dc=grafana,dc=org
|
||||
member: cn=ldap-leo,ou=users,dc=grafana,dc=org
|
||||
|
||||
# -- POSIX --
|
||||
|
||||
# posix admin group (without support for memberOf attribute)
|
||||
dn: cn=posix-admins,ou=groups,dc=grafana,dc=org
|
||||
cn: admins
|
||||
objectClass: top
|
||||
objectClass: posixGroup
|
||||
gidNumber: 1
|
||||
memberUid: ldap-posix-admin
|
||||
|
||||
# posix group (without support for memberOf attribute)
|
||||
dn: cn=posix,ou=groups,dc=grafana,dc=org
|
||||
cn: viewers
|
||||
objectClass: top
|
||||
objectClass: posixGroup
|
||||
gidNumber: 2
|
||||
memberUid: ldap-posix
|
||||
|
||||
@@ -1,5 +1,5 @@
|
||||
opentsdb:
|
||||
image: opower/opentsdb:latest
|
||||
image: petergrace/opentsdb-docker:latest
|
||||
ports:
|
||||
- "4242:4242"
|
||||
|
||||
|
||||
@@ -0,0 +1,4 @@
|
||||
FROM nginx:alpine
|
||||
|
||||
COPY nginx.conf /etc/nginx/nginx.conf
|
||||
COPY htpasswd /etc/nginx/htpasswd
|
||||
@@ -0,0 +1,6 @@
|
||||
# This will proxy all requests for http://localhost:10090 to
|
||||
# http://prometheus:9090 (Prometheus inside the docker compose)
|
||||
|
||||
nginxproxy:
|
||||
build: docker/blocks/nginx_proxy
|
||||
network_mode: host
|
||||
1
devenv/docker/blocks/prometheus_basic_auth_proxy/htpasswd
Executable file
1
devenv/docker/blocks/prometheus_basic_auth_proxy/htpasswd
Executable file
@@ -0,0 +1 @@
|
||||
prom:$apr1$bfu32njz$HHDDTjaeWHDzQs2UMXP.C1
|
||||
34
devenv/docker/blocks/prometheus_basic_auth_proxy/nginx.conf
Normal file
34
devenv/docker/blocks/prometheus_basic_auth_proxy/nginx.conf
Normal file
@@ -0,0 +1,34 @@
|
||||
events { }
|
||||
|
||||
http {
|
||||
server {
|
||||
|
||||
listen 10090;
|
||||
|
||||
location / {
|
||||
|
||||
# Removes any Access-Control-Allow-Origin from Prometheus itself. When accessing from browser, having * or
|
||||
# multiple values is not allowed in some cases
|
||||
proxy_hide_header Access-Control-Allow-Origin;
|
||||
|
||||
# Allow the origin access. This is kinda wildcard but for browser it seems more strict and is needed for
|
||||
# withCredentials requests.
|
||||
add_header Access-Control-Allow-Origin $http_origin;
|
||||
|
||||
# When using withCredentials requests this must be true.
|
||||
add_header Access-Control-Allow-Credentials true;
|
||||
|
||||
# Ask for basic auth except for pre flight OPTIONS request.
|
||||
limit_except OPTIONS {
|
||||
################################################################
|
||||
# The htpasswd file contains user:
|
||||
# prom: test
|
||||
################################################################
|
||||
auth_basic "prom";
|
||||
auth_basic_user_file /etc/nginx/htpasswd;
|
||||
}
|
||||
|
||||
proxy_pass http://prometheus:9090/;
|
||||
}
|
||||
}
|
||||
}
|
||||
16
devenv/docker/blocks/saml/docker-compose.yaml
Normal file
16
devenv/docker/blocks/saml/docker-compose.yaml
Normal file
@@ -0,0 +1,16 @@
|
||||
saml:
|
||||
container_name: saml
|
||||
image: kristophjunge/test-saml-idp
|
||||
environment:
|
||||
SIMPLESAMLPHP_SP_ENTITY_ID: http://grafana.com
|
||||
SIMPLESAMLPHP_SP_ASSERTION_CONSUMER_SERVICE: http://localhost/simplesaml/module.php/saml/sp/saml2-acs.php/test-sp
|
||||
SIMPLESAMLPHP_SP_SINGLE_LOGOUT_SERVICE: http://localhost/simplesaml/module.php/saml/sp/saml2-logout.php/test-sp
|
||||
SIMPLESAMLPHP_ADMIN_PASSWORD: grafana
|
||||
SIMPLESAMLPHP_SECRET_SALT: salt
|
||||
ports:
|
||||
- "8080:8080"
|
||||
- "8443:8443"
|
||||
volumes:
|
||||
- ./docker/blocks/saml/users.php:/var/www/simplesamlphp/config/authsources.php
|
||||
|
||||
|
||||
16
devenv/docker/blocks/saml/notes.md
Normal file
16
devenv/docker/blocks/saml/notes.md
Normal file
@@ -0,0 +1,16 @@
|
||||
# Notes on Saml Docker Block
|
||||
|
||||
Uses https://github.com/kristophjunge/docker-test-saml-idp as a docker container for saml example.
|
||||
|
||||
## Use
|
||||
|
||||
See docker container docs on how to use this service - https://github.com/kristophjunge/docker-test-saml-idp#test-the-identity-provider-idp
|
||||
|
||||
## Groups & Users
|
||||
|
||||
admins
|
||||
saml-admin (saml-admin@grafana.com)
|
||||
editors
|
||||
saml-editor (saml-editor@grafana.com)
|
||||
no groups
|
||||
saml-viewer (saml-viewer@grafana.com)
|
||||
21
devenv/docker/blocks/saml/users.php
Normal file
21
devenv/docker/blocks/saml/users.php
Normal file
@@ -0,0 +1,21 @@
|
||||
<?php
|
||||
$config = array(
|
||||
'admin' => array(
|
||||
'core:AdminPassword',
|
||||
),
|
||||
'example-userpass' => array(
|
||||
'exampleauth:UserPass',
|
||||
'saml-admin:grafana' => array(
|
||||
'groups' => array('admins'),
|
||||
'email' => 'saml-admin@grafana.com',
|
||||
),
|
||||
'saml-editor:grafana' => array(
|
||||
'groups' => array('editors'),
|
||||
'email' => 'saml-editor@grafana.com',
|
||||
),
|
||||
'saml-viewer:grafana' => array(
|
||||
'groups' => array(),
|
||||
'email' => 'saml-viewer@grafana.com',
|
||||
),
|
||||
),
|
||||
);
|
||||
7
devenv/docker/blocks/slow_proxy/Dockerfile
Normal file
7
devenv/docker/blocks/slow_proxy/Dockerfile
Normal file
@@ -0,0 +1,7 @@
|
||||
|
||||
FROM golang:latest
|
||||
ADD main.go /
|
||||
WORKDIR /
|
||||
RUN go build -o main .
|
||||
EXPOSE 3011
|
||||
ENTRYPOINT ["/main"]
|
||||
7
devenv/docker/blocks/slow_proxy/docker-compose.yaml
Normal file
7
devenv/docker/blocks/slow_proxy/docker-compose.yaml
Normal file
@@ -0,0 +1,7 @@
|
||||
slow_proxy:
|
||||
build: docker/blocks/slow_proxy
|
||||
network_mode: host
|
||||
ports:
|
||||
- "3011:3011"
|
||||
environment:
|
||||
ORIGIN_SERVER: "http://localhost:9090/"
|
||||
31
devenv/docker/blocks/slow_proxy/main.go
Normal file
31
devenv/docker/blocks/slow_proxy/main.go
Normal file
@@ -0,0 +1,31 @@
|
||||
package main
|
||||
|
||||
import (
|
||||
"fmt"
|
||||
"log"
|
||||
"net/http"
|
||||
"net/http/httputil"
|
||||
"net/url"
|
||||
"os"
|
||||
"time"
|
||||
)
|
||||
|
||||
func main() {
|
||||
origin := os.Getenv("ORIGIN_SERVER")
|
||||
if origin == "" {
|
||||
origin = "http://localhost:9090/"
|
||||
}
|
||||
|
||||
sleep := time.Minute
|
||||
|
||||
originURL, _ := url.Parse(origin)
|
||||
proxy := httputil.NewSingleHostReverseProxy(originURL)
|
||||
|
||||
http.HandleFunc("/", func(w http.ResponseWriter, r *http.Request) {
|
||||
fmt.Printf("sleeping for %s then proxying request: %s", sleep.String(), r.RequestURI)
|
||||
<-time.After(sleep)
|
||||
proxy.ServeHTTP(w, r)
|
||||
})
|
||||
|
||||
log.Fatal(http.ListenAndServe(":3011", nil))
|
||||
}
|
||||
@@ -6,6 +6,9 @@ Runs load tests and checks using [k6](https://k6.io/).
|
||||
|
||||
Docker
|
||||
|
||||
To run the auth proxy test you'll need to setup nginx proxy from docker block and
|
||||
enable auth proxy together with configuring Grafana for auth proxy.
|
||||
|
||||
## Run
|
||||
|
||||
Run load test for 15 minutes using 2 virtual users and targeting http://localhost:3000.
|
||||
@@ -32,6 +35,13 @@ Run load test for 10 virtual users:
|
||||
$ ./run.sh -v 10
|
||||
```
|
||||
|
||||
Run auth proxy test:
|
||||
|
||||
```bash
|
||||
$ ./run.sh -c auth_proxy_test
|
||||
```
|
||||
|
||||
|
||||
Example output:
|
||||
|
||||
```bash
|
||||
|
||||
56
devenv/docker/loadtest/auth_proxy_test.js
Normal file
56
devenv/docker/loadtest/auth_proxy_test.js
Normal file
@@ -0,0 +1,56 @@
|
||||
import { sleep, check, group } from 'k6';
|
||||
import { createBasicAuthClient } from './modules/client.js';
|
||||
|
||||
export let options = {
|
||||
noCookiesReset: true
|
||||
};
|
||||
|
||||
let endpoint = __ENV.URL || 'http://localhost:10080/grafana';
|
||||
const client = createBasicAuthClient(endpoint, 'user1', 'grafana');
|
||||
client.withOrgId(1);
|
||||
|
||||
export const setup = () => {
|
||||
const adminClient = createBasicAuthClient(endpoint, 'admin', 'admin');
|
||||
let res = adminClient.datasources.getByName('gdev-prometheus');
|
||||
if (res.status !== 200) {
|
||||
throw new Error('Expected 200 response status when creating datasource');
|
||||
}
|
||||
|
||||
return {
|
||||
datasourceId: res.json().id,
|
||||
};
|
||||
}
|
||||
|
||||
export default (data) => {
|
||||
group("auth proxy test", () => {
|
||||
group("batch proxy requests", () => {
|
||||
const d = new Date();
|
||||
const batchCount = 300;
|
||||
const requests = [];
|
||||
const query = encodeURI('topk(5, max(scrape_duration_seconds) by (job))');
|
||||
const start = (d.getTime() / 1000) - 3600;
|
||||
const end = (d.getTime() / 1000);
|
||||
const step = 20;
|
||||
|
||||
requests.push({ method: 'GET', url: '/api/annotations?dashboardId=8&from=1558670300607&to=1558691900607' });
|
||||
|
||||
for (let n = 0; n < batchCount; n++) {
|
||||
requests.push({
|
||||
method: 'GET',
|
||||
url: `/api/datasources/proxy/${data.datasourceId}/api/v1/query_range?query=${query}&start=${start}&end=${end}&step=${step}`,
|
||||
});
|
||||
}
|
||||
|
||||
let responses = client.batch(requests);
|
||||
for (let n = 0; n < batchCount; n++) {
|
||||
check(responses[n], {
|
||||
'response status is 200': (r) => r.status === 200,
|
||||
});
|
||||
}
|
||||
});
|
||||
});
|
||||
|
||||
sleep(5)
|
||||
}
|
||||
|
||||
export const teardown = (data) => {}
|
||||
@@ -6,8 +6,9 @@ run() {
|
||||
duration='15m'
|
||||
url='http://localhost:3000'
|
||||
vus='2'
|
||||
testcase='auth_token_test'
|
||||
|
||||
while getopts ":d:u:v:" o; do
|
||||
while getopts ":d:u:v:c:" o; do
|
||||
case "${o}" in
|
||||
d)
|
||||
duration=${OPTARG}
|
||||
@@ -18,11 +19,14 @@ run() {
|
||||
v)
|
||||
vus=${OPTARG}
|
||||
;;
|
||||
c)
|
||||
testcase=${OPTARG}
|
||||
;;
|
||||
esac
|
||||
done
|
||||
shift $((OPTIND-1))
|
||||
|
||||
docker run -t --network=host -v $PWD:/src -e URL=$url --rm -i loadimpact/k6:master run --vus $vus --duration $duration src/auth_token_test.js
|
||||
docker run -t --network=host -v $PWD:/src -e URL=$url --rm -i loadimpact/k6:master run --vus $vus --duration $duration src/$testcase.js
|
||||
}
|
||||
|
||||
run "$@"
|
||||
|
||||
@@ -4,12 +4,16 @@
|
||||
DOCSPORT := 3004
|
||||
|
||||
DOCKER_DOCS_IMAGE := grafana/grafana-docs
|
||||
|
||||
SOURCES_HOST_DIR := "$(shell pwd)/sources"
|
||||
|
||||
# assuming grafana and grafana.org-repo to be checked out in the same folder
|
||||
DEFAULT_LAYOUTS_DIR := "$(shell pwd)/../../../../../../grafana.org/layouts"
|
||||
|
||||
# to allow `make DOCSDIR=docs docs-shell` (to create a bind mount in docs)
|
||||
LAYOUTS_MOUNT := $(if $(LAYOUTS),-v $(DEFAULT_LAYOUTS_DIR):/site/layouts)
|
||||
DOCS_MOUNT := -v $(SOURCES_HOST_DIR):/site/content
|
||||
|
||||
DOCKER_RUN_DOCS := docker run --rm -it $(DOCS_MOUNT) -e NOCACHE -p 3004:3004 -p 3005:3005
|
||||
DOCKER_RUN_DOCS := docker run --rm -it $(DOCS_MOUNT) $(LAYOUTS_MOUNT) -e NOCACHE -p 3004:3004 -p 3005:3005
|
||||
|
||||
VERSION := $(shell head -n 1 VERSION)
|
||||
|
||||
@@ -24,7 +28,7 @@ docs: docs-build
|
||||
$(DOCKER_RUN_DOCS) $(DOCS_MOUNT) -e DOCKERHOST "$(DOCKER_DOCS_IMAGE)" /bin/bash -c "grunt --env=dev-docs && grunt connect --port=3004"
|
||||
|
||||
watch: docs-build
|
||||
$(DOCKER_RUN_DOCS) $(DOCS_MOUNT) -e DOCKERHOST "$(DOCKER_DOCS_IMAGE)" /bin/bash -c "grunt --env=dev-docs && grunt connect --port=3004 & grunt watch --port=3004 --env=dev-docs"
|
||||
$(DOCKER_RUN_DOCS) $(DOCS_MOUNT) $(LAYOUTS_MOUNT) -e DOCKERHOST "$(DOCKER_DOCS_IMAGE)" /bin/bash -c "grunt --env=dev-docs && grunt connect --port=3004 & grunt watch --port=3004 --env=dev-docs"
|
||||
|
||||
publish: checkvars docs-build
|
||||
$(info Publishing ENV=${ENV} and VERSION=${VERSION})
|
||||
|
||||
@@ -5,20 +5,20 @@ docs are built using [Hugo](http://gohugo.io/) - a static site generator.
|
||||
|
||||
**Prepare the Docker Image**:
|
||||
|
||||
Git clone `grafana/grafana.org` repo. Run these commands in the root of that repo. **Note** that you may require ``sudo``
|
||||
Git clone `grafana/website` repo. Run these commands in the root of that repo. **Note** that you may require ``sudo``
|
||||
when running ``make docs-build`` depending on how your system's docker
|
||||
service is configured):
|
||||
|
||||
```
|
||||
git clone https://github.com/grafana/grafana.org
|
||||
cd grafana.org
|
||||
git clone https://github.com/grafana/website
|
||||
cd website
|
||||
make docs-build
|
||||
```
|
||||
|
||||
**Build the Documentation**:
|
||||
|
||||
Now that the docker image has been prepared we can build the
|
||||
grafana docs and start a docs server.
|
||||
grafana docs and start a docs server.
|
||||
|
||||
If you have not cloned the Grafana repository already then:
|
||||
|
||||
@@ -54,19 +54,19 @@ Open [localhost:3004](http://localhost:3004) to view the docs.
|
||||
|
||||
### Images & Content
|
||||
|
||||
All markdown files are located in this repo (main grafana repo). But all images are added to the https://github.com/grafana/grafana.org repo. So the process of adding images is a bit complicated.
|
||||
All markdown files are located in this repo (main grafana repo). But all images are added to the https://github.com/grafana/website repo. So the process of adding images is a bit complicated.
|
||||
|
||||
First you need create a feature (PR) branch of https://github.com/grafana/grafana.org so you can make change. Then add the image to the `/static/img/docs` directory. Then make a commit that adds the image.
|
||||
First you need create a feature (PR) branch of https://github.com/grafana/website so you can make change. Then add the image to the `/static/img/docs` directory. Then make a commit that adds the image.
|
||||
|
||||
Then run:
|
||||
```
|
||||
make docs-build
|
||||
```
|
||||
|
||||
This will rebuild the docs docker container.
|
||||
This will rebuild the docs docker container.
|
||||
|
||||
To be able to use the image you have to quit (CTRL-C) the `make watch` command (that you run in the same directory as this README). Then simply rerun `make watch`, it will restart the docs server but now with access to your image.
|
||||
To be able to use the image you have to quit (CTRL-C) the `make watch` command (that you run in the same directory as this README). Then simply rerun `make watch`, it will restart the docs server but now with access to your image.
|
||||
|
||||
### Editing content
|
||||
|
||||
Changes to the markdown files should automatically cause a docs rebuild and live reload should reload the page in your browser.
|
||||
Changes to the markdown files should automatically cause a docs rebuild and live reload should reload the page in your browser.
|
||||
|
||||
@@ -3,7 +3,7 @@ title = "Grafana documentation"
|
||||
description = "Guides, Installation & Feature Documentation"
|
||||
keywords = ["grafana", "installation", "documentation"]
|
||||
type = "docs"
|
||||
aliases = ["v1.1", "guides/reference/admin", "v3.1"]
|
||||
aliases = ["/v1.1", "/guides/reference/admin", "/v3.1"]
|
||||
+++
|
||||
|
||||
# Grafana Documentation
|
||||
@@ -60,9 +60,9 @@ aliases = ["v1.1", "guides/reference/admin", "v3.1"]
|
||||
<h4>Provisioning</h4>
|
||||
<p>A guide to help you automate your Grafana setup & configuration.</p>
|
||||
</a>
|
||||
<a href="{{< relref "guides/whats-new-in-v6-2.md" >}}" class="nav-cards__item nav-cards__item--guide">
|
||||
<h4>What's new in v6.2</h4>
|
||||
<p>Article on all the new cool features and enhancements in v6.2</p>
|
||||
<a href="{{< relref "guides/whats-new-in-v6-3.md" >}}" class="nav-cards__item nav-cards__item--guide">
|
||||
<h4>What's new in v6.3</h4>
|
||||
<p>Article on all the new cool features and enhancements in v6.3</p>
|
||||
</a>
|
||||
<a href="{{< relref "tutorials/screencasts.md" >}}" class="nav-cards__item nav-cards__item--guide">
|
||||
<h4>Screencasts</h4>
|
||||
@@ -16,7 +16,7 @@ Grafana cli is a small executable that is bundled with Grafana-server and is sup
|
||||
|
||||
The CLI allows you to install, upgrade and manage your plugins on the machine it is running on.
|
||||
You can find more information about how to install and manage your plugins in the
|
||||
[plugins page]({{< relref "plugins/installation.md" >}}).
|
||||
[plugins page]({{< relref "../plugins/installation.md" >}}).
|
||||
|
||||
## Admin
|
||||
|
||||
@@ -37,7 +37,7 @@ If running the command returns this error:
|
||||
|
||||
then there are two flags that can be used to set homepath and the config file path.
|
||||
|
||||
`grafana-cli admin reset-admin-password --homepath "/usr/share/grafana" newpass`
|
||||
`grafana-cli --homepath "/usr/share/grafana" admin reset-admin-password newpass`
|
||||
|
||||
If you have not lost the admin password then it is better to set in the Grafana UI. If you need to set the password in a script then the [Grafana API](http://docs.grafana.org/http_api/user/#change-password) can be used. Here is an example using curl with basic auth:
|
||||
|
||||
|
||||
@@ -149,6 +149,8 @@ Since not all datasources have the same configuration settings we only have the
|
||||
| esVersion | number | Elasticsearch | Elasticsearch version as a number (2/5/56/60/70) |
|
||||
| timeField | string | Elasticsearch | Which field that should be used as timestamp |
|
||||
| interval | string | Elasticsearch | Index date time format. nil(No Pattern), 'Hourly', 'Daily', 'Weekly', 'Monthly' or 'Yearly' |
|
||||
| logMessageField | string | Elasticsearch | Which field should be used as the log message |
|
||||
| logLevelField | string | Elasticsearch | Which field should be used to indicate the priority of the log message |
|
||||
| authType | string | Cloudwatch | Auth provider. keys/credentials/arn |
|
||||
| assumeRoleArn | string | Cloudwatch | ARN of Assume Role |
|
||||
| defaultRegion | string | Cloudwatch | AWS region |
|
||||
@@ -179,6 +181,24 @@ Secure json data is a map of settings that will be encrypted with [secret key](/
|
||||
| accessKey | string | Cloudwatch | Access key for connecting to Cloudwatch |
|
||||
| secretKey | string | Cloudwatch | Secret key for connecting to Cloudwatch |
|
||||
|
||||
#### Custom HTTP headers for datasources
|
||||
Datasources managed by Grafanas provisioning can be configured to add HTTP headers to all requests
|
||||
going to that datasource. The header name is configured in the `jsonData` field and the header value should be
|
||||
configured in `secureJsonData`.
|
||||
|
||||
```yaml
|
||||
apiVersion: 1
|
||||
|
||||
datasources:
|
||||
- name: Graphite
|
||||
jsonData:
|
||||
httpHeaderName1: "HeaderName"
|
||||
httpHeaderName2: "Authorization"
|
||||
secureJsonData:
|
||||
httpHeaderValue1: "HeaderValue"
|
||||
httpHeaderValue2: "Bearer XXXXXXXXX"
|
||||
```
|
||||
|
||||
### Dashboards
|
||||
|
||||
It's possible to manage dashboards in Grafana by adding one or more yaml config files in the [`provisioning/dashboards`](/installation/configuration/#provisioning) directory. Each config file can contain a list of `dashboards providers` that will load dashboards into Grafana from the local filesystem.
|
||||
@@ -189,8 +209,8 @@ The dashboard provider config file looks somewhat like this:
|
||||
apiVersion: 1
|
||||
|
||||
providers:
|
||||
# <string> provider name
|
||||
- name: 'default'
|
||||
# <string> an unique provider name
|
||||
- name: 'a unique provider name'
|
||||
# <int> org id. will default to orgId 1 if not specified
|
||||
orgId: 1
|
||||
# <string, required> name of the dashboard folder. Required
|
||||
@@ -204,7 +224,7 @@ providers:
|
||||
# <bool> enable dashboard editing
|
||||
editable: true
|
||||
# <int> how often Grafana will scan for changed dashboards
|
||||
updateIntervalSeconds: 10
|
||||
updateIntervalSeconds: 10
|
||||
options:
|
||||
# <string, required> path to dashboard files on disk. Required
|
||||
path: /var/lib/grafana/dashboards
|
||||
@@ -274,7 +294,7 @@ notifiers:
|
||||
# or
|
||||
org_name: Main Org.
|
||||
is_default: true
|
||||
send_reminders: true
|
||||
send_reminder: true
|
||||
frequency: 1h
|
||||
disable_resolve_message: false
|
||||
# See `Supported Settings` section for settings supporter for each
|
||||
|
||||
@@ -167,26 +167,26 @@ Notifications can be sent by setting up an incoming webhook in Google Hangouts c
|
||||
|
||||
### All supported notifiers
|
||||
|
||||
Name | Type | Supports images
|
||||
-----|------------ | ------
|
||||
DingDing | `dingding` | yes, external only
|
||||
Discord | `discord` | yes
|
||||
Email | `email` | yes
|
||||
Google Hangouts Chat | `googlechat` | yes, external only
|
||||
Hipchat | `hipchat` | yes, external only
|
||||
Kafka | `kafka` | yes, external only
|
||||
Line | `line` | yes, external only
|
||||
Microsoft Teams | `teams` | yes, external only
|
||||
OpsGenie | `opsgenie` | yes, external only
|
||||
Pagerduty | `pagerduty` | yes, external only
|
||||
Prometheus Alertmanager | `prometheus-alertmanager` | yes, external only
|
||||
Pushover | `pushover` | yes
|
||||
Sensu | `sensu` | yes, external only
|
||||
Slack | `slack` | yes
|
||||
Telegram | `telegram` | yes
|
||||
Threema | `threema` | yes, external only
|
||||
VictorOps | `victorops` | yes, external only
|
||||
Webhook | `webhook` | yes, external only
|
||||
Name | Type | Supports images | Support alert rule tags
|
||||
-----|------|---------------- | -----------------------
|
||||
DingDing | `dingding` | yes, external only | no
|
||||
Discord | `discord` | yes | no
|
||||
Email | `email` | yes | no
|
||||
Google Hangouts Chat | `googlechat` | yes, external only | no
|
||||
Hipchat | `hipchat` | yes, external only | no
|
||||
Kafka | `kafka` | yes, external only | no
|
||||
Line | `line` | yes, external only | no
|
||||
Microsoft Teams | `teams` | yes, external only | no
|
||||
OpsGenie | `opsgenie` | yes, external only | no
|
||||
Pagerduty | `pagerduty` | yes, external only | no
|
||||
Prometheus Alertmanager | `prometheus-alertmanager` | yes, external only | yes
|
||||
Pushover | `pushover` | yes | no
|
||||
Sensu | `sensu` | yes, external only | no
|
||||
Slack | `slack` | yes | no
|
||||
Telegram | `telegram` | yes | no
|
||||
Threema | `threema` | yes, external only | no
|
||||
VictorOps | `victorops` | yes, external only | no
|
||||
Webhook | `webhook` | yes, external only | no
|
||||
|
||||
# Enable images in notifications {#external-image-store}
|
||||
|
||||
@@ -197,6 +197,16 @@ Be aware that some notifiers requires public access to the image to be able to i
|
||||
|
||||
Notification services which need public image access are marked as 'external only'.
|
||||
|
||||
# Use alert rule tags in notifications {#alert-rule-tags}
|
||||
|
||||
> Only available in Grafana v6.3+.
|
||||
|
||||
Grafana can include a list of tags (key/value) in the notification.
|
||||
It's called alert rule tags to contrast with tags parsed from timeseries.
|
||||
It currently supports only the Prometheus Alertmanager notifier.
|
||||
|
||||
This is an optional feature. You can get notifications without using alert rule tags.
|
||||
|
||||
# Configure the link back to Grafana from alert notifications
|
||||
|
||||
All alert notifications contain a link back to the triggered alert in the Grafana instance.
|
||||
|
||||
@@ -34,7 +34,7 @@ ldap_sync_ttl = 60
|
||||
# Example `whitelist = 192.168.1.1, 192.168.1.0/24, 2001::23, 2001::0/120`
|
||||
whitelist =
|
||||
# Optionally define more headers to sync other user attributes
|
||||
# Example `headers = Name:X-WEBAUTH-NAME Email:X-WEBAUTH-EMAIL`
|
||||
# Example `headers = Name:X-WEBAUTH-NAME Email:X-WEBAUTH-EMAIL Groups:X-WEBAUTH-GROUPS`
|
||||
headers =
|
||||
```
|
||||
|
||||
|
||||
@@ -12,7 +12,7 @@ weight = 3
|
||||
|
||||
# Enhanced LDAP Integration
|
||||
|
||||
> Enhanced LDAP Integration is only available in Grafana Enterprise. Read more about [Grafana Enterprise]({{< relref "enterprise/index.md" >}}).
|
||||
> Enhanced LDAP Integration is only available in Grafana Enterprise. Read more about [Grafana Enterprise]({{< relref "enterprise" >}}).
|
||||
|
||||
The enhanced LDAP integration adds additional functionality on top of the [existing LDAP integration]({{< relref "auth/ldap.md" >}}).
|
||||
|
||||
@@ -41,3 +41,30 @@ a user as member of a team and it will not be removed when the user signs in. Th
|
||||
5. Click on `Add group` button to save.
|
||||
|
||||
<div class="clearfix"></div>
|
||||
|
||||
## Active LDAP Synchronization
|
||||
|
||||
> Only available in Grafana Enterprise v6.3+
|
||||
|
||||
In the open source version of Grafana, user data from LDAP will be synchronized only during the login process when authenticating using LDAP.
|
||||
|
||||
With this feature you can configure Grafana to actively sync users with LDAP server(s) in the background. Role and team membership will be updated, removed users will be disabled and logged out. Only users that have logged into Grafana at least once will be synchronized.
|
||||
|
||||
```bash
|
||||
[auth.ldap]
|
||||
...
|
||||
|
||||
# You can use the Cron syntax or several predefined schedulers -
|
||||
# @yearly (or @annually) | Run once a year, midnight, Jan. 1st | 0 0 0 1 1 *
|
||||
# @monthly | Run once a month, midnight, first of month | 0 0 0 1 * *
|
||||
# @weekly | Run once a week, midnight between Sat/Sun | 0 0 0 * * 0
|
||||
# @daily (or @midnight) | Run once a day, midnight | 0 0 0 * * *
|
||||
# @hourly | Run once an hour, beginning of hour | 0 0 * * * *
|
||||
sync_cron = "0 0 1 * * *" # This is default value (At 1 am every day)
|
||||
# This cron expression format uses 6 space-separated fields (including seconds), for example
|
||||
# sync_cron = "* */10 * * * *"
|
||||
# This will run the LDAP Synchronization every 10th minute, which is also the minimal interval between the grafana sync times i.e. you cannot set it for every 9th minute
|
||||
|
||||
# You can also disable active LDAP synchronization
|
||||
active_sync_enabled = true # enabled by default
|
||||
```
|
||||
|
||||
@@ -99,3 +99,18 @@ allow_sign_up = true
|
||||
allowed_organizations = github google
|
||||
```
|
||||
|
||||
### Team Sync (Enterprise only)
|
||||
|
||||
> Only available in Grafana Enterprise v6.3+
|
||||
|
||||
With Team Sync you can map your GitHub org teams to teams in Grafana so that your users will automatically be added to
|
||||
the correct teams.
|
||||
|
||||
Your GitHub teams can be referenced in two ways:
|
||||
|
||||
- `https://github.com/orgs/<org>/teams/<team name>`
|
||||
- `@<org>/<team name>`
|
||||
|
||||
Example: `@grafana/developers`
|
||||
|
||||
[Learn more about Team Sync]({{< relref "auth/enhanced_ldap.md" >}})
|
||||
|
||||
@@ -126,8 +126,6 @@ group_search_base_dns = ["ou=groups,dc=grafana,dc=org"]
|
||||
group_search_filter_user_attribute = "uid"
|
||||
```
|
||||
|
||||
Also set `member_of = "dn"` in the `[servers.attributes]` section.
|
||||
|
||||
### Group Mappings
|
||||
|
||||
In `[[servers.group_mappings]]` you can map an LDAP group to a Grafana organization and role. These will be synced every time the user logs in, with LDAP being
|
||||
@@ -215,6 +213,67 @@ email = "email"
|
||||
# [[servers.group_mappings]] omitted for clarity
|
||||
```
|
||||
|
||||
### Multiple LDAP servers
|
||||
|
||||
Grafana does support receiving information from multiple LDAP servers.
|
||||
|
||||
**LDAP specific configuration file (ldap.toml):**
|
||||
```bash
|
||||
# --- First LDAP Server ---
|
||||
|
||||
[[servers]]
|
||||
host = "10.0.0.1"
|
||||
port = 389
|
||||
use_ssl = false
|
||||
start_tls = false
|
||||
ssl_skip_verify = false
|
||||
bind_dn = "cn=admin,dc=grafana,dc=org"
|
||||
bind_password = 'grafana'
|
||||
search_filter = "(cn=%s)"
|
||||
search_base_dns = ["ou=users,dc=grafana,dc=org"]
|
||||
|
||||
[servers.attributes]
|
||||
name = "givenName"
|
||||
surname = "sn"
|
||||
username = "cn"
|
||||
member_of = "memberOf"
|
||||
email = "email"
|
||||
|
||||
[[servers.group_mappings]]
|
||||
group_dn = "cn=admins,ou=groups,dc=grafana,dc=org"
|
||||
org_role = "Admin"
|
||||
grafana_admin = true
|
||||
|
||||
# --- Second LDAP Server ---
|
||||
|
||||
[[servers]]
|
||||
host = "10.0.0.2"
|
||||
port = 389
|
||||
use_ssl = false
|
||||
start_tls = false
|
||||
ssl_skip_verify = false
|
||||
|
||||
bind_dn = "cn=admin,dc=grafana,dc=org"
|
||||
bind_password = 'grafana'
|
||||
search_filter = "(cn=%s)"
|
||||
search_base_dns = ["ou=users,dc=grafana,dc=org"]
|
||||
|
||||
[servers.attributes]
|
||||
name = "givenName"
|
||||
surname = "sn"
|
||||
username = "cn"
|
||||
member_of = "memberOf"
|
||||
email = "email"
|
||||
|
||||
[[servers.group_mappings]]
|
||||
group_dn = "cn=editors,ou=groups,dc=grafana,dc=org"
|
||||
org_role = "Editor"
|
||||
|
||||
[[servers.group_mappings]]
|
||||
group_dn = "*"
|
||||
org_role = "Viewer"
|
||||
```
|
||||
|
||||
### Active Directory
|
||||
|
||||
[Active Directory](https://technet.microsoft.com/en-us/library/hh831484(v=ws.11).aspx) is a directory service which is commonly used in Windows environments.
|
||||
@@ -247,6 +306,8 @@ email = "mail"
|
||||
# [[servers.group_mappings]] omitted for clarity
|
||||
```
|
||||
|
||||
|
||||
|
||||
#### Port requirements
|
||||
|
||||
In above example SSL is enabled and an encrypted port have been configured. If your Active Directory don't support SSL please change `enable_ssl = false` and `port = 389`.
|
||||
|
||||
@@ -47,6 +47,13 @@ An active authenticated user that gets it token rotated will extend the `login_m
|
||||
This means that a user can close its browser and come back before `now + login_maximum_inactive_lifetime_days` and still being authenticated.
|
||||
This is true as long as the time since user login is less than `login_maximum_lifetime_days`.
|
||||
|
||||
#### Remote logout
|
||||
|
||||
You can logout from other devices by removing login sessions from the bottom of your profile page. If you are
|
||||
a Grafana admin user you can also do the same for any user from the Server Admin / Edit User view.
|
||||
|
||||
## Settings
|
||||
|
||||
Example:
|
||||
|
||||
```bash
|
||||
@@ -63,6 +70,9 @@ login_maximum_lifetime_days = 30
|
||||
|
||||
# How often should auth tokens be rotated for authenticated users when being active. The default is each 10 minutes.
|
||||
token_rotation_interval_minutes = 10
|
||||
|
||||
# The maximum lifetime (seconds) an api key can be used. If it is set all the api keys should have limited lifetime that is lower than this value.
|
||||
api_key_max_seconds_to_live = -1
|
||||
```
|
||||
|
||||
### Anonymous authentication
|
||||
|
||||
178
docs/sources/auth/saml.md
Normal file
178
docs/sources/auth/saml.md
Normal file
@@ -0,0 +1,178 @@
|
||||
+++
|
||||
title = "SAML Authentication"
|
||||
description = "Grafana SAML Authentication"
|
||||
keywords = ["grafana", "saml", "documentation", "saml-auth"]
|
||||
aliases = ["/auth/saml/"]
|
||||
type = "docs"
|
||||
[menu.docs]
|
||||
name = "SAML"
|
||||
parent = "authentication"
|
||||
weight = 5
|
||||
+++
|
||||
|
||||
# SAML Authentication
|
||||
|
||||
> SAML Authentication integration is only available in Grafana Enterprise. Read more about [Grafana Enterprise]({{< relref "enterprise" >}}).
|
||||
|
||||
> Only available in Grafana v6.3+
|
||||
|
||||
The SAML authentication integration allows your Grafana users to log in by
|
||||
using an external SAML Identity Provider (IdP). To enable this, Grafana becomes
|
||||
a Service Provider (SP) in the authentication flow, interacting with the IdP to
|
||||
exchange user information.
|
||||
|
||||
## Supported SAML
|
||||
|
||||
The SAML single-sign-on (SSO) standard is varied and flexible. Our implementation contains the subset of features needed to provide a smooth authentication experience into Grafana.
|
||||
|
||||
> Should you encounter any problems with our implementation, please don't hesitate to contact us.
|
||||
|
||||
At the moment of writing, Grafana supports:
|
||||
|
||||
1. From the Service Provider (SP) to the Identity Provider (IdP)
|
||||
|
||||
- `HTTP-POST` binding
|
||||
- `HTTP-Redirect` binding
|
||||
|
||||
2. From the Identity Provider (IdP) to the Service Provider (SP)
|
||||
|
||||
- `HTTP-POST` binding
|
||||
|
||||
3. In terms of security, we currently support signed and encrypted Assertions. However, signed or encrypted requests are not supported.
|
||||
|
||||
4. In terms of initiation, only SP-initiated requests are supported. There's no support for IdP-initiated request.
|
||||
|
||||
## Set up SAML Authentication
|
||||
|
||||
To use the SAML integration, you need to enable SAML in the [main config file]({{< relref "installation/configuration.md" >}}).
|
||||
|
||||
```bash
|
||||
[auth.saml]
|
||||
# Defaults to false. If true, the feature is enabled
|
||||
enabled = true
|
||||
|
||||
# Base64-encoded public X.509 certificate. Used to sign requests to the IdP
|
||||
certificate =
|
||||
|
||||
# Path to the public X.509 certificate. Used to sign requests to the IdP
|
||||
certificate_path =
|
||||
|
||||
# Base64-encoded private key. Used to decrypt assertions from the IdP
|
||||
private_key =
|
||||
|
||||
# Path to the private key. Used to decrypt assertions from the IdP
|
||||
private_key_path =
|
||||
|
||||
# Base64-encoded IdP SAML metadata XML. Used to verify and obtain binding locations from the IdP
|
||||
idp_metadata =
|
||||
|
||||
# Path to the SAML metadata XML. Used to verify and obtain binding locations from the IdP
|
||||
idp_metadata_path =
|
||||
|
||||
# URL to fetch SAML IdP metadata. Used to verify and obtain binding locations from the IdP
|
||||
idp_metadata_url =
|
||||
|
||||
# Duration, since the IdP issued a response and the SP is allowed to process it. Defaults to 90 seconds
|
||||
max_issue_delay =
|
||||
|
||||
# Duration, for how long the SP's metadata should be valid. Defaults to 48 hours
|
||||
metadata_valid_duration =
|
||||
|
||||
# Friendly name or name of the attribute within the SAML assertion to use as the user's name
|
||||
assertion_attribute_name = displayName
|
||||
|
||||
# Friendly name or name of the attribute within the SAML assertion to use as the user's login handle
|
||||
assertion_attribute_login = mail
|
||||
|
||||
# Friendly name or name of the attribute within the SAML assertion to use as the user's email
|
||||
assertion_attribute_email = mail
|
||||
```
|
||||
|
||||
Important to note:
|
||||
|
||||
- like any other Grafana configuration, use of [environment variables for these options is supported]({{< relref "installation/configuration.md#using-environment-variables" >}})
|
||||
- only one form of configuration option is required. Using multiple forms, e.g. both `certificate` and `certificate_path` will result in an error
|
||||
|
||||
## Grafana Configuration
|
||||
|
||||
An example working configuration example looks like:
|
||||
|
||||
```bash
|
||||
[auth.saml]
|
||||
enabled = true
|
||||
certificate_path = "/path/to/certificate.cert"
|
||||
private_key_path = "/path/to/private_key.pem"
|
||||
metadata_path = "/my/metadata.xml"
|
||||
max_issue_delay = 90s
|
||||
metadata_valid_duration = 48h
|
||||
assertion_attribute_name = displayName
|
||||
assertion_attribute_login = mail
|
||||
assertion_attribute_email = mail
|
||||
```
|
||||
|
||||
And here is a comprehensive list of the options:
|
||||
|
||||
| Setting | Required | Description | Default |
|
||||
| ----------------------------------------------------------- | -------- | -------------------------------------------------------------------------------------------------- | ------------- |
|
||||
| `enabled` | No | Whenever SAML authentication is allowed | `false` |
|
||||
| `certificate` or `certificate_path` | Yes | Base64-encoded string or Path for the SP X.509 certificate | |
|
||||
| `private_key` or `private_key_path` | Yes | Base64-encoded string or Path for the SP private key | |
|
||||
| `idp_metadata` or `idp_metadata_path` or `idp_metadata_url` | Yes | Base64-encoded string, Path or URL for the IdP SAML metadata XML | |
|
||||
| `max_issue_delay` | No | Duration, since the IdP issued a response and the SP is allowed to process it | `90s` |
|
||||
| `metadata_valid_duration` | No | Duration, for how long the SP's metadata should be valid | `48h` |
|
||||
| `assertion_attribute_name` | No | Friendly name or name of the attribute within the SAML assertion to use as the user's name | `displayName` |
|
||||
| `assertion_attribute_login` | No | Friendly name or name of the attribute within the SAML assertion to use as the user's login handle | `mail` |
|
||||
| `assertion_attribute_email` | No | Friendly name or name of the attribute within the SAML assertion to use as the user's email | `mail` |
|
||||
|
||||
### Cert and Private Key
|
||||
|
||||
The SAML SSO standard uses asymmetric encryption to exchange information between the SP (Grafana) and the IdP. To perform such encryption, you need a public part and a private part. In this case, the X.509 certificate provides the public part, while the private key provides the private part.
|
||||
|
||||
Grafana supports two ways of specifying both the `certificate` and `private_key`. Without a suffix (e.g. `certificate=`), the configuration assumes you've supplied the base64-encoded file contents. However, if specified with the `_path` suffix (e.g. `certificate_path=`) Grafana will treat it as a file path and attempt to read the file from the file system.
|
||||
|
||||
### IdP Metadata
|
||||
|
||||
Expanding on the above, we'll also need the public part from our IdP for message verification. The SAML IdP metadata XML tells us where and how we should exchange the user information.
|
||||
|
||||
Currently, we support three ways of specifying the IdP metadata. Without a suffix `idp_metadata=` Grafana assumes base64-encoded XML file contents, with the `_path` suffix assumes a file path and attempts to read the file from the file system and with the `_url` suffix assumes an URL and attempts to load the metadata from the given location.
|
||||
|
||||
### Max Issue Delay
|
||||
|
||||
Prevention of SAML response replay attacks and internal clock skews between the SP (Grafana), and the IdP is covered. You can set a maximum amount of time between the IdP issuing a response and the SP (Grafana) processing it.
|
||||
|
||||
The configuration options is specified as a duration e.g. `max_issue_delay = 90s` or `max_issue_delay = 1h`
|
||||
|
||||
### Metadata valid duration
|
||||
|
||||
As an SP, our metadata is likely to expire at some point, e.g. due to a certificate rotation or change of location binding. Grafana allows you to specify for how long the metadata should be valid. Leveraging the standard's `validUntil` field, you can tell consumers until when your metadata is going to be valid. The duration is computed by adding the duration to the current time.
|
||||
|
||||
The configuration option is specified as a duration e.g. `metadata_valid_duration = 48h`
|
||||
|
||||
## Identity Provider (IdP) registration
|
||||
|
||||
For the SAML integration to work correctly, you need to make the IdP aware of the SP.
|
||||
|
||||
The integration provides two key endpoints as part of Grafana:
|
||||
|
||||
- The `/saml/metadata` endpoint. Which contains the SP's metadata. You can either download and upload it manually or make the IdP request it directly from the endpoint. Some providers name it Identifier or Entity ID.
|
||||
|
||||
- The `/saml/acs` endpoint. Which is intended to receive the ACS (Assertion Customer Service) callback. Some providers name it SSO URL or Reply URL.
|
||||
|
||||
## Assertion mapping
|
||||
|
||||
During the SAML SSO authentication flow, we receive the ACS (Assertion Customer Service) callback. The callback contains all the relevant information of the user under authentication embedded in the SAML response. Grafana parses the response to create (or update) the user within its internal database.
|
||||
|
||||
For Grafana to map the user information, it looks at the individual attributes within the assertion. You can think of these attributes as Key/Value pairs (although, they contain more information than that).
|
||||
|
||||
Grafana provides configuration options that let you modify which keys to look at for these values. The data we need to create the user in Grafana is Name, Login handle, and email.
|
||||
|
||||
An example is `assertion_attribute_name = "givenName"` where Grafana looks within the assertion for an attribute with a friendly name or name of `givenName`. Both, the friendly name (e.g. `givenName`) or the name (e.g. `urn:oid:2.5.4.42`) can be used interchangeably as the value for the configuration option.
|
||||
|
||||
## Troubleshooting
|
||||
|
||||
To troubleshoot and get more log info enable saml debug logging in the [main config file]({{< relref "installation/configuration.md" >}}).
|
||||
|
||||
```bash
|
||||
[log]
|
||||
filters = saml.auth:debug
|
||||
```
|
||||
@@ -29,6 +29,10 @@ With Grafana Enterprise you can set up synchronization between LDAP Groups and T
|
||||
|
||||
Datasource permissions allow you to restrict query access to only specific Teams and Users. [Learn More]({{< relref "permissions/datasource_permissions.md" >}}).
|
||||
|
||||
### SAML Authentication
|
||||
|
||||
Enables your Grafana Enterprise users to authenticate with SAML. [Learn More]({{< relref "auth/saml.md" >}}).
|
||||
|
||||
### Premium Plugins
|
||||
|
||||
With a Grafana Enterprise license you will get access to premium plugins, including:
|
||||
@@ -31,34 +31,37 @@ The datasource can access metrics from four different services. You can configur
|
||||
- [Guide to setting up an Azure Active Directory Application for Azure Log Analytics.](https://dev.loganalytics.io/documentation/Authorization/AAD-Setup)
|
||||
- [Quickstart Guide for Application Insights.](https://dev.applicationinsights.io/quickstart/)
|
||||
|
||||
1. Accessed from the Grafana main menu, newly installed data sources can be added immediately within the Data Sources section. Next, click the "Add data source" button in the upper right. The data source will be available for selection in the Type select box.
|
||||
1. Accessed from the Grafana main menu, newly installed data sources can be added immediately within the Data Sources section. Next, click the "Add data source" button in the upper right. The Azure Monitor data source will be available for selection in the Cloud section in the list of data sources.
|
||||
|
||||
2. Select Azure Monitor from the Type dropdown:<br/>
|
||||
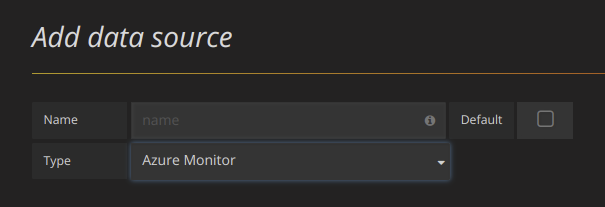
|
||||
3. In the name field, fill in a name for the data source. It can be anything. Some suggestions are Azure Monitor or App Insights.
|
||||
2. In the name field, Grafana will automatically fill in a name for the data source - `Azure Monitor` or something like `Azure Monitor - 3`. If you are going to configure multiple data sources then change the name to something more informative.
|
||||
|
||||
4. If you are using Azure Monitor, then you need 4 pieces of information from the Azure portal (see link above for detailed instructions):
|
||||
- **Tenant Id** (Azure Active Directory -> Properties -> Directory ID)
|
||||
- **Subscription Id** (Subscriptions -> Choose subscription -> Overview -> Subscription ID)
|
||||
- **Client Id** (Azure Active Directory -> App Registrations -> Choose your app -> Application ID)
|
||||
- **Client Secret** ( Azure Active Directory -> App Registrations -> Choose your app -> Keys)
|
||||
3. If you are using Azure Monitor, you need 4 pieces of information from the Azure portal (see link above for detailed instructions):
|
||||
|
||||
5. Paste these four items into the fields in the Azure Monitor API Details section:<br/>
|
||||
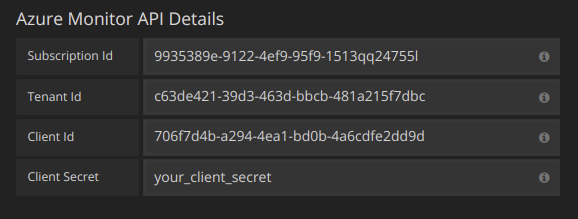
|
||||
- **Tenant Id** (Azure Active Directory -> Properties -> Directory ID)
|
||||
- **Client Id** (Azure Active Directory -> App Registrations -> Choose your app -> Application ID)
|
||||
- **Client Secret** ( Azure Active Directory -> App Registrations -> Choose your app -> Keys)
|
||||
- **Default Subscription Id** (Subscriptions -> Choose subscription -> Overview -> Subscription ID)
|
||||
|
||||
6. If you are also using the Azure Log Analytics service, then you need to specify these two config values (or you can reuse the Client Id and Secret from the previous step).
|
||||
- Client Id (Azure Active Directory -> App Registrations -> Choose your app -> Application ID)
|
||||
- Client Secret ( Azure Active Directory -> App Registrations -> Choose your app -> Keys -> Create a key -> Use client secret)
|
||||
4. Paste these four items into the fields in the Azure Monitor API Details section:
|
||||
{{< docs-imagebox img="/img/docs/v62/config_1_azure_monitor_details.png" class="docs-image--no-shadow" caption="Azure Monitor Configuration Details" >}}
|
||||
|
||||
7. If you are are using Application Insights, then you need two pieces of information from the Azure Portal (see link above for detailed instructions):
|
||||
- Application ID
|
||||
- API Key
|
||||
- The Subscription Id can be changed per query. Save the datasource and refresh the page to see the list of subscriptions available for the specified Client Id.
|
||||
|
||||
8. Paste these two items into the appropriate fields in the Application Insights API Details section:<br/>
|
||||
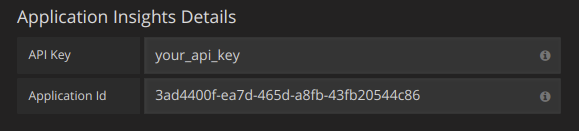
|
||||
5. If you are also using the Azure Log Analytics service, then you need to specify these two config values (or you can reuse the Client Id and Secret from the previous step).
|
||||
|
||||
9. Test that the configuration details are correct by clicking on the "Save & Test" button:<br/>
|
||||

|
||||
- Client Id (Azure Active Directory -> App Registrations -> Choose your app -> Application ID)
|
||||
- Client Secret (Azure Active Directory -> App Registrations -> Choose your app -> Keys -> Create a key -> Use client secret)
|
||||
|
||||
6. If you are using Application Insights, then you need two pieces of information from the Azure Portal (see link above for detailed instructions):
|
||||
|
||||
- Application ID
|
||||
- API Key
|
||||
|
||||
7. Paste these two items into the appropriate fields in the Application Insights API Details section:
|
||||
{{< docs-imagebox img="/img/docs/v62/config_2_app_insights_api_details.png" class="docs-image--no-shadow" caption="Application Insights Configuration Details" >}}
|
||||
|
||||
8. Test that the configuration details are correct by clicking on the "Save & Test" button:
|
||||
{{< docs-imagebox img="/img/docs/v62/config_3_save_and_test.png" class="docs-image--no-shadow" caption="Save and Test" >}}
|
||||
|
||||
Alternatively on step 4 if creating a new Azure Active Directory App, use the [Azure CLI](https://docs.microsoft.com/en-us/cli/azure/?view=azure-cli-latest):
|
||||
|
||||
@@ -68,17 +71,25 @@ az ad sp create-for-rbac -n "http://localhost:3000"
|
||||
|
||||
## Choose a Service
|
||||
|
||||
In the query editor for a panel, after choosing your Azure Monitor datasource, the first option is to choose a service. There are three options here: Azure Monitor, Application Insights and Azure Log Analytics. The query editor will change depending on which one you pick. Azure Monitor is the default.
|
||||
In the query editor for a panel, after choosing your Azure Monitor datasource, the first option is to choose a service. There are three options here:
|
||||
|
||||
- `Azure Monitor`
|
||||
- `Application Insights`
|
||||
- `Azure Log Analytics`
|
||||
|
||||
The query editor will change depending on which one you pick. Azure Monitor is the default.
|
||||
|
||||
## Querying the Azure Monitor Service
|
||||
|
||||
The Azure Monitor service provides metrics for all the Azure services that you have running. It helps you understand how your applications on Azure are performing and to proactively find issues affecting your applications.
|
||||
|
||||
If your Azure Monitor credentials give you access to multiple subscriptions then choose the appropriate subscription first.
|
||||
|
||||
Examples of metrics that you can get from the service are:
|
||||
|
||||
- Microsoft.Compute/virtualMachines - Percentage CPU
|
||||
- Microsoft.Network/networkInterfaces - Bytes sent
|
||||
- Microsoft.Storage/storageAccounts - Used Capacity
|
||||
- `Microsoft.Compute/virtualMachines - Percentage CPU`
|
||||
- `Microsoft.Network/networkInterfaces - Bytes sent`
|
||||
- `Microsoft.Storage/storageAccounts - Used Capacity`
|
||||
|
||||
{{< docs-imagebox img="/img/docs/v60/azuremonitor-service-query-editor.png" class="docs-image--no-shadow" caption="Azure Monitor Query Editor" >}}
|
||||
|
||||
@@ -112,12 +123,17 @@ Note that the Azure Monitor service does not support multiple values yet. If you
|
||||
|
||||
The Azure Monitor Datasource Plugin provides the following queries you can specify in the `Query` field in the Variable edit view. They allow you to fill a variable's options list.
|
||||
|
||||
| Name | Description |
|
||||
| -------------------------------------------------------- | -------------------------------------------------------------- |
|
||||
| *ResourceGroups()* | Returns a list of resource groups. |
|
||||
| *Namespaces(aResourceGroup)* | Returns a list of namespaces for the specified resource group. |
|
||||
| *ResourceNames(aResourceGroup, aNamespace)* | Returns a list of resource names. |
|
||||
| *MetricNames(aResourceGroup, aNamespace, aResourceName)* | Returns a list of metric names. |
|
||||
| Name | Description |
|
||||
| -------------------------------------------------------------------------------------------- | ------------------------------------------------------------------------------- |
|
||||
| _Subscriptions()_ | Returns a list of subscriptions. |
|
||||
| _ResourceGroups()_ | Returns a list of resource groups. |
|
||||
| _ResourceGroups(12345678-aaaa-bbbb-cccc-123456789aaa)_ | Returns a list of resource groups for a specified subscription. |
|
||||
| _Namespaces(aResourceGroup)_ | Returns a list of namespaces for the specified resource group. |
|
||||
| _Namespaces(12345678-aaaa-bbbb-cccc-123456789aaa, aResourceGroup)_ | Returns a list of namespaces for the specified resource group and subscription. |
|
||||
| _ResourceNames(aResourceGroup, aNamespace)_ | Returns a list of resource names. |
|
||||
| _ResourceNames(12345678-aaaa-bbbb-cccc-123456789aaaaResourceGroup, aNamespace)_ | Returns a list of resource names for a specified subscription. |
|
||||
| _MetricNames(aResourceGroup, aNamespace, aResourceName)_ | Returns a list of metric names. |
|
||||
| _MetricNames(12345678-aaaa-bbbb-cccc-123456789aaaaResourceGroup, aNamespace, aResourceName)_ | Returns a list of metric names for a specified subscription. |
|
||||
|
||||
Examples:
|
||||
|
||||
@@ -128,7 +144,7 @@ Examples:
|
||||
|
||||
{{< docs-imagebox img="/img/docs/v60/azuremonitor-service-variables.png" class="docs-image--no-shadow" caption="Nested Azure Monitor Template Variables" >}}
|
||||
|
||||
Checkout the [Templating]({{< relref "reference/templating.md" >}}) documentation for an introduction to the templating feature and the different
|
||||
Checkout the [Templating]({{< relref "../../reference/templating.md" >}}) documentation for an introduction to the templating feature and the different
|
||||
types of template variables.
|
||||
|
||||
### Azure Monitor Metrics Whitelist
|
||||
@@ -180,13 +196,13 @@ Examples:
|
||||
|
||||
Use the one of the following queries in the `Query` field in the Variable edit view.
|
||||
|
||||
Checkout the [Templating]({{< relref "reference/templating.md" >}}) documentation for an introduction to the templating feature and the different
|
||||
Checkout the [Templating]({{< relref "../../reference/templating.md" >}}) documentation for an introduction to the templating feature and the different
|
||||
types of template variables.
|
||||
|
||||
| Name | Description |
|
||||
| ---------------------------------- | ---------------------------------------------------------- |
|
||||
| *AppInsightsMetricNames()* | Returns a list of metric names. |
|
||||
| *AppInsightsGroupBys(aMetricName)* | Returns a list of group bys for the specified metric name. |
|
||||
| _AppInsightsMetricNames()_ | Returns a list of metric names. |
|
||||
| _AppInsightsGroupBys(aMetricName)_ | Returns a list of group bys for the specified metric name. |
|
||||
|
||||
Examples:
|
||||
|
||||
@@ -222,6 +238,8 @@ AzureActivity
|
||||
| order by TimeGenerated desc
|
||||
```
|
||||
|
||||
If your credentials give you access to multiple subscriptions then choose the appropriate subscription first.
|
||||
|
||||
{{< docs-imagebox img="/img/docs/v60/azureloganalytics-service-query-editor.png" class="docs-image--no-shadow" caption="Azure Log Analytics Query Editor" >}}
|
||||
|
||||
### Azure Log Analytics Macros
|
||||
@@ -229,26 +247,28 @@ AzureActivity
|
||||
To make writing queries easier there are several Grafana macros that can be used in the where clause of a query:
|
||||
|
||||
- `$__timeFilter()` - Expands to
|
||||
`TimeGenerated ≥ datetime(2018-06-05T18:09:58.907Z) and`
|
||||
`TimeGenerated ≤ datetime(2018-06-05T20:09:58.907Z)` where the from and to datetimes are from the Grafana time picker.
|
||||
`TimeGenerated ≥ datetime(2018-06-05T18:09:58.907Z) and`
|
||||
`TimeGenerated ≤ datetime(2018-06-05T20:09:58.907Z)` where the from and to datetimes are from the Grafana time picker.
|
||||
|
||||
- `$__timeFilter(datetimeColumn)` - Expands to
|
||||
`datetimeColumn ≥ datetime(2018-06-05T18:09:58.907Z) and`
|
||||
`datetimeColumn ≤ datetime(2018-06-05T20:09:58.907Z)` where the from and to datetimes are from the Grafana time picker.
|
||||
`datetimeColumn ≥ datetime(2018-06-05T18:09:58.907Z) and`
|
||||
`datetimeColumn ≤ datetime(2018-06-05T20:09:58.907Z)` where the from and to datetimes are from the Grafana time picker.
|
||||
|
||||
- `$__escapeMulti($myVar)` - is to be used with multi-value template variables that contains illegal characters. If $myVar has the value `'\\grafana-vm\Network(eth0)\Total','\\hello!'`, it expands to: `@'\\grafana-vm\Network(eth0)\Total', @'\\hello!'`. If using single value variables there no need for this macro, simply escape the variable inline instead - `@'\$myVar'`
|
||||
- `$__timeFrom()` - Returns the From datetime from the Grafana picker. Example: `datetime(2018-06-05T18:09:58.907Z)`.
|
||||
|
||||
- `$__contains(colName, $myVar)` - is to be used with multi-value template variables. If $myVar has the value `'value1','value2'`, it expands to: `colName in ('value1','value2')`.
|
||||
- `$__timeTo()` - Returns the From datetime from the Grafana picker. Example: `datetime(2018-06-05T20:09:58.907Z)`.
|
||||
|
||||
If using the `All` option, then check the `Include All Option` checkbox and in the `Custom all value` field type in the following value: `all`. If $myVar has value `all` then the macro will instead expand to `1 == 1`. For template variables with a lot of options, this will increase the query performance by not building a large where..in clause.
|
||||
- `$__escapeMulti($myVar)` - is to be used with multi-value template variables that contain illegal characters. If `$myVar` has the following two values as a string `'\\grafana-vm\Network(eth0)\Total','\\hello!'`, then it expands to: `@'\\grafana-vm\Network(eth0)\Total', @'\\hello!'`. If using single value variables there is no need for this macro, simply escape the variable inline instead - `@'\$myVar'`.
|
||||
|
||||
- `$__contains(colName, $myVar)` - is to be used with multi-value template variables. If `$myVar` has the value `'value1','value2'`, it expands to: `colName in ('value1','value2')`.
|
||||
|
||||
If using the `All` option, then check the `Include All Option` checkbox and in the `Custom all value` field type in the following value: `all`. If `$myVar` has value `all` then the macro will instead expand to `1 == 1`. For template variables with a lot of options, this will increase the query performance by not building a large where..in clause.
|
||||
|
||||
### Azure Log Analytics Builtin Variables
|
||||
|
||||
There are also some Grafana variables that can be used in Azure Log Analytics queries:
|
||||
|
||||
- `$__from` - Returns the From datetime from the Grafana picker. Example: `datetime(2018-06-05T18:09:58.907Z)`.
|
||||
- `$__to` - Returns the From datetime from the Grafana picker. Example: `datetime(2018-06-05T20:09:58.907Z)`.
|
||||
- `$__interval` - Grafana calculates the minimum time grain that can be used to group by time in queries. More details on how it works [here]({{< relref "reference/templating.md#interval-variables" >}}). It returns a time grain like `5m` or `1h` that can be used in the bin function. E.g. `summarize count() by bin(TimeGenerated, $__interval)`
|
||||
- `$__interval` - Grafana calculates the minimum time grain that can be used to group by time in queries. More details on how it works [here]({{< relref "../../reference/templating.md#interval-variables" >}}). It returns a time grain like `5m` or `1h` that can be used in the bin function. E.g. `summarize count() by bin(TimeGenerated, $__interval)`
|
||||
|
||||
### Azure Log Analytics Alerting
|
||||
|
||||
|
||||
@@ -130,7 +130,7 @@ Instead of hard-coding things like server, application and sensor name in you me
|
||||
Variables are shown as dropdown select boxes at the top of the dashboard. These dropdowns makes it easy to change the data
|
||||
being displayed in your dashboard.
|
||||
|
||||
Checkout the [Templating]({{< relref "reference/templating.md" >}}) documentation for an introduction to the templating feature and the different
|
||||
Checkout the [Templating]({{< relref "../../reference/templating.md" >}}) documentation for an introduction to the templating feature and the different
|
||||
types of template variables.
|
||||
|
||||
### Query variable
|
||||
|
||||
@@ -79,6 +79,18 @@ Identifier | Description
|
||||
`s` | second
|
||||
`ms` | millisecond
|
||||
|
||||
### Logs (BETA)
|
||||
|
||||
> Only available in Grafana v6.3+.
|
||||
|
||||
There are two parameters, `Message field name` and `Level field name`, that can optionally be configured from the data source settings page that determine
|
||||
which fields will be used for log messages and log levels when visualizing logs in [Explore](/features/explore).
|
||||
|
||||
For example, if you're using a default setup of Filebeat for shipping logs to Elasticsearch the following configuration should work:
|
||||
|
||||
- **Message field name:** message
|
||||
- **Level field name:** fields.level
|
||||
|
||||
## Metric Query editor
|
||||
|
||||

|
||||
@@ -108,7 +120,7 @@ Instead of hard-coding things like server, application and sensor name in you me
|
||||
Variables are shown as dropdown select boxes at the top of the dashboard. These dropdowns makes it easy to change the data
|
||||
being displayed in your dashboard.
|
||||
|
||||
Checkout the [Templating]({{< relref "reference/templating.md" >}}) documentation for an introduction to the templating feature and the different
|
||||
Checkout the [Templating]({{< relref "../../reference/templating.md" >}}) documentation for an introduction to the templating feature and the different
|
||||
types of template variables.
|
||||
|
||||
### Query variable
|
||||
@@ -118,7 +130,7 @@ The Elasticsearch data source supports two types of queries you can use in the *
|
||||
Query | Description
|
||||
------------ | -------------
|
||||
*{"find": "fields", "type": "keyword"}* | Returns a list of field names with the index type `keyword`.
|
||||
*{"find": "terms", "field": "@hostname", "size": 1000}* | Returns a list of values for a field using term aggregation. Query will user current dashboard time range as time range for query.
|
||||
*{"find": "terms", "field": "@hostname", "size": 1000}* | Returns a list of values for a field using term aggregation. Query will use current dashboard time range as time range for query.
|
||||
*{"find": "terms", "field": "@hostname", "query": '<lucene query>'}* | Returns a list of values for a field using term aggregation & and a specified lucene query filter. Query will use current dashboard time range as time range for query.
|
||||
|
||||
There is a default size limit of 500 on terms queries. Set the size property in your query to set a custom limit.
|
||||
@@ -162,6 +174,28 @@ Time | The name of the time field, needs to be date field.
|
||||
Text | Event description field.
|
||||
Tags | Optional field name to use for event tags (can be an array or a CSV string).
|
||||
|
||||
## Querying Logs (BETA)
|
||||
|
||||
> Only available in Grafana v6.3+.
|
||||
|
||||
Querying and displaying log data from Elasticsearch is available via [Explore](/features/explore).
|
||||
|
||||

|
||||
|
||||
Select the Elasticsearch data source, change to Logs using the Metrics/Logs switcher, and then optionally enter a lucene query into the query field to filter the log messages.
|
||||
|
||||
Finally, press the `Enter` key or the `Run Query` button to display your logs.
|
||||
|
||||
### Log Queries
|
||||
|
||||
Once the result is returned, the log panel shows a list of log rows and a bar chart where the x-axis shows the time and the y-axis shows the frequency/count.
|
||||
|
||||
Note that the fields used for log message and level is based on an [optional datasource configuration](#logs-beta).
|
||||
|
||||
### Filter Log Messages
|
||||
|
||||
Optionally enter a lucene query into the query field to filter the log messages. For example, using a default Filebeat setup you should be able to use `fields.level:error` to only show error log messages.
|
||||
|
||||
## Configure the Datasource with Provisioning
|
||||
|
||||
It's now possible to configure datasources using config files with Grafana's provisioning system. You can read more about how it works and all the settings you can set for datasources on the [provisioning docs page](/administration/provisioning/#datasources)
|
||||
@@ -181,3 +215,22 @@ datasources:
|
||||
interval: Daily
|
||||
timeField: "@timestamp"
|
||||
```
|
||||
|
||||
or, for logs:
|
||||
|
||||
```yaml
|
||||
apiVersion: 1
|
||||
|
||||
datasources:
|
||||
- name: elasticsearch-v7-filebeat
|
||||
type: elasticsearch
|
||||
access: proxy
|
||||
database: "[filebeat-]YYYY.MM.DD"
|
||||
url: http://localhost:9200
|
||||
jsonData:
|
||||
interval: Daily
|
||||
timeField: "@timestamp"
|
||||
esVersion: 70
|
||||
logMessageField: message
|
||||
logLevelField: fields.level
|
||||
```
|
||||
|
||||
@@ -91,7 +91,7 @@ Instead of hard-coding things like server, application and sensor name in you me
|
||||
Variables are shown as dropdown select boxes at the top of the dashboard. These dropdowns makes it easy to change the data
|
||||
being displayed in your dashboard.
|
||||
|
||||
Checkout the [Templating]({{< relref "reference/templating.md" >}}) documentation for an introduction to the templating feature and the different
|
||||
Checkout the [Templating]({{< relref "../../reference/templating.md" >}}) documentation for an introduction to the templating feature and the different
|
||||
types of template variables.
|
||||
|
||||
Graphite 1.1 introduced tags and Grafana added support for Graphite queries with tags in version 5.0. To create a variable using tag values, then you need to use the Grafana functions `tags` and `tag_values`.
|
||||
@@ -140,7 +140,7 @@ Example of a tag expression with regex formatting and using the Equal Tilde oper
|
||||
server=~${servers:regex}
|
||||
```
|
||||
|
||||
Checkout the [Advanced Formatting Options section in the Variables]({{< relref "reference/templating.md#advanced-formatting-options" >}}) documentation for examples and details.
|
||||
Checkout the [Advanced Formatting Options section in the Variables]({{< relref "../../reference/templating.md#advanced-formatting-options" >}}) documentation for examples and details.
|
||||
|
||||
## Annotations
|
||||
|
||||
|
||||
@@ -117,6 +117,26 @@ You can switch to raw query mode by clicking hamburger icon and then `Switch edi
|
||||
You can remove the group by time by clicking on the `time` part and then the `x` icon. You can
|
||||
change the option `Format As` to `Table` if you want to show raw data in the `Table` panel.
|
||||
|
||||
## Querying Logs (BETA)
|
||||
|
||||
> Only available in Grafana v6.3+.
|
||||
|
||||
Querying and displaying log data from InfluxDB is available via [Explore](/features/explore).
|
||||
|
||||

|
||||
|
||||
Select the InfluxDB data source, change to Logs using the Metrics/Logs switcher,
|
||||
and then use the `Measurements/Fields` button to display your logs.
|
||||
|
||||
### Log Queries
|
||||
|
||||
The Logs Explorer (the `Measurements/Fields` button) next to the query field shows a list of measurements and fields. Choose the desired measurement that contains your log data and then choose which field Explore should use to display the log message.
|
||||
|
||||
Once the result is returned, the log panel shows a list of log rows and a bar chart where the x-axis shows the time and the y-axis shows the frequency/count.
|
||||
|
||||
### Filter search
|
||||
|
||||
To add a filter click the plus icon to the right of the `Measurements/Fields` button or a condition. You can remove tag filters by clicking on the first select and choosing `--remove filter--`.
|
||||
|
||||
## Templating
|
||||
|
||||
@@ -124,7 +144,7 @@ Instead of hard-coding things like server, application and sensor name in you me
|
||||
Variables are shown as dropdown select boxes at the top of the dashboard. These dropdowns makes it easy to change the data
|
||||
being displayed in your dashboard.
|
||||
|
||||
Checkout the [Templating]({{< relref "reference/templating.md" >}}) documentation for an introduction to the templating feature and the different
|
||||
Checkout the [Templating]({{< relref "../../reference/templating.md" >}}) documentation for an introduction to the templating feature and the different
|
||||
types of template variables.
|
||||
|
||||
### Query variable
|
||||
|
||||
@@ -92,6 +92,23 @@ Example queries:
|
||||
* `{name="kafka"} tsdb-ops.*io:2003`
|
||||
* `{instance=~"kafka-[23]",name="kafka"} kafka.server:type=ReplicaManager`
|
||||
|
||||
## Live Tailing
|
||||
|
||||
To view your logs live as they are added, choose `Live` from the refresh dropdown, and you should see your logs be displayed in real time.
|
||||
|
||||
Note that Live Tailing relies on two Websocket connections: one between the browser and the Grafana server, and another between the Grafana server and the Loki server. If you run any reverse proxies, please configure them accordingly.
|
||||
|
||||
|
||||
> Note: This feature is only available in Grafana v6.3+
|
||||
|
||||
## Log Context
|
||||
|
||||
When using a search expression as detailed above, you now have the ability to retrieve the context surrounding your filtered results.
|
||||
By clicking the `Show Context` link on the filtered rows, you'll be able to investigate the log messages that came before and after the
|
||||
log message you're interested in.
|
||||
|
||||
> Note: This feature is only available in Grafana v6.3+
|
||||
|
||||
## Templating
|
||||
|
||||
Template variables are not yet supported by Loki.
|
||||
|
||||
@@ -300,7 +300,7 @@ Any series lacking a value in a 3 minute window will have a value of zero which
|
||||
|
||||
Instead of hard-coding things like server, application and sensor name in you metric queries you can use variables in their place. Variables are shown as dropdown select boxes at the top of the dashboard. These dropdowns makes it easy to change the data being displayed in your dashboard.
|
||||
|
||||
Checkout the [Templating]({{< relref "reference/templating.md" >}}) documentation for an introduction to the templating feature and the different types of template variables.
|
||||
Checkout the [Templating]({{< relref "../../reference/templating.md" >}}) documentation for an introduction to the templating feature and the different types of template variables.
|
||||
|
||||
### Query Variable
|
||||
|
||||
@@ -370,7 +370,7 @@ Grafana automatically creates a quoted, comma-separated string for multi-value v
|
||||
|
||||
`${servers:csv}`
|
||||
|
||||
Read more about variable formatting options in the [Variables]({{< relref "reference/templating.md#advanced-formatting-options" >}}) documentation.
|
||||
Read more about variable formatting options in the [Variables]({{< relref "../../reference/templating.md#advanced-formatting-options" >}}) documentation.
|
||||
|
||||
## Annotations
|
||||
|
||||
|
||||
@@ -238,7 +238,7 @@ This feature is currently available in the nightly builds and will be included i
|
||||
|
||||
Instead of hard-coding things like server, application and sensor name in you metric queries you can use variables in their place. Variables are shown as dropdown select boxes at the top of the dashboard. These dropdowns makes it easy to change the data being displayed in your dashboard.
|
||||
|
||||
Checkout the [Templating]({{< relref "reference/templating.md" >}}) documentation for an introduction to the templating feature and the different types of template variables.
|
||||
Checkout the [Templating]({{< relref "../../reference/templating.md" >}}) documentation for an introduction to the templating feature and the different types of template variables.
|
||||
|
||||
### Query Variable
|
||||
|
||||
@@ -316,7 +316,7 @@ Grafana automatically creates a quoted, comma-separated string for multi-value v
|
||||
|
||||
`${servers:csv}`
|
||||
|
||||
Read more about variable formatting options in the [Variables]({{< relref "reference/templating.md#advanced-formatting-options" >}}) documentation.
|
||||
Read more about variable formatting options in the [Variables]({{< relref "../../reference/templating.md#advanced-formatting-options" >}}) documentation.
|
||||
|
||||
## Annotations
|
||||
|
||||
|
||||
@@ -53,7 +53,7 @@ Instead of hard-coding things like server, application and sensor name in you me
|
||||
Variables are shown as dropdown select boxes at the top of the dashboard. These dropdowns makes it easy to change the data
|
||||
being displayed in your dashboard.
|
||||
|
||||
Checkout the [Templating]({{< relref "reference/templating.md" >}}) documentation for an introduction to the templating feature and the different
|
||||
Checkout the [Templating]({{< relref "../../reference/templating.md" >}}) documentation for an introduction to the templating feature and the different
|
||||
types of template variables.
|
||||
|
||||
### Query variable
|
||||
|
||||
@@ -242,7 +242,7 @@ ORDER BY time
|
||||
|
||||
Instead of hard-coding things like server, application and sensor name in you metric queries you can use variables in their place. Variables are shown as dropdown select boxes at the top of the dashboard. These dropdowns makes it easy to change the data being displayed in your dashboard.
|
||||
|
||||
Checkout the [Templating]({{< relref "reference/templating.md" >}}) documentation for an introduction to the templating feature and the different types of template variables.
|
||||
Checkout the [Templating]({{< relref "../../reference/templating.md" >}}) documentation for an introduction to the templating feature and the different types of template variables.
|
||||
|
||||
### Query Variable
|
||||
|
||||
@@ -318,7 +318,7 @@ Grafana automatically creates a quoted, comma-separated string for multi-value v
|
||||
|
||||
`${servers:csv}`
|
||||
|
||||
Read more about variable formatting options in the [Variables]({{< relref "reference/templating.md#advanced-formatting-options" >}}) documentation.
|
||||
Read more about variable formatting options in the [Variables]({{< relref "../../reference/templating.md#advanced-formatting-options" >}}) documentation.
|
||||
|
||||
## Annotations
|
||||
|
||||
|
||||
@@ -61,7 +61,7 @@ Instead of hard-coding things like server, application and sensor name in your m
|
||||
Variables are shown as dropdown select boxes at the top of the dashboard. These dropdowns makes it easy to change the data
|
||||
being displayed in your dashboard.
|
||||
|
||||
Checkout the [Templating]({{< relref "reference/templating.md" >}}) documentation for an introduction to the templating feature and the different
|
||||
Checkout the [Templating]({{< relref "../../reference/templating.md" >}}) documentation for an introduction to the templating feature and the different
|
||||
types of template variables.
|
||||
|
||||
### Query variable
|
||||
|
||||
@@ -172,7 +172,7 @@ Instead of hard-coding things like server, application and sensor name in you me
|
||||
Variables are shown as dropdown select boxes at the top of the dashboard. These dropdowns makes it easy to change the data
|
||||
being displayed in your dashboard.
|
||||
|
||||
Checkout the [Templating]({{< relref "reference/templating.md" >}}) documentation for an introduction to the templating feature and the different
|
||||
Checkout the [Templating]({{< relref "../../reference/templating.md" >}}) documentation for an introduction to the templating feature and the different
|
||||
types of template variables.
|
||||
|
||||
### Query Variable
|
||||
|
||||
@@ -75,23 +75,12 @@ Suggestions can appear under the query field - click on them to update your quer
|
||||
|
||||
Click on the filter button <span title="Filter for label" class="logs-label__icon fa fa-search-plus"></span> in a labels column in the Table panel to add filters to the query expression. This works with multiple queries too - the filter will be added for all the queries.
|
||||
|
||||
## Logs Integration - Loki-specific Features
|
||||
## Logs Integration
|
||||
|
||||
For Grafana 6.0, the first log integration is for the new open source log aggregation system from Grafana Labs - [Loki](https://github.com/grafana/loki). Loki is designed to be very cost effective, as it does not index the contents of the logs, but rather a set of labels for each log stream. The logs from Loki are queried in a similar way to querying with label selectors in Prometheus. It uses labels to group log streams which can be made to match up with your Prometheus labels. Read more about Grafana Loki [here](https://github.com/grafana/loki) or the Grafana Labs hosted variant: [Grafana Cloud Logs](https://grafana.com/loki).
|
||||
|
||||
See the [Loki's data source documentation](../datasources/loki) on how to query for log data.
|
||||
|
||||
### Switching from Metrics to Logs
|
||||
|
||||
If you switch from a Prometheus query to a logs query (you can do a split first to have your metrics and logs side by side) then it will keep the labels from your query that exist in the logs and use those to query the log streams. For example, the following Prometheus query:
|
||||
|
||||
`grafana_alerting_active_alerts{job="grafana"}`
|
||||
|
||||
after switching to the Logs datasource, the query changes to:
|
||||
|
||||
`{job="grafana"}`
|
||||
|
||||
This will return a chunk of logs in the selected time range that can be grepped/text searched.
|
||||
Along with metrics, Explore allows you to investigate your logs with the following data sources:
|
||||
- [Loki](../datasources/loki)
|
||||
- [InfluxDB](../datasources/influxdb)
|
||||
- [Elasticsearch](../datasources/elasticsearch)
|
||||
|
||||
### Deduping
|
||||
|
||||
@@ -108,3 +97,21 @@ There are some other check boxes under the logging graph apart from the Deduping
|
||||
* Timestamp: shows/hides the Timestamp column
|
||||
* Local time: shows/hides the Local time column
|
||||
* Labels: shows/hides the label filters column
|
||||
|
||||
### Loki-specific Features
|
||||
|
||||
As mentioned, one of the log integrations is for the new open source log aggregation system from Grafana Labs - [Loki](https://github.com/grafana/loki). Loki is designed to be very cost effective, as it does not index the contents of the logs, but rather a set of labels for each log stream. The logs from Loki are queried in a similar way to querying with label selectors in Prometheus. It uses labels to group log streams which can be made to match up with your Prometheus labels. Read more about Grafana Loki [here](https://github.com/grafana/loki) or the Grafana Labs hosted variant: [Grafana Cloud Logs](https://grafana.com/loki).
|
||||
|
||||
See [Loki's data source documentation](../datasources/loki) on how to query for log data.
|
||||
|
||||
#### Switching from Metrics to Logs
|
||||
|
||||
If you switch from a Prometheus query to a logs query (you can do a split first to have your metrics and logs side by side) then it will keep the labels from your query that exist in the logs and use those to query the log streams. For example, the following Prometheus query:
|
||||
|
||||
`grafana_alerting_active_alerts{job="grafana"}`
|
||||
|
||||
after switching to the Logs datasource, the query changes to:
|
||||
|
||||
`{job="grafana"}`
|
||||
|
||||
This will return a chunk of logs in the selected time range that can be grepped/text searched.
|
||||
|
||||
@@ -33,22 +33,39 @@ The general tab allows customization of a panel's appearance and menu options.
|
||||
- **Transparent** - If checked, removes the solid background of the panel (default not checked).
|
||||
|
||||
### Repeat
|
||||
Repeat a panel for each value of a variable. Repeating panels are described in more detail [here]({{< relref "reference/templating.md#repeating-panels" >}}).
|
||||
Repeat a panel for each value of a variable. Repeating panels are described in more detail [here]({{< relref "../../reference/templating.md#repeating-panels" >}}).
|
||||
|
||||
### Drilldown / detail link
|
||||
### Data link
|
||||
|
||||
The drilldown section allows adding dynamic links to the panel that can link to other dashboards
|
||||
or URLs.
|
||||
> Only available in Grafana v6.3+.
|
||||
|
||||
Each link has a title, a type and params. A link can be either a ``dashboard`` or ``absolute`` links.
|
||||
If it is a dashboard link, the `dashboard` value must be the name of a dashboard. If it is an
|
||||
`absolute` link, the URL is the URL to the link.
|
||||
Data link in graph settings allows adding dynamic links to the visualization. Those links can link to either other dashboard or to an external URL.
|
||||
|
||||
``params`` allows adding additional URL params to the links. The format is the ``name=value`` with
|
||||
multiple params separated by ``&``. Template variables can be added as values using ``$myvar``.
|
||||
{{< docs-imagebox img="/img/docs/data_link.png" max-width= "800px" >}}
|
||||
|
||||
When linking to another dashboard that uses template variables, you can use ``var-myvar=value`` to
|
||||
populate the template variable to a desired value from the link.
|
||||
Data link is defined by title, url and a setting whether or not it should be opened in a new window.
|
||||
|
||||
**Title** is a human readable label for the link that will be displayed in the UI. The link itself is accessible in the graph's context menu when user **clicks on a single data point**:
|
||||
|
||||
{{< docs-imagebox img="/img/docs/data_link_tooltip.png" max-width= "800px" >}}
|
||||
|
||||
**URL** field allows the URL configuration for a given link. Apart from regular query params it also supports built-in variables and dashboard variables that you can choose from
|
||||
available suggestions:
|
||||
|
||||
{{< docs-imagebox img="/img/docs/data_link_typeahead.png" max-width= "800px" >}}
|
||||
|
||||
|
||||
Available built-in variables are:
|
||||
|
||||
1. ``__all_variables`` - will add all current dashboard's variables to the URL
|
||||
2. ``__url_time_range`` - will add current dashboard's time range to the URL (i.e. ``?from=now-6h&to=now``)
|
||||
3. ``__series_name`` - will add series name as a query param in the URL (i.e. ``?series=B-series``)
|
||||
4. ``__value_time`` - will add datapoint's timestamp (Unix ms epoch) to the URL (i.e. ``?time=1560268814105``)
|
||||
|
||||
|
||||
#### Template variables in data links
|
||||
When linking to another dashboard that uses template variables, you can use ``var-myvar=${myvar}`` syntax (where ``myvar`` is a name of template variable)
|
||||
to use current dashboard's variable value.
|
||||
|
||||
## Metrics
|
||||
|
||||
|
||||
Some files were not shown because too many files have changed in this diff Show More
Reference in New Issue
Block a user