mirror of
https://github.com/grafana/grafana.git
synced 2026-01-15 05:35:41 +00:00
Compare commits
90 Commits
wb/pkg-plu
...
v10.4.1
| Author | SHA1 | Date | |
|---|---|---|---|
|
|
d3ce857c0e | ||
|
|
d486fa87ab | ||
|
|
c17383d40b | ||
|
|
80ac64c540 | ||
|
|
d8c0674865 | ||
|
|
1e4235c106 | ||
|
|
591cb82b90 | ||
|
|
de5b771270 | ||
|
|
2fb6deb115 | ||
|
|
035e271bbf | ||
|
|
e258f2e4e1 | ||
|
|
7db05f5d38 | ||
|
|
0f1651658b | ||
|
|
17ab162a11 | ||
|
|
4b0a5f022f | ||
|
|
b946bcad5b | ||
|
|
54d6cb7e96 | ||
|
|
1cca6538b7 | ||
|
|
3f596e8e8c | ||
|
|
335aa31bde | ||
|
|
f4a9aa1171 | ||
|
|
1d73820ac7 | ||
|
|
45e78b36bf | ||
|
|
af6316a8f6 | ||
|
|
27107326d5 | ||
|
|
e865301665 | ||
|
|
0b50a9bfe3 | ||
|
|
1d582410ab | ||
|
|
0a0e9f70cd | ||
|
|
9bbd9cf4ca | ||
|
|
e430baa819 | ||
|
|
1b43fc90d4 | ||
|
|
ab89de7e85 | ||
|
|
5d46a9ca18 | ||
|
|
32e7839cb8 | ||
|
|
7f48c3168b | ||
|
|
980352f073 | ||
|
|
595d967d60 | ||
|
|
b30b93df2c | ||
|
|
5c2b7e5c62 | ||
|
|
ee475ad250 | ||
|
|
b78ecddf56 | ||
|
|
b48e2102b3 | ||
|
|
303a80cdb5 | ||
|
|
b379816be6 | ||
|
|
391a24025f | ||
|
|
fbd2400e4a | ||
|
|
f5271952d0 | ||
|
|
90b9cefd4b | ||
|
|
2c3f9581cf | ||
|
|
4d40128896 | ||
|
|
23320f3cab | ||
|
|
9dcf8e650f | ||
|
|
fa8a096438 | ||
|
|
3171158e44 | ||
|
|
906490eeac | ||
|
|
f2333ae807 | ||
|
|
deec5361b7 | ||
|
|
1c79d8e0c0 | ||
|
|
dcec8aafb7 | ||
|
|
c0da5fd7a5 | ||
|
|
d308b47e97 | ||
|
|
676fd4c08e | ||
|
|
6263884192 | ||
|
|
14982f1095 | ||
|
|
e31e447c5e | ||
|
|
e74ffd5817 | ||
|
|
cc010b657a | ||
|
|
a8ef92b04c | ||
|
|
f30ffd85fb | ||
|
|
01d742fd88 | ||
|
|
ceb30ce23c | ||
|
|
ff860eb5d0 | ||
|
|
8290d41f4b | ||
|
|
09663d856d | ||
|
|
58d6e0b3d2 | ||
|
|
dadc81b0e9 | ||
|
|
deb12d4e94 | ||
|
|
a0c2fb1b8c | ||
|
|
fed9e2f361 | ||
|
|
e229eef365 | ||
|
|
272ca9a46b | ||
|
|
13e7099cc3 | ||
|
|
e3d8fca42a | ||
|
|
fedf3e2e6e | ||
|
|
2fbc070fd1 | ||
|
|
6e7ba7c593 | ||
|
|
f6ab4e1323 | ||
|
|
8e9fb37451 | ||
|
|
e52118c7d1 |
272
.drone.yml
272
.drone.yml
File diff suppressed because it is too large
Load Diff
4
.github/bot.md
vendored
4
.github/bot.md
vendored
@@ -9,8 +9,8 @@ Comment commands:
|
||||
|
||||
Label commands:
|
||||
|
||||
* Add label `bot/question` the the bot will close with standard question message and add label `type/question`
|
||||
* Add label `bot/duplicate` the the bot will close with standard duplicate message and add label `type/duplicate`
|
||||
* Add label `bot/question` the bot will close with standard question message and add label `type/question`
|
||||
* Add label `bot/duplicate` the bot will close with standard duplicate message and add label `type/duplicate`
|
||||
* Add label `bot/needs more info` for bot to request more info (or use comment command mentioned above)
|
||||
* Add label `bot/close feature request` for bot to close a feature request with standard message and adds label `not implemented`
|
||||
* Add label `bot/no new info` for bot to close an issue where we asked for more info but has not received any updates in at least 14 days.
|
||||
|
||||
2
.github/workflows/alerting-swagger-gen.yml
vendored
2
.github/workflows/alerting-swagger-gen.yml
vendored
@@ -16,7 +16,7 @@ jobs:
|
||||
- name: Set go version
|
||||
uses: actions/setup-go@v4
|
||||
with:
|
||||
go-version: '1.21.6'
|
||||
go-version: '1.21.8'
|
||||
- name: Build swagger
|
||||
run: |
|
||||
make -C pkg/services/ngalert/api/tooling post.json api.json
|
||||
|
||||
2
.github/workflows/codeql-analysis.yml
vendored
2
.github/workflows/codeql-analysis.yml
vendored
@@ -47,7 +47,7 @@ jobs:
|
||||
name: Set go version
|
||||
uses: actions/setup-go@v4
|
||||
with:
|
||||
go-version: '1.21.6'
|
||||
go-version: '1.21.8'
|
||||
|
||||
# Initializes the CodeQL tools for scanning.
|
||||
- name: Initialize CodeQL
|
||||
|
||||
2
.github/workflows/doc-validator.yml
vendored
2
.github/workflows/doc-validator.yml
vendored
@@ -7,7 +7,7 @@ jobs:
|
||||
doc-validator:
|
||||
runs-on: "ubuntu-latest"
|
||||
container:
|
||||
image: "grafana/doc-validator:v4.0.0"
|
||||
image: "grafana/doc-validator:v4.1.1"
|
||||
steps:
|
||||
- name: "Checkout code"
|
||||
uses: "actions/checkout@v4"
|
||||
|
||||
2
.github/workflows/pr-codeql-analysis-go.yml
vendored
2
.github/workflows/pr-codeql-analysis-go.yml
vendored
@@ -35,7 +35,7 @@ jobs:
|
||||
- name: Set go version
|
||||
uses: actions/setup-go@v4
|
||||
with:
|
||||
go-version: '1.21.6'
|
||||
go-version: '1.21.8'
|
||||
|
||||
# Initializes the CodeQL tools for scanning.
|
||||
- name: Initialize CodeQL
|
||||
|
||||
2
.github/workflows/publish-kinds-next.yml
vendored
2
.github/workflows/publish-kinds-next.yml
vendored
@@ -36,7 +36,7 @@ jobs:
|
||||
- name: "Setup Go"
|
||||
uses: "actions/setup-go@v4"
|
||||
with:
|
||||
go-version: '1.21.6'
|
||||
go-version: '1.21.8'
|
||||
|
||||
- name: "Verify kinds"
|
||||
run: go run .github/workflows/scripts/kinds/verify-kinds.go
|
||||
|
||||
2
.github/workflows/publish-kinds-release.yml
vendored
2
.github/workflows/publish-kinds-release.yml
vendored
@@ -39,7 +39,7 @@ jobs:
|
||||
- name: "Setup Go"
|
||||
uses: "actions/setup-go@v4"
|
||||
with:
|
||||
go-version: '1.21.6'
|
||||
go-version: '1.21.8'
|
||||
|
||||
- name: "Verify kinds"
|
||||
run: go run .github/workflows/scripts/kinds/verify-kinds.go
|
||||
|
||||
2
.github/workflows/verify-kinds.yml
vendored
2
.github/workflows/verify-kinds.yml
vendored
@@ -18,7 +18,7 @@ jobs:
|
||||
- name: "Setup Go"
|
||||
uses: "actions/setup-go@v4"
|
||||
with:
|
||||
go-version: '1.21.6'
|
||||
go-version: '1.21.8'
|
||||
|
||||
- name: "Verify kinds"
|
||||
run: go run .github/workflows/scripts/kinds/verify-kinds.go
|
||||
|
||||
216
CHANGELOG.md
216
CHANGELOG.md
@@ -1,3 +1,219 @@
|
||||
<!-- 10.4.0 START -->
|
||||
|
||||
# 10.4.0 (2024-03-06)
|
||||
|
||||
### Features and enhancements
|
||||
|
||||
- **AuthToken:** Remove client token rotation feature toggle. [#82886](https://github.com/grafana/grafana/issues/82886), [@kalleep](https://github.com/kalleep)
|
||||
- **Plugins:** Enable feature toggle angularDeprecationUI by default. [#82880](https://github.com/grafana/grafana/issues/82880), [@xnyo](https://github.com/xnyo)
|
||||
- **Table Component:** Improve text-wrapping behavior of cells. [#82872](https://github.com/grafana/grafana/issues/82872), [@ahuarte47](https://github.com/ahuarte47)
|
||||
- **Alerting:** Dry-run legacy upgrade on startup. [#82835](https://github.com/grafana/grafana/issues/82835), [@JacobsonMT](https://github.com/JacobsonMT)
|
||||
- **Tempo:** Upgrade @grafana/lezer-traceql patch version to use trace metrics syntax. [#82532](https://github.com/grafana/grafana/issues/82532), [@joey-grafana](https://github.com/joey-grafana)
|
||||
- **Logs Panel:** Add CSV to download options. [#82480](https://github.com/grafana/grafana/issues/82480), [@gtk-grafana](https://github.com/gtk-grafana)
|
||||
- **Folders:** Switch order of the columns in folder table indexes so that org_id becomes first. [#82454](https://github.com/grafana/grafana/issues/82454), [@papagian](https://github.com/papagian)
|
||||
- **Logs panel:** Table UI - Guess string field types. [#82397](https://github.com/grafana/grafana/issues/82397), [@gtk-grafana](https://github.com/gtk-grafana)
|
||||
- **Alerting:** Send alerts to APIv2 when using the Alertmanager contact point. [#82373](https://github.com/grafana/grafana/issues/82373), [@grobinson-grafana](https://github.com/grobinson-grafana)
|
||||
- **Alerting:** Emit warning when creating or updating unusually large groups. [#82279](https://github.com/grafana/grafana/issues/82279), [@alexweav](https://github.com/alexweav)
|
||||
- **Keybindings:** Change 'h' to 'mod+h' to open help modal. [#82253](https://github.com/grafana/grafana/issues/82253), [@tskarhed](https://github.com/tskarhed)
|
||||
- **Chore:** Update arrow and prometheus dependencies. [#82215](https://github.com/grafana/grafana/issues/82215), [@ryantxu](https://github.com/ryantxu)
|
||||
- **Alerting:** Enable group-level rule evaluation jittering by default, remove feature toggle. [#82212](https://github.com/grafana/grafana/issues/82212), [@alexweav](https://github.com/alexweav)
|
||||
- **Loki Log Context:** Always show label filters with at least one parsed label. [#82211](https://github.com/grafana/grafana/issues/82211), [@svennergr](https://github.com/svennergr)
|
||||
- **Logs Panel:** Table UI - better default column spacing. [#82205](https://github.com/grafana/grafana/issues/82205), [@gtk-grafana](https://github.com/gtk-grafana)
|
||||
- **RBAC:** Migration to remove the scope from permissions where action is alert.instances:read. [#82202](https://github.com/grafana/grafana/issues/82202), [@IevaVasiljeva](https://github.com/IevaVasiljeva)
|
||||
- **JWT Authentication:** Add support for specifying groups in auth.jwt for teamsync. [#82175](https://github.com/grafana/grafana/issues/82175), [@Jguer](https://github.com/Jguer)
|
||||
- **Alerting:** GA alertingPreviewUpgrade and enable by default. [#82038](https://github.com/grafana/grafana/issues/82038), [@JacobsonMT](https://github.com/JacobsonMT)
|
||||
- **Elasticsearch:** Apply ad-hoc filters to annotation queries. [#82032](https://github.com/grafana/grafana/issues/82032), [@mikelv92](https://github.com/mikelv92)
|
||||
- **Alerting:** Show legacy provisioned alert rules warning. [#81902](https://github.com/grafana/grafana/issues/81902), [@gillesdemey](https://github.com/gillesdemey)
|
||||
- **Tempo:** Support TraceQL metrics queries. [#81886](https://github.com/grafana/grafana/issues/81886), [@adrapereira](https://github.com/adrapereira)
|
||||
- **Tempo:** Support backtick strings. [#81802](https://github.com/grafana/grafana/issues/81802), [@fabrizio-grafana](https://github.com/fabrizio-grafana)
|
||||
- **Dashboards:** Remove `advancedDataSourcePicker` feature toggle. [#81790](https://github.com/grafana/grafana/issues/81790), [@Sergej-Vlasov](https://github.com/Sergej-Vlasov)
|
||||
- **CloudWatch:** Remove references to pkg/infra/metrics. [#81744](https://github.com/grafana/grafana/issues/81744), [@iwysiu](https://github.com/iwysiu)
|
||||
- **Licensing:** Redact license when overriden by env variable. [#81726](https://github.com/grafana/grafana/issues/81726), [@leandro-deveikis](https://github.com/leandro-deveikis)
|
||||
- **Explore:** Disable cursor sync. [#81698](https://github.com/grafana/grafana/issues/81698), [@ifrost](https://github.com/ifrost)
|
||||
- **Tempo:** Add custom headers middleware for grpc client. [#81693](https://github.com/grafana/grafana/issues/81693), [@aocenas](https://github.com/aocenas)
|
||||
- **Chore:** Update test database initialization. [#81673](https://github.com/grafana/grafana/issues/81673), [@DanCech](https://github.com/DanCech)
|
||||
- **Elasticsearch:** Implement CheckHealth method in the backend. [#81671](https://github.com/grafana/grafana/issues/81671), [@mikelv92](https://github.com/mikelv92)
|
||||
- **Tooltips:** Hide dimension configuration when tooltip mode is hidden. [#81627](https://github.com/grafana/grafana/issues/81627), [@codeincarnate](https://github.com/codeincarnate)
|
||||
- **Alerting:** Show warning when cp does not exist and invalidate the form. [#81621](https://github.com/grafana/grafana/issues/81621), [@soniaAguilarPeiron](https://github.com/soniaAguilarPeiron)
|
||||
- **User:** Add uid colum to user table. [#81615](https://github.com/grafana/grafana/issues/81615), [@ryantxu](https://github.com/ryantxu)
|
||||
- **Cloudwatch:** Remove core imports from infra/log. [#81543](https://github.com/grafana/grafana/issues/81543), [@njvrzm](https://github.com/njvrzm)
|
||||
- **Alerting:** Add pagination and improved search for notification policies. [#81535](https://github.com/grafana/grafana/issues/81535), [@soniaAguilarPeiron](https://github.com/soniaAguilarPeiron)
|
||||
- **Alerting:** Move action buttons in the alert list view. [#81341](https://github.com/grafana/grafana/issues/81341), [@soniaAguilarPeiron](https://github.com/soniaAguilarPeiron)
|
||||
- **Grafana/ui:** Add deprecation notices to the legacy layout components. [#81328](https://github.com/grafana/grafana/issues/81328), [@Clarity-89](https://github.com/Clarity-89)
|
||||
- **Cloudwatch:** Deprecate cloudwatchNewRegionsHandler feature toggle and remove core imports from featuremgmt. [#81310](https://github.com/grafana/grafana/issues/81310), [@njvrzm](https://github.com/njvrzm)
|
||||
- **Candlestick:** Add tooltip options. [#81307](https://github.com/grafana/grafana/issues/81307), [@adela-almasan](https://github.com/adela-almasan)
|
||||
- **Folders:** Forbid performing operations on folders via dashboards HTTP API. [#81264](https://github.com/grafana/grafana/issues/81264), [@undef1nd](https://github.com/undef1nd)
|
||||
- **Feature Management:** Move awsDatasourcesNewFormStyling to Public Preview. [#81257](https://github.com/grafana/grafana/issues/81257), [@idastambuk](https://github.com/idastambuk)
|
||||
- **Alerting:** Update API to use folders' full paths. [#81214](https://github.com/grafana/grafana/issues/81214), [@yuri-tceretian](https://github.com/yuri-tceretian)
|
||||
- **Datasources:** Add concurrency number to the settings. [#81212](https://github.com/grafana/grafana/issues/81212), [@itsmylife](https://github.com/itsmylife)
|
||||
- **CloudWatch:** Remove dependencies on grafana/pkg/setting. [#81208](https://github.com/grafana/grafana/issues/81208), [@iwysiu](https://github.com/iwysiu)
|
||||
- **Logs:** Table UI - Allow users to resize field selection section. [#81201](https://github.com/grafana/grafana/issues/81201), [@gtk-grafana](https://github.com/gtk-grafana)
|
||||
- **Dashboards:** Remove emptyDashboardPage feature flag. [#81188](https://github.com/grafana/grafana/issues/81188), [@Sergej-Vlasov](https://github.com/Sergej-Vlasov)
|
||||
- **Cloudwatch:** Import httpClient from grafana-plugin-sdk-go instead of grafana/infra. [#81187](https://github.com/grafana/grafana/issues/81187), [@idastambuk](https://github.com/idastambuk)
|
||||
- **Logs:** Table UI - Enable feature flag by default (GA). [#81185](https://github.com/grafana/grafana/issues/81185), [@gtk-grafana](https://github.com/gtk-grafana)
|
||||
- **Tempo:** Improve tags UX. [#81166](https://github.com/grafana/grafana/issues/81166), [@joey-grafana](https://github.com/joey-grafana)
|
||||
- **Table:** Cell inspector auto-detecting JSON. [#81152](https://github.com/grafana/grafana/issues/81152), [@gtk-grafana](https://github.com/gtk-grafana)
|
||||
- **Grafana/ui:** Add Space component. [#81145](https://github.com/grafana/grafana/issues/81145), [@Clarity-89](https://github.com/Clarity-89)
|
||||
- **Grafana/ui:** Add deprecation notice to the Form component. [#81068](https://github.com/grafana/grafana/issues/81068), [@Clarity-89](https://github.com/Clarity-89)
|
||||
- **Alerting:** Swap order between Annotations and Labels step in the alert rule form. [#81060](https://github.com/grafana/grafana/issues/81060), [@soniaAguilarPeiron](https://github.com/soniaAguilarPeiron)
|
||||
- **Plugins:** Change managedPluginsInstall to public preview. [#81053](https://github.com/grafana/grafana/issues/81053), [@oshirohugo](https://github.com/oshirohugo)
|
||||
- **Tempo:** Add span, trace vars to trace to metrics interpolation. [#81046](https://github.com/grafana/grafana/issues/81046), [@joey-grafana](https://github.com/joey-grafana)
|
||||
- **Tempo:** Support multiple filter expressions for service graph queries. [#81037](https://github.com/grafana/grafana/issues/81037), [@domasx2](https://github.com/domasx2)
|
||||
- **Alerting:** Support for simplified notification settings in rule API. [#81011](https://github.com/grafana/grafana/issues/81011), [@yuri-tceretian](https://github.com/yuri-tceretian)
|
||||
- **Plugins:** Add fuzzy search to plugins catalogue. [#81001](https://github.com/grafana/grafana/issues/81001), [@Ukochka](https://github.com/Ukochka)
|
||||
- **CloudWatch:** Only override contextDialer when using PDC. [#80992](https://github.com/grafana/grafana/issues/80992), [@leandro-deveikis](https://github.com/leandro-deveikis)
|
||||
- **Alerting:** Add a feature flag to periodically save states. [#80987](https://github.com/grafana/grafana/issues/80987), [@JohnnyQQQQ](https://github.com/JohnnyQQQQ)
|
||||
- **RBAC:** Return the underlying error instead of internal server or bad request for managed permission endpoints. [#80974](https://github.com/grafana/grafana/issues/80974), [@IevaVasiljeva](https://github.com/IevaVasiljeva)
|
||||
- **Correlations:** Enable correlations feature toggle by default. [#80881](https://github.com/grafana/grafana/issues/80881), [@ifrost](https://github.com/ifrost)
|
||||
- **Transformations:** Focus search input on drawer open. [#80859](https://github.com/grafana/grafana/issues/80859), [@codeincarnate](https://github.com/codeincarnate)
|
||||
- **Packaging:** Use the GRAFANA_HOME variable in postinst script on Debian. [#80853](https://github.com/grafana/grafana/issues/80853), [@denisse-dev](https://github.com/denisse-dev)
|
||||
- **Visualizations:** Hue gradient mode now applies to the line color . [#80805](https://github.com/grafana/grafana/issues/80805), [@torkelo](https://github.com/torkelo)
|
||||
- **Drawer:** Resizable via draggable edge . [#80796](https://github.com/grafana/grafana/issues/80796), [@torkelo](https://github.com/torkelo)
|
||||
- **Alerting:** Add setting to distribute rule group evaluations over time. [#80766](https://github.com/grafana/grafana/issues/80766), [@alexweav](https://github.com/alexweav)
|
||||
- **Logs Panel:** Permalink (copy shortlink). [#80764](https://github.com/grafana/grafana/issues/80764), [@gtk-grafana](https://github.com/gtk-grafana)
|
||||
- **VizTooltips:** Copy to clipboard functionality. [#80761](https://github.com/grafana/grafana/issues/80761), [@adela-almasan](https://github.com/adela-almasan)
|
||||
- **AuthN:** Support reloading SSO config after the sso settings have changed. [#80734](https://github.com/grafana/grafana/issues/80734), [@mgyongyosi](https://github.com/mgyongyosi)
|
||||
- **Logs Panel:** Add total count to logs volume panel in explore. [#80730](https://github.com/grafana/grafana/issues/80730), [@gtk-grafana](https://github.com/gtk-grafana)
|
||||
- **Caching:** Remove useCachingService feature toggle. [#80695](https://github.com/grafana/grafana/issues/80695), [@mmandrus](https://github.com/mmandrus)
|
||||
- **Table:** Support showing data links inline. . [#80691](https://github.com/grafana/grafana/issues/80691), [@ryantxu](https://github.com/ryantxu)
|
||||
- **Storage:** Add support for sortBy selector. [#80680](https://github.com/grafana/grafana/issues/80680), [@DanCech](https://github.com/DanCech)
|
||||
- **Alerting:** Add metric counting rule groups per org. [#80669](https://github.com/grafana/grafana/issues/80669), [@alexweav](https://github.com/alexweav)
|
||||
- **RBAC:** Cover plugin routes. [#80578](https://github.com/grafana/grafana/issues/80578), [@gamab](https://github.com/gamab)
|
||||
- **Profiling:** Import godeltaprof/http/pprof. [#80509](https://github.com/grafana/grafana/issues/80509), [@korniltsev](https://github.com/korniltsev)
|
||||
- **Tempo:** Add warning message when scope missing in TraceQL. [#80472](https://github.com/grafana/grafana/issues/80472), [@joey-grafana](https://github.com/joey-grafana)
|
||||
- **Cloudwatch:** Move getNextRefIdChar util from app/core/utils to @grafana/data. [#80471](https://github.com/grafana/grafana/issues/80471), [@idastambuk](https://github.com/idastambuk)
|
||||
- **DataFrame:** Add optional unique id definition. [#80428](https://github.com/grafana/grafana/issues/80428), [@aocenas](https://github.com/aocenas)
|
||||
- **Canvas:** Add element snapping and alignment. [#80407](https://github.com/grafana/grafana/issues/80407), [@nmarrs](https://github.com/nmarrs)
|
||||
- **Logs:** Add show context to dashboard panel. [#80403](https://github.com/grafana/grafana/issues/80403), [@svennergr](https://github.com/svennergr)
|
||||
- **Canvas:** Support context menu in panel edit mode. [#80335](https://github.com/grafana/grafana/issues/80335), [@nmarrs](https://github.com/nmarrs)
|
||||
- **VizTooltip:** Add sizing options. [#80306](https://github.com/grafana/grafana/issues/80306), [@Develer](https://github.com/Develer)
|
||||
- **Plugins:** Parse defaultValues correctly for nested options. [#80302](https://github.com/grafana/grafana/issues/80302), [@oshirohugo](https://github.com/oshirohugo)
|
||||
- **Geomap:** Support geojson styling properties. [#80272](https://github.com/grafana/grafana/issues/80272), [@drew08t](https://github.com/drew08t)
|
||||
- **Runtime:** Add property for disabling caching. [#80245](https://github.com/grafana/grafana/issues/80245), [@aangelisc](https://github.com/aangelisc)
|
||||
- **Alerting:** Log scheduler maxAttempts, guard against invalid retry counts, log retry errors. [#80234](https://github.com/grafana/grafana/issues/80234), [@alexweav](https://github.com/alexweav)
|
||||
- **Alerting:** Improve integration with dashboards. [#80201](https://github.com/grafana/grafana/issues/80201), [@konrad147](https://github.com/konrad147)
|
||||
- **Transformations:** Use an explicit join seperator when converting from an array to string field. [#80169](https://github.com/grafana/grafana/issues/80169), [@ryantxu](https://github.com/ryantxu)
|
||||
- **Build:** Update plugin IDs list in build and release process. [#80160](https://github.com/grafana/grafana/issues/80160), [@fabrizio-grafana](https://github.com/fabrizio-grafana)
|
||||
- **NestedFolders:** Support Shared with me folder for showing items you've been granted access to. [#80141](https://github.com/grafana/grafana/issues/80141), [@joshhunt](https://github.com/joshhunt)
|
||||
- **Log Context:** Add highlighted words to log rows. [#80119](https://github.com/grafana/grafana/issues/80119), [@svennergr](https://github.com/svennergr)
|
||||
- **Tempo:** Add `}` when `{` is inserted automatically. [#80113](https://github.com/grafana/grafana/issues/80113), [@harrymaurya05](https://github.com/harrymaurya05)
|
||||
- **Time Range:** Copy-paste Time Range. [#80107](https://github.com/grafana/grafana/issues/80107), [@harisrozajac](https://github.com/harisrozajac)
|
||||
- **PanelContext:** Remove deprecated onSplitOpen. [#80087](https://github.com/grafana/grafana/issues/80087), [@harisrozajac](https://github.com/harisrozajac)
|
||||
- **Docs:** Add HAProxy rewrite information considering `serve_from_sub_path` setting. [#80062](https://github.com/grafana/grafana/issues/80062), [@simPod](https://github.com/simPod)
|
||||
- **Table:** Keep expanded rows persistent when data changes if it has unique ID. [#80031](https://github.com/grafana/grafana/issues/80031), [@aocenas](https://github.com/aocenas)
|
||||
- **SSO Config:** Add generic OAuth. [#79972](https://github.com/grafana/grafana/issues/79972), [@Clarity-89](https://github.com/Clarity-89)
|
||||
- **FeatureFlags:** Remove the unsupported/undocumented option to read flags from a file. [#79959](https://github.com/grafana/grafana/issues/79959), [@ryantxu](https://github.com/ryantxu)
|
||||
- **Transformations:** Add Group to Nested Tables Transformation. [#79952](https://github.com/grafana/grafana/issues/79952), [@codeincarnate](https://github.com/codeincarnate)
|
||||
- **Cloudwatch Metrics:** Adjust error handling. [#79911](https://github.com/grafana/grafana/issues/79911), [@idastambuk](https://github.com/idastambuk)
|
||||
- **Tempo:** Decouple Tempo from Grafana core. [#79888](https://github.com/grafana/grafana/issues/79888), [@fabrizio-grafana](https://github.com/fabrizio-grafana)
|
||||
- **Table Panel:** Filter column values with operators or expressions. [#79853](https://github.com/grafana/grafana/issues/79853), [@ahuarte47](https://github.com/ahuarte47)
|
||||
- **Chore:** Generate shorter UIDs. [#79843](https://github.com/grafana/grafana/issues/79843), [@ryantxu](https://github.com/ryantxu)
|
||||
- **Alerting:** MuteTiming service return errutil + GetTiming by name. [#79772](https://github.com/grafana/grafana/issues/79772), [@yuri-tceretian](https://github.com/yuri-tceretian)
|
||||
- **Azure Monitor:** Add select all subscription option for ARG queries. [#79582](https://github.com/grafana/grafana/issues/79582), [@alyssabull](https://github.com/alyssabull)
|
||||
- **Alerting:** Enable sending notifications to a specific topic on Telegram. [#79546](https://github.com/grafana/grafana/issues/79546), [@th0th](https://github.com/th0th)
|
||||
- **Logs Panel:** Table UI - Reordering table columns via drag-and-drop. [#79536](https://github.com/grafana/grafana/issues/79536), [@gtk-grafana](https://github.com/gtk-grafana)
|
||||
- **Cloudwatch:** Add AWS/EMRServerless and AWS/KafkaConnect Metrics . [#79532](https://github.com/grafana/grafana/issues/79532), [@DugeraProve](https://github.com/DugeraProve)
|
||||
- **Transformations:** Move transformation help to drawer component. [#79247](https://github.com/grafana/grafana/issues/79247), [@codeincarnate](https://github.com/codeincarnate)
|
||||
- **Stat:** Support no value in spark line. [#78986](https://github.com/grafana/grafana/issues/78986), [@FOWind](https://github.com/FOWind)
|
||||
- **NodeGraph:** Use layered layout instead of force based layout. [#78957](https://github.com/grafana/grafana/issues/78957), [@aocenas](https://github.com/aocenas)
|
||||
- **Alerting:** Create alertingQueryOptimization feature flag for alert query optimization. [#78932](https://github.com/grafana/grafana/issues/78932), [@JacobsonMT](https://github.com/JacobsonMT)
|
||||
- **Dashboard:** New EmbeddedDashboard runtime component . [#78916](https://github.com/grafana/grafana/issues/78916), [@torkelo](https://github.com/torkelo)
|
||||
- **Alerting:** Show warning when query optimized. [#78751](https://github.com/grafana/grafana/issues/78751), [@JacobsonMT](https://github.com/JacobsonMT)
|
||||
- **Alerting:** Add support for TTL for pushover for Mimir Alertmanager. [#78687](https://github.com/grafana/grafana/issues/78687), [@gillesdemey](https://github.com/gillesdemey)
|
||||
- **Grafana/ui:** Enable removing values in multiselect opened state. [#78662](https://github.com/grafana/grafana/issues/78662), [@FOWind](https://github.com/FOWind)
|
||||
- **SQL datasources:** Consistent interval handling. [#78517](https://github.com/grafana/grafana/issues/78517), [@gabor](https://github.com/gabor)
|
||||
- **Alerting:** During legacy migration reduce the number of created silences. [#78505](https://github.com/grafana/grafana/issues/78505), [@JacobsonMT](https://github.com/JacobsonMT)
|
||||
- **UI:** New share button and toolbar reorganize. [#77563](https://github.com/grafana/grafana/issues/77563), [@evictorero](https://github.com/evictorero)
|
||||
- **Alerting:** Update rule API to address folders by UID. [#74600](https://github.com/grafana/grafana/issues/74600), [@papagian](https://github.com/papagian)
|
||||
- **Reports:** Add uid column to the database. (Enterprise)
|
||||
- **Plugins:** Add metrics for cloud plugin install. (Enterprise)
|
||||
- **RBAC:** Make seeding resilient to failed plugin loading. (Enterprise)
|
||||
- **Plugins:** Support disabling caching at a plugin instance level. (Enterprise)
|
||||
|
||||
### Bug fixes
|
||||
|
||||
- **Auth:** Fix email verification bypass when using basic authentication. [#82914](https://github.com/grafana/grafana/issues/82914), [@volcanonoodle](https://github.com/volcanonoodle)
|
||||
- **LibraryPanels/RBAC:** Fix issue where folder scopes weren't being correctly inherited. [#82700](https://github.com/grafana/grafana/issues/82700), [@kaydelaney](https://github.com/kaydelaney)
|
||||
- **Table Panel:** Fix display of ad-hoc filter actions. [#82442](https://github.com/grafana/grafana/issues/82442), [@codeincarnate](https://github.com/codeincarnate)
|
||||
- **Loki:** Update `@grafana/lezer-logql` to `0.2.3` containing fix for ip label name. [#82378](https://github.com/grafana/grafana/issues/82378), [@ivanahuckova](https://github.com/ivanahuckova)
|
||||
- **Alerting:** Fix slack double pound and email summary. [#82333](https://github.com/grafana/grafana/issues/82333), [@gillesdemey](https://github.com/gillesdemey)
|
||||
- **Elasticsearch:** Fix resource calls for paths that include `:`. [#82327](https://github.com/grafana/grafana/issues/82327), [@ivanahuckova](https://github.com/ivanahuckova)
|
||||
- **Alerting:** Return provenance of notification templates. [#82274](https://github.com/grafana/grafana/issues/82274), [@julienduchesne](https://github.com/julienduchesne)
|
||||
- **LibraryPanels:** Fix issue with repeated library panels. [#82255](https://github.com/grafana/grafana/issues/82255), [@kaydelaney](https://github.com/kaydelaney)
|
||||
- **Loki:** Fix fetching of values for label if no previous equality operator. [#82251](https://github.com/grafana/grafana/issues/82251), [@ivanahuckova](https://github.com/ivanahuckova)
|
||||
- **Alerting:** Fix data races and improve testing. [#81994](https://github.com/grafana/grafana/issues/81994), [@diegommm](https://github.com/diegommm)
|
||||
- **chore:** Fix typo in GraphTresholdsStyleMode enum. [#81960](https://github.com/grafana/grafana/issues/81960), [@paulJonesCalian](https://github.com/paulJonesCalian)
|
||||
- **CloudWatch:** Fix code editor not resizing on mount when content height is > 200px. [#81911](https://github.com/grafana/grafana/issues/81911), [@kevinwcyu](https://github.com/kevinwcyu)
|
||||
- **FieldOptions:** Revert scalable unit option as we already support this via custom prefix/suffixes . [#81893](https://github.com/grafana/grafana/issues/81893), [@torkelo](https://github.com/torkelo)
|
||||
- **Browse Dashboards:** Imported dashboards now display immediately in the dashboard list. [#81819](https://github.com/grafana/grafana/issues/81819), [@ashharrison90](https://github.com/ashharrison90)
|
||||
- **Elasticsearch:** Set middlewares from Grafana's `httpClientProvider`. [#81814](https://github.com/grafana/grafana/issues/81814), [@svennergr](https://github.com/svennergr)
|
||||
- **Folders:** Fix failure to update folder in SQLite. [#81795](https://github.com/grafana/grafana/issues/81795), [@papagian](https://github.com/papagian)
|
||||
- **Plugins:** Never disable add new data source for core plugins. [#81774](https://github.com/grafana/grafana/issues/81774), [@oshirohugo](https://github.com/oshirohugo)
|
||||
- **Alerting:** Fixes for pending period. [#81718](https://github.com/grafana/grafana/issues/81718), [@gillesdemey](https://github.com/gillesdemey)
|
||||
- **Alerting:** Fix editing group of nested folder. [#81665](https://github.com/grafana/grafana/issues/81665), [@gillesdemey](https://github.com/gillesdemey)
|
||||
- **Plugins:** Don't auto prepend app sub url to plugin asset paths. [#81658](https://github.com/grafana/grafana/issues/81658), [@wbrowne](https://github.com/wbrowne)
|
||||
- **Alerting:** Fix inconsistent AM raw config when applied via sync vs API. [#81655](https://github.com/grafana/grafana/issues/81655), [@JacobsonMT](https://github.com/JacobsonMT)
|
||||
- **Alerting:** Fix support check for export with modifications. [#81602](https://github.com/grafana/grafana/issues/81602), [@gillesdemey](https://github.com/gillesdemey)
|
||||
- **Alerting:** Fix selecting empty contact point value for notification policy inheritance. [#81482](https://github.com/grafana/grafana/issues/81482), [@gillesdemey](https://github.com/gillesdemey)
|
||||
- **Alerting:** Fix child provisioned polices not being rendered as provisioned. [#81449](https://github.com/grafana/grafana/issues/81449), [@soniaAguilarPeiron](https://github.com/soniaAguilarPeiron)
|
||||
- **Tempo:** Fix durations in TraceQL. [#81418](https://github.com/grafana/grafana/issues/81418), [@fabrizio-grafana](https://github.com/fabrizio-grafana)
|
||||
- **Logs:** Fix toggleable filters to be applied for specified query. [#81368](https://github.com/grafana/grafana/issues/81368), [@ivanahuckova](https://github.com/ivanahuckova)
|
||||
- **Loki:** Fix label not being added to all subexpressions. [#81360](https://github.com/grafana/grafana/issues/81360), [@svennergr](https://github.com/svennergr)
|
||||
- **Loki/Elastic:** Assert queryfix value to always be string. [#81349](https://github.com/grafana/grafana/issues/81349), [@svennergr](https://github.com/svennergr)
|
||||
- **Tempo:** Add query ref in the query editor. [#81343](https://github.com/grafana/grafana/issues/81343), [@joey-grafana](https://github.com/joey-grafana)
|
||||
- **Transformations:** Use the display name of the original y field for the predicted field of the regression analysis transformation. [#81332](https://github.com/grafana/grafana/issues/81332), [@oscarkilhed](https://github.com/oscarkilhed)
|
||||
- **Field:** Fix perf regression in getUniqueFieldName(). [#81323](https://github.com/grafana/grafana/issues/81323), [@leeoniya](https://github.com/leeoniya)
|
||||
- **Alerting:** Fix scheduler to group folders by the unique key (orgID and UID). [#81303](https://github.com/grafana/grafana/issues/81303), [@yuri-tceretian](https://github.com/yuri-tceretian)
|
||||
- **Alerting:** Fix migration edge-case race condition for silences. [#81206](https://github.com/grafana/grafana/issues/81206), [@JacobsonMT](https://github.com/JacobsonMT)
|
||||
- **Explore:** Set default time range to now-1h. [#81135](https://github.com/grafana/grafana/issues/81135), [@ifrost](https://github.com/ifrost)
|
||||
- **Elasticsearch:** Fix URL creation and allowlist for `/_mapping` requests. [#80970](https://github.com/grafana/grafana/issues/80970), [@svennergr](https://github.com/svennergr)
|
||||
- **Postgres:** Handle single quotes in table names in the query editor. [#80951](https://github.com/grafana/grafana/issues/80951), [@gabor](https://github.com/gabor)
|
||||
- **Folders:** Fix creating/updating a folder whose title has leading and trailing spaces. [#80909](https://github.com/grafana/grafana/issues/80909), [@papagian](https://github.com/papagian)
|
||||
- **Loki:** Fix missing timerange in query builder values request. [#80829](https://github.com/grafana/grafana/issues/80829), [@svennergr](https://github.com/svennergr)
|
||||
- **Elasticsearch:** Fix showing of logs when `__source` is log message field. [#80804](https://github.com/grafana/grafana/issues/80804), [@ivanahuckova](https://github.com/ivanahuckova)
|
||||
- **Pyroscope:** Fix stale value for query in query editor. [#80753](https://github.com/grafana/grafana/issues/80753), [@joey-grafana](https://github.com/joey-grafana)
|
||||
- **Stat:** Fix data links that refer to fields. [#80693](https://github.com/grafana/grafana/issues/80693), [@ajwerner](https://github.com/ajwerner)
|
||||
- **RBAC:** Clean up data source permissions after data source deletion. [#80654](https://github.com/grafana/grafana/issues/80654), [@IevaVasiljeva](https://github.com/IevaVasiljeva)
|
||||
- **Alerting:** Fix MuteTiming Get API to return provenance status. [#80494](https://github.com/grafana/grafana/issues/80494), [@yuri-tceretian](https://github.com/yuri-tceretian)
|
||||
- **Tempo:** Fix regression caused by #79938. [#80465](https://github.com/grafana/grafana/issues/80465), [@fabrizio-grafana](https://github.com/fabrizio-grafana)
|
||||
- **Alerting:** Fix preview getting the correct queries from the form. [#80458](https://github.com/grafana/grafana/issues/80458), [@soniaAguilarPeiron](https://github.com/soniaAguilarPeiron)
|
||||
- **Alerting:** Fix firing alerts title when showing active in Insights panel. [#80414](https://github.com/grafana/grafana/issues/80414), [@soniaAguilarPeiron](https://github.com/soniaAguilarPeiron)
|
||||
- **Postgres:** Fix enabling the socks proxy. [#80361](https://github.com/grafana/grafana/issues/80361), [@gabor](https://github.com/gabor)
|
||||
- **Alerting:** Fix group filter. [#80358](https://github.com/grafana/grafana/issues/80358), [@soniaAguilarPeiron](https://github.com/soniaAguilarPeiron)
|
||||
- **Alerting:** Increase size of kvstore value type for MySQL to LONGTEXT. [#80331](https://github.com/grafana/grafana/issues/80331), [@JacobsonMT](https://github.com/JacobsonMT)
|
||||
- **Annotations:** Split cleanup into separate queries and deletes to avoid deadlocks on MySQL. [#80329](https://github.com/grafana/grafana/issues/80329), [@alexweav](https://github.com/alexweav)
|
||||
- **Loki:** Fix bug duplicating parsed labels across multiple log lines. [#80292](https://github.com/grafana/grafana/issues/80292), [@svennergr](https://github.com/svennergr)
|
||||
- **Alerting:** Fix NoData & Error alerts not resolving when rule is reset. [#80184](https://github.com/grafana/grafana/issues/80184), [@JacobsonMT](https://github.com/JacobsonMT)
|
||||
- **Loki:** Fix metric time splitting to split starting with the start time. [#80085](https://github.com/grafana/grafana/issues/80085), [@svennergr](https://github.com/svennergr)
|
||||
- **Rendering:** Fix streaming panels always reaching timeout. [#80022](https://github.com/grafana/grafana/issues/80022), [@AgnesToulet](https://github.com/AgnesToulet)
|
||||
- **Plugins:** Fix colon in CallResource URL returning an error when creating plugin resource request. [#79746](https://github.com/grafana/grafana/issues/79746), [@GiedriusS](https://github.com/GiedriusS)
|
||||
- **PDF:** Fix initialization when SMTP is disabled. (Enterprise)
|
||||
- **PDF:** Fix repeated panels placement issue. (Enterprise)
|
||||
- **Report CSV:** Fix timeout with streaming panels. (Enterprise)
|
||||
- **RBAC:** Avoid repopulating removed basic role permissions if the permission scope has changed. (Enterprise)
|
||||
|
||||
### Breaking changes
|
||||
|
||||
We're adding a between the response of the ID token HD parameter and the list of allowed domains. This feature can be disabled through the configuration toggle `validate_hd `. Anyone using the legacy Google OAuth configuration should disable this validation if the ID Token response doesn't have the HD parameter. Issue [#83726](https://github.com/grafana/grafana/issues/83726)
|
||||
|
||||
If you use an automated provisioning (eg, Terraform) for custom roles, and have provisioned a role that includes permission with action `alert.instances:read` and some scope, you will need to update the permission in your provisioning files by removing the scope. Issue [#82202](https://github.com/grafana/grafana/issues/82202)
|
||||
|
||||
**The following breaking change occurs only when feature flag `nestedFolders` is enabled.**
|
||||
If the folder title contains the symbol `/` (forward-slash) the notifications created from the rules that are placed in that folder will contain an escape sequence for that symbol in the label `grafana_folder`.
|
||||
For example, the folder title is `Grafana / Folder`. Currently the label `grafana_folder` will contain the title as it is. If PR is merged - the label value will be `Grafana \/ Folder`.
|
||||
This can break notifications if notification policies have matches that match that label and folder. Issue [#81214](https://github.com/grafana/grafana/issues/81214)
|
||||
|
||||
`PanelContext.onSplitOpen` is removed. In the context of Explore, plugins should use `field.getLinks` to get a list of data link models. Issue [#80087](https://github.com/grafana/grafana/issues/80087)
|
||||
|
||||
The unstable alert rule API has been changed and now expects a folder UID instead of the folder title as namespace path parameter.
|
||||
I addition to this, the responses that used to return the folder title now return `<folder parent UID>/<folder title>` to uniquely identify them.
|
||||
Any consumers of the specific API should be appropriately adapted. Issue [#74600](https://github.com/grafana/grafana/issues/74600)
|
||||
|
||||
### Plugin development fixes & changes
|
||||
|
||||
- **Grafana/UI:** Add new Splitter component . [#82357](https://github.com/grafana/grafana/issues/82357), [@torkelo](https://github.com/torkelo)
|
||||
|
||||
<!-- 10.4.0 END -->
|
||||
<!-- 10.3.3 START -->
|
||||
|
||||
# 10.3.3 (2024-02-02)
|
||||
|
||||
@@ -1,9 +1,9 @@
|
||||
# syntax=docker/dockerfile:1
|
||||
|
||||
ARG BASE_IMAGE=alpine:3.18.5
|
||||
ARG JS_IMAGE=node:20-alpine3.18
|
||||
ARG BASE_IMAGE=alpine:3.19.1
|
||||
ARG JS_IMAGE=node:20-alpine
|
||||
ARG JS_PLATFORM=linux/amd64
|
||||
ARG GO_IMAGE=golang:1.21.6-alpine3.18
|
||||
ARG GO_IMAGE=golang:1.21.8-alpine
|
||||
|
||||
ARG GO_SRC=go-builder
|
||||
ARG JS_SRC=js-builder
|
||||
@@ -20,6 +20,8 @@ COPY packages packages
|
||||
COPY plugins-bundled plugins-bundled
|
||||
COPY public public
|
||||
|
||||
RUN apk add --no-cache make build-base python3
|
||||
|
||||
RUN yarn install --immutable
|
||||
|
||||
COPY tsconfig.json .eslintrc .editorconfig .browserslistrc .prettierrc.js ./
|
||||
|
||||
2
Makefile
2
Makefile
@@ -256,7 +256,7 @@ build-docker-full-ubuntu: ## Build Docker image based on Ubuntu for development.
|
||||
--build-arg COMMIT_SHA=$$(git rev-parse HEAD) \
|
||||
--build-arg BUILD_BRANCH=$$(git rev-parse --abbrev-ref HEAD) \
|
||||
--build-arg BASE_IMAGE=ubuntu:22.04 \
|
||||
--build-arg GO_IMAGE=golang:1.21.6 \
|
||||
--build-arg GO_IMAGE=golang:1.21.8 \
|
||||
--tag grafana/grafana$(TAG_SUFFIX):dev-ubuntu \
|
||||
$(DOCKER_BUILD_ARGS)
|
||||
|
||||
|
||||
@@ -134,6 +134,9 @@ log_queries =
|
||||
# For "mysql", use either "true", "false", or "skip-verify".
|
||||
ssl_mode = disable
|
||||
|
||||
# For "postregs", use either "1" to enable or "0" to disable SNI
|
||||
ssl_sni =
|
||||
|
||||
# Database drivers may support different transaction isolation levels.
|
||||
# Currently, only "mysql" driver supports isolation levels.
|
||||
# If the value is empty - driver's default isolation level is applied.
|
||||
@@ -679,6 +682,7 @@ token_url = https://oauth2.googleapis.com/token
|
||||
api_url = https://openidconnect.googleapis.com/v1/userinfo
|
||||
signout_redirect_url =
|
||||
allowed_domains =
|
||||
validate_hd = false
|
||||
hosted_domain =
|
||||
allowed_groups =
|
||||
role_attribute_path =
|
||||
|
||||
@@ -124,6 +124,9 @@
|
||||
# For "mysql", use either "true", "false", or "skip-verify".
|
||||
;ssl_mode = disable
|
||||
|
||||
# For "postregs", use either "1" to enable or "0" to disable SNI
|
||||
;ssl_sni =
|
||||
|
||||
# Database drivers may support different transaction isolation levels.
|
||||
# Currently, only "mysql" driver supports isolation levels.
|
||||
# If the value is empty - driver's default isolation level is applied.
|
||||
@@ -643,6 +646,7 @@
|
||||
;api_url = https://openidconnect.googleapis.com/v1/userinfo
|
||||
;signout_redirect_url =
|
||||
;allowed_domains =
|
||||
;validate_hd =
|
||||
;hosted_domain =
|
||||
;allowed_groups =
|
||||
;role_attribute_path =
|
||||
|
||||
@@ -180,7 +180,7 @@ const getStyles = (theme: GrafanaTheme2) => ({
|
||||
});
|
||||
```
|
||||
|
||||
Use hook useStyles2(getStyles) to memoize the styles generation and try to avoid passing props to the the getStyles function and instead compose classes using emotion cx function.
|
||||
Use hook useStyles2(getStyles) to memoize the styles generation and try to avoid passing props to the getStyles function and instead compose classes using emotion cx function.
|
||||
|
||||
#### Use `ALL_CAPS` for constants.
|
||||
|
||||
|
||||
@@ -15,6 +15,7 @@ labels:
|
||||
- oss
|
||||
cascade:
|
||||
TEMPO_VERSION: latest
|
||||
PYROSCOPE_VERSION: latest
|
||||
title: Grafana open source documentation
|
||||
---
|
||||
|
||||
@@ -81,8 +82,8 @@ title: Grafana open source documentation
|
||||
<h4>Provisioning</h4>
|
||||
<p>Learn how to automate your Grafana configuration.</p>
|
||||
</a>
|
||||
<a href="{{< relref "whatsnew/whats-new-in-v10-3/" >}}" class="nav-cards__item nav-cards__item--guide">
|
||||
<h4>What's new in v10.3</h4>
|
||||
<a href="{{< relref "whatsnew/whats-new-in-v10-4/" >}}" class="nav-cards__item nav-cards__item--guide">
|
||||
<h4>What's new in v10.4</h4>
|
||||
<p>Explore the features and enhancements in the latest release.</p>
|
||||
</a>
|
||||
|
||||
|
||||
@@ -10,7 +10,7 @@ description: Data source management information for Grafana administrators
|
||||
labels:
|
||||
products:
|
||||
- enterprise
|
||||
- oss
|
||||
- cloud
|
||||
title: Data source management
|
||||
weight: 100
|
||||
---
|
||||
@@ -21,27 +21,15 @@ Grafana supports many different storage backends for your time series data (data
|
||||
Refer to [data sources]({{< relref "../../datasources" >}}) for more information about using data sources in Grafana.
|
||||
Only users with the organization admin role can add data sources.
|
||||
|
||||
## Add a data source
|
||||
|
||||
Before you can create your first dashboard, you need to add your data source.
|
||||
|
||||
{{% admonition type="note" %}}
|
||||
Only users with the organization admin role can add data sources.
|
||||
{{% /admonition %}}
|
||||
|
||||
**To add a data source:**
|
||||
|
||||
1. Click **Connections** in the left-side menu.
|
||||
1. Enter the name of a specific data source in the search dialog. You can filter by **Data source** to only see data sources.
|
||||
1. Click the data source you want to add.
|
||||
1. Configure the data source following instructions specific to that data source.
|
||||
|
||||
For links to data source-specific documentation, see [Data sources]({{< relref "../../datasources" >}}).
|
||||
|
||||
## Data source permissions
|
||||
|
||||
You can configure data source permissions to allow or deny certain users the ability to query, edit, or administrate a data source. Each data source’s configuration includes a Permissions tab where you can restrict data source permissions to specific users, service accounts, teams, or roles.
|
||||
Query permission allows users to query the data source. Edit permission allows users to query the data source, edit the data source’s configuration and delete the data source. Admin permission allows users to query and edit the data source, change permissions on the data source and enable or disable query caching for the data source.
|
||||
|
||||
- The `query` permission allows users to query the data source.
|
||||
- The `edit` permission allows users to query the data source, edit the data source’s configuration and delete the data source.
|
||||
- The `admin` permission allows users to query and edit the data source, change permissions on the data source and enable or disable query caching for the data source.
|
||||
|
||||
{{% admonition type="note" %}}
|
||||
Available in [Grafana Enterprise]({{< relref "../../introduction/grafana-enterprise/" >}}) and [Grafana Cloud](/docs/grafana-cloud).
|
||||
@@ -71,7 +59,7 @@ You can assign data source permissions to users, service accounts, teams, and ro
|
||||
1. Click **Connections** in the left-side menu.
|
||||
1. Under Your connections, click **Data sources**.
|
||||
1. Select the data source for which you want to edit permissions.
|
||||
1. On the Permissions tab, find the user, service account, team, or role permission you want to update.
|
||||
1. On the Permissions tab, find the **User**, **Service Account**, **Team**, or **Role** permission you want to update.
|
||||
1. Select a different option in the **Permission** dropdown.
|
||||
|
||||
<div class="clearfix"></div>
|
||||
@@ -81,7 +69,7 @@ You can assign data source permissions to users, service accounts, teams, and ro
|
||||
1. Click **Connections** in the left-side menu.
|
||||
1. Under Your connections, click **Data sources**.
|
||||
1. Select the data source from which you want to remove permissions.
|
||||
1. On the Permissions tab, find the user, service account, team, or role permission you want to remove.
|
||||
1. On the Permissions tab, find the **User**, **Service Account**, **Team**, or **Role** permission you want to remove.
|
||||
1. Click the **X** next to the permission.
|
||||
|
||||
<div class="clearfix"></div>
|
||||
@@ -178,22 +166,3 @@ This action impacts all cache-enabled data sources. If you are using Memcached,
|
||||
### Sending a request without cache
|
||||
|
||||
If a data source query request contains an `X-Cache-Skip` header, then Grafana skips the caching middleware, and does not search the cache for a response. This can be particularly useful when debugging data source queries using cURL.
|
||||
|
||||
## Add data source plugins
|
||||
|
||||
Grafana ships with several [built-in data sources]({{< relref "../../datasources#built-in-core-data-sources" >}}).
|
||||
You can add additional data sources as plugins, which you can install or create yourself.
|
||||
|
||||
### Find data source plugins in the plugin catalog
|
||||
|
||||
To view available data source plugins, go to the [plugin catalog](/grafana/plugins/?type=datasource) and select the "Data sources" filter.
|
||||
For details about the plugin catalog, refer to [Plugin management]({{< relref "../../administration/plugin-management/" >}}).
|
||||
|
||||
You can further filter the plugin catalog's results for data sources provided by the Grafana community, Grafana Labs, and partners.
|
||||
If you use [Grafana Enterprise]({{< relref "../../introduction/grafana-enterprise/" >}}), you can also filter by Enterprise-supported plugins.
|
||||
|
||||
For more documentation on a specific data source plugin's features, including its query language and editor, refer to its plugin catalog page.
|
||||
|
||||
### Create a data source plugin
|
||||
|
||||
To build your own data source plugin, refer to the ["Build a data source plugin"](/developers/plugin-tools/tutorials/build-a-data-source-plugin) tutorial and our documentation about [building a plugin](/developers/plugin-tools).
|
||||
@@ -14,57 +14,55 @@ weight: 100
|
||||
|
||||
# Team LBAC
|
||||
|
||||
{{% admonition type="note" %}}
|
||||
Creating Team LBAC rules is available for preview preview for logs with Loki in Grafana Cloud. Report any unexpected behavior to the Grafana Support team.
|
||||
{{% /admonition %}}
|
||||
Team Label Based Access Control (LBAC) simplifies and streamlines data source access management based on team memberships.
|
||||
|
||||
**Current Limitation:**
|
||||
{{< admonition type="note" >}}
|
||||
Creating Team LBAC rules is available for preview for logs with Loki in Grafana Cloud.
|
||||
Report any unexpected behavior to the Grafana Support team.
|
||||
{{< /admonition >}}
|
||||
|
||||
- Any user with `query` permissions for a Loki data source can query all logs if there are no Team LBAC rules configured for any of the users team.
|
||||
- An admin that is part of a team, would have it's Team LBAC rules applied to the request.
|
||||
You can configure user access based upon team memberships using LogQL.
|
||||
Team LBAC controls access to logs depending on the rules set for each team.
|
||||
|
||||
Grafana's new **Team LBAC** (Label Based Access Control) feature for Loki is a significant enhancement that simplifies and streamlines data source access management based on team memberships.
|
||||
This feature addresses two common challenges faced by Grafana users:
|
||||
|
||||
**Team LBAC** in the context of Loki, is a way to control access to logs based on labels present depending on the rules set for each team. Users wanting fine grained access to their logs in Loki, can now configure their users access based on their team memberships via **LogQL**.
|
||||
1. Having a high number of Grafana Cloud data sources.
|
||||
Team LBAC lets Grafana administrators reduce the total number of data sources per instance from hundreds, to one.
|
||||
1. Using the same dashboard across multiple teams.
|
||||
Team LBAC lets Grafana Teams use the same dashboard with different access control rules.
|
||||
|
||||
This feature addresses two common challenge faced by Grafana users:
|
||||
To set up Team LBAC for a Loki data source, refer to [Configure Team LBAC](https://grafana.com/docs/grafana/<GRAFANA_VERSION>/administration/data-source-management/teamlbac/configure-teamlbac-for-loki/).
|
||||
|
||||
1. High volume of Grafana Cloud datasource. Team LBAC lets Grafana Admins reduce the total volume of data sources per instance from hundreds, to one.
|
||||
1. Hard for teams to share dashboard. Team LBAC lets Grafana Teams share the same dashboard despite different access control rules.
|
||||
## Limitations
|
||||
|
||||
For setting up Team LBAC for a Loki data source, refer to [Configure Team LBAC]({{< relref "./configure-teamlbac-for-loki/" >}}).
|
||||
- If there are no Team LBAC rules for a user's team, that user can query all logs.
|
||||
- If an administrator is part of a team with Team LBAC rules, those rules are applied to the administrator requests.
|
||||
- Cloud Access Policies (CAP) LBAC rules override Team LBAC rules.
|
||||
Cloud Access Policies are the access controls from Grafana Cloud.
|
||||
If there are any CAP LBAC rules configured for the same data source, then only the CAP LBAC rules are applied.
|
||||
|
||||
#### Datasource Permissions
|
||||
You must remove any label selectors from your Cloud Access Policies to use Team LBAC.
|
||||
For more information about CAP label selectors, refer to [Use label-based access control (LBAC) with access policies](https://grafana.com/docs/grafana-cloud/account-management/authentication-and-permissions/access-policies/label-access-policies/).
|
||||
|
||||
Datasource permissions allow the users access to query the datasource. The permissions are set at the datasource level and are inherited by all the teams and users that are part of the datasource.
|
||||
## Data source permissions
|
||||
|
||||
We recommend to create a new loki datasource for Team LBAC rules with only teams having `query` permission. This will allow you to have a clear separation of datasources for Team LBAC and the datasources that are not using Team LBAC.
|
||||
Data source permissions allow the users access to query the data source.
|
||||
Administrators set the permissions at the data source level.
|
||||
All the teams and users that are part of the data source inherit those permissions.
|
||||
|
||||
## Recommended setup
|
||||
|
||||
It's recommended that you create a single Loki data source for using Team LBAC rules so you have a clear separation of data sources using Team LBAC and those that aren't.
|
||||
All teams should have with only teams having `query` permission.
|
||||
You should create another Loki data source configured without Team LBAC for full access to the logs.
|
||||
|
||||
## Team LBAC rules
|
||||
|
||||
Team LBAC rules are added to the http request to Loki data source. Setting up Team LBAC rules for any team will apply those rules to the teams.
|
||||
Users who want teams with a specific set of label selectors can add rules for each team.
|
||||
Grafana adds Team LBAC rules to the HTTP request via the Loki data source.
|
||||
|
||||
Configuring multiple rules for a team, each rule is evaluated separately. If a team has `X` number of rules configured for it, all rules will be applied to the request and the result will be the an "OR" operation of the `X` number of rules.
|
||||
If you configure multiple rules for a team, each rule is evaluated separately.
|
||||
Query results include lines that match any of the rules.
|
||||
|
||||
Only users with data source Admin permissions can edit LBAC rules at the data source permissions tab. Changing LBAC rules requires the same access level as editing data source permissions (admin permission for data source).
|
||||
Only users with data source `Admin` permissions can edit Team LBAC rules in the **Data source permissions** tab because changing LBAC rules requires the same access level as editing data source permissions.
|
||||
|
||||
For setting up Team LBAC Rules for the data source, refer to [Create Team LBAC rules]({{< relref "./create-teamlbac-rules/" >}}).
|
||||
|
||||
### FAQ
|
||||
|
||||
> #### "If a team does not have a rule, what happens?"
|
||||
|
||||
If a team does not have a rule; any users that are part of that team having query permissions for loki will have access to **all** logs.
|
||||
|
||||
> #### "Can I use CAPs (cloud access policies) together with TeamLBAC rules?"
|
||||
|
||||
No, CAP (cloud access policies) always have precedence. If there are any CAP LBAC configured for the same datasource and there are TeamLBAC rules configured, then only the CAP LBAC will be applied.
|
||||
|
||||
Cloud access policies are the access controls from Grafana Cloud, the CAP configured for loki should only to be used to gain read access to the logs.
|
||||
|
||||
> #### "If administrator forget to add rule for a team, what happens?"
|
||||
|
||||
The teams that does not have a rule applied to it, would be able to query all logs if `query` permissions are setup for their role within Grafana.
|
||||
|
||||
**Note:** A user who is part of a team within Grafana without a rule will be able to query all logs if there are role based queriying setup.
|
||||
To set up Team LBAC for a Loki data source, refer to [Configure Team LBAC](https://grafana.com/docs/grafana/<GRAFANA_VERSION>/administration/data-source-management/teamlbac/configure-teamlbac-for-loki/).
|
||||
|
||||
@@ -123,11 +123,15 @@ To do this, you need to make sure that your alert rule is in the right evaluatio
|
||||
|
||||
## Configure notifications
|
||||
|
||||
Add labels to your alert rules to set which notification policy should handle your firing alert instances.
|
||||
{{< admonition type="note" >}}
|
||||
To try out a simplified version of routing your alerts, enable the alertingSimplifiedRouting feature toggle and refer to the following section Configure notifications (simplified).
|
||||
{{< /admonition >}}
|
||||
|
||||
All alert rules and instances, irrespective of their labels, match the default notification policy. If there are no nested policies, or no nested policies match the labels in the alert rule or alert instance, then the default notification policy is the matching policy.
|
||||
1. Add labels to your alert rules to set which notification policy should handle your firing alert instances.
|
||||
|
||||
1. Add labels if you want to change the way your notifications are routed.
|
||||
All alert rules and instances, irrespective of their labels, match the default notification policy. If there are no nested policies, or no nested policies match the labels in the alert rule or alert instance, then the default notification policy is the matching policy.
|
||||
|
||||
Add labels if you want to change the way your notifications are routed.
|
||||
|
||||
Add custom labels by selecting existing key-value pairs from the drop down, or add new labels by entering the new key or value.
|
||||
|
||||
@@ -137,7 +141,56 @@ All alert rules and instances, irrespective of their labels, match the default n
|
||||
|
||||
Expand each notification policy below to view more details.
|
||||
|
||||
1. Click **See details** to view alert routing details and an email preview.
|
||||
1. Click See details to view alert routing details and an email preview.
|
||||
|
||||
1. Click **Save rule**.
|
||||
|
||||
## Configure notifications (simplified)
|
||||
|
||||
{{< admonition type="note" >}}
|
||||
To try this out, enable the alertingSimplifiedRouting feature toggle.
|
||||
|
||||
This feature is currently not available for Grafana Cloud.
|
||||
{{< /admonition >}}
|
||||
|
||||
In the **Labels** section, you can optionally choose whether to add labels to organize your alert rules, make searching easier, as well as set which notification policy should handle your firing alert instance.
|
||||
|
||||
In the **Configure notifications** section, you can choose to select a contact point directly from the alert rule form or choose to use notification policy routing as well as set up mute timings and groupings.
|
||||
|
||||
Complete the following steps to set up labels and notifications.
|
||||
|
||||
1. Add labels, if required.
|
||||
|
||||
Add custom labels by selecting existing key-value pairs from the drop down, or add new labels by entering the new key or value.
|
||||
|
||||
2. Configure who receives a notification when an alert rule fires by either choosing **Select contact point** or **Use notification policy**.
|
||||
|
||||
**Select contact point**
|
||||
|
||||
1. Choose this option to select an existing contact point.
|
||||
|
||||
All notifications for this alert rule are sent to this contact point automatically and notification policies are not used.
|
||||
|
||||
2. You can also optionally select a mute timing as well as groupings and timings to define when not to send notifications.
|
||||
|
||||
{{% admonition type="note" %}}
|
||||
An auto-generated notification policy is generated. Only admins can view these auto-generated policies from the **Notification policies** list view. Any changes have to be made in the alert rules form. {{% /admonition %}}
|
||||
|
||||
**Use notification policy**
|
||||
|
||||
3. Choose this option to use the notification policy tree to direct your notifications.
|
||||
|
||||
{{% admonition type="note" %}}
|
||||
All alert rules and instances, irrespective of their labels, match the default notification policy. If there are no nested policies, or no nested policies match the labels in the alert rule or alert instance, then the default notification policy is the matching policy.
|
||||
{{% /admonition %}}
|
||||
|
||||
4. Preview your alert instance routing set up.
|
||||
|
||||
Based on the labels added, alert instances are routed to the following notification policies displayed.
|
||||
|
||||
5. Expand each notification policy below to view more details.
|
||||
|
||||
6. Click **See details** to view alert routing details and an email preview.
|
||||
|
||||
## Add annotations
|
||||
|
||||
|
||||
@@ -69,6 +69,6 @@ To set up the Grafana OnCall integration using the Grafana Alerting application,
|
||||
[oncall-integration]: "/docs/grafana/ -> /docs/oncall/latest/integrations/grafana-alerting"
|
||||
[oncall-integration]: "/docs/grafana-cloud/ -> /docs/grafana-cloud/alerting-and-irm/oncall/integrations/grafana-alerting"
|
||||
|
||||
[escalation-chain]: "/docs/grafana/ -> /docs/oncall/latest/escalation-chains-and-routes"
|
||||
[escalation-chain]: "/docs/grafana-cloud/ -> /docs/grafana-cloud/alerting-and-irm/oncall/escalation-chains-and-routes"
|
||||
[escalation-chain]: "/docs/grafana/ -> /docs/oncall/latest/configure/escalation-chains-and-routes"
|
||||
[escalation-chain]: "/docs/grafana-cloud/ -> /docs/grafana-cloud/alerting-and-irm/oncall/configure/escalation-chains-and-routes"
|
||||
{{% /docs/reference %}}
|
||||
|
||||
@@ -0,0 +1,93 @@
|
||||
---
|
||||
canonical: https://grafana.com/docs/grafana/latest/alerting/configure-notifications/manage-contact-points/integrations/configure-slack/
|
||||
description: Configure the Slack integration to connect alerts generated by Grafana Alerting
|
||||
keywords:
|
||||
- grafana
|
||||
- alerting
|
||||
- slack
|
||||
- integration
|
||||
labels:
|
||||
products:
|
||||
- cloud
|
||||
- enterprise
|
||||
- oss
|
||||
menuTitle: Slack
|
||||
title: Configure Slack for Alerting
|
||||
weight: 300
|
||||
---
|
||||
|
||||
## Configure Slack for Alerting
|
||||
|
||||
Use the Grafana Alerting - Slack integration to send Slack notifications when your alerts are firing.
|
||||
|
||||
There are two ways of integrating Slack into Grafana Alerting.
|
||||
|
||||
1. Use a [Slack API token](https://api.slack.com/authentication/token-types)
|
||||
|
||||
Enable your app to access the Slack API. If, for example, you are interested in more granular control over permissions, or your project is expected to regularly scale, resulting in new channels being created, this is the best option.
|
||||
|
||||
1. Use a [Webhook URL](https://api.slack.com/messaging/webhooks)
|
||||
|
||||
Webhooks is the simpler way to post messages into Slack. Slack automatically creates a bot user with all the necessary permissions to post messages to one particular channel of your choice.
|
||||
|
||||
{{< admonition type="note" >}}
|
||||
Grafana Alerting only allows one Slack channel per contact point.
|
||||
{{< /admonition >}}
|
||||
|
||||
## Before you begin
|
||||
|
||||
### Slack API Token
|
||||
|
||||
If you are using a Slack API Token, complete the following steps.
|
||||
|
||||
1. Follow steps 1 and 2 of the [Slack API Quickstart](https://api.slack.com/start/quickstart).
|
||||
1. Add the [chat:write.public](https://api.slack.com/scopes/chat:write.public) scope to give your app the ability to post in all public channels without joining.
|
||||
1. In OAuth Tokens for Your Workspace, copy the Bot User OAuth Token.
|
||||
1. Open your Slack workplace.
|
||||
1. Right click the channel you want to receive notifications in.
|
||||
1. Click View channel details.
|
||||
1. Scroll down and copy the Channel ID.
|
||||
{{< admonition type="note" >}}
|
||||
While going through these steps, Slack may prompt you to Reinstall your app in order for the changes to take effect.
|
||||
{{< /admonition >}}
|
||||
|
||||
### Webhook URL
|
||||
|
||||
If you are using a Webhook URL, follow steps 1 and 5 in the [Slack API Quickstart](https://api.slack.com/start/quickstart).
|
||||
|
||||
{{< admonition type="note" >}}
|
||||
Make sure you copy the Slack app Webhook URL. You will need this when setting up your contact point integration in Grafana Alerting.
|
||||
{{< /admonition >}}
|
||||
|
||||
## Procedure
|
||||
|
||||
To create your Slack integration in Grafana Alerting, complete the following steps.
|
||||
|
||||
1. Navigate to Alerts&IRM -> Alerting -> Contact points.
|
||||
1. Click **+ Add contact point**.
|
||||
1. Enter a contact point name.
|
||||
1. From the Integration list, select Slack.
|
||||
1. If you are using a Slack API token:
|
||||
- In the **Recipient** field, copy in the channel ID.
|
||||
- In the **Token** field, copy in the Bot User OAuth Token that starts with “xoxb-”.
|
||||
1. If you are using a Webhook URL, in the **Webhook** field, copy in your Slack app Webhook URL.
|
||||
1. Click **Test** to check that your integration works.
|
||||
1. Click **Save contact point**.
|
||||
|
||||
## Next steps
|
||||
|
||||
To add the contact point and integration you created to your default notification policy, complete the following steps.
|
||||
|
||||
1. Navigate to **Alerts&IRM** -> **Alerting** -> **Notification policies**.
|
||||
1. In the **Default policy**, click the ellipsis icon (…) and then **Edit**,
|
||||
1. Change the default policy to the contact point you created.
|
||||
1. Click **Update default policy**.
|
||||
|
||||
**Note:**
|
||||
If you have more than one contact point, add a new notification policy rather than edit the default one, so you can route specific alerts to Slack. For more information, refer to [Notification policies][nested-policy].
|
||||
|
||||
{{% docs/reference %}}
|
||||
[nested-policy]: "/docs/grafana/ -> /docs/grafana/<GRAFANA_VERSION>/alerting/alerting-rules/create-notification-policy#add-new-nested-policy"
|
||||
|
||||
[nested-policy]: "/docs/grafana-cloud/ -> /docs/grafana-cloud/alerting-and-irm/alerting/configure-notifications/create-notification-policy#add-new-nested-policy"
|
||||
{{% /docs/reference %}}
|
||||
@@ -26,7 +26,11 @@ weight: 410
|
||||
|
||||
Silences stop notifications from getting created and last for only a specified window of time.
|
||||
|
||||
**Note that inhibition rules are not supported in the Grafana Alertmanager.**
|
||||
{{< admonition type="note" >}}
|
||||
|
||||
- Inhibition rules are not supported in the Grafana Alertmanager.
|
||||
- The preview of silenced alerts only applies to alerts in firing state.
|
||||
{{< /admonition >}}
|
||||
|
||||
## Add silences
|
||||
|
||||
@@ -38,7 +42,7 @@ To add a silence, complete the following steps.
|
||||
1. Click **Create silence** to open the Create silence page.
|
||||
1. In **Silence start and end**, select the start and end date to indicate when the silence should go into effect and expire.
|
||||
1. Optionally, in **Duration**, specify how long the silence is enforced. This automatically updates the end time in the **Silence start and end** field.
|
||||
1. In the **Label** and **Value** fields, enter one or more _Matching Labels_. Matchers determine which rules the silence will apply to.
|
||||
1. In the **Label** and **Value** fields, enter one or more _Matching Labels_. Matchers determine which rules the silence will apply to. Any matching alerts (in firing state) will show in the **Affected alert instances** field
|
||||
1. In **Comment**, add details about the silence.
|
||||
1. Click **Submit**.
|
||||
|
||||
|
||||
@@ -72,17 +72,17 @@ Alerts generated by the new alerting system are visible in the **Alerting** sect
|
||||
1. **Preview the Upgrade**:
|
||||
- **Initiate the process**: Access the upgrade functionality within Grafana by visiting the **Alerting upgrade** page in the **Alerting (legacy)** section of the navigation panel. From this page you can upgrade your existing alert rules and notification channels to the new Grafana Alerting system.
|
||||
- **Review the summary table:** Review the detailed table outlining how your existing alert rules and notification channels were upgraded to resources in the new Grafana Alerting system.
|
||||
2. **Investigate and Resolve Errors**:
|
||||
1. **Investigate and Resolve Errors**:
|
||||
- **Identify errors**: Carefully examine the previewed upgrade:
|
||||
- Any alert rules or notification channels that couldn't be automatically upgraded will be highlighted with error indicators.
|
||||
- New or removed alert rules and notification channels will be highlighted with warning indicators.
|
||||
- **Address errors**: You have two options to resolve these issues:
|
||||
- **Fix legacy issues**: If possible, address the problems within your legacy alerting setup and attempt to upgrade the specific resource again.
|
||||
- **Create new resources**: If fixing legacy issues isn't viable, create new alert rules, notification policies, or contact points manually within the new Grafana Alerting system to replace the problematic ones.
|
||||
3. **Update As-Code Setup** (Optional):
|
||||
1. **Update As-Code Setup** (Optional):
|
||||
- **Export upgraded resources**: If you use provisioning methods to manage alert rules and notification channels, you can export the upgraded versions to generate provisioning files compatible with Grafana Alerting.
|
||||
- **Test new provisioning definitions**: Ensure your as-code setup aligns with the new system before completing the upgrade process. Both legacy and Grafana Alerting alerts can be provisioned simultaneously to facilitate a smooth transition.
|
||||
4. **Finalize the Upgrade**:
|
||||
1. **Finalize the Upgrade**:
|
||||
- **Contact your Grafana server administrator**: Once you're confident in the state of your previewed upgrade, request to [enable Grafana Alerting]({{< relref "#enable-grafana-alerting" >}}).
|
||||
- **Continued use for upgraded organizations**: Organizations that have already completed the preview upgrade will seamlessly continue using their configured setup.
|
||||
- **Automatic upgrade for others**: Organizations that haven't initiated the upgrade with preview process will undergo the traditional automatic upgrade during this restart.
|
||||
@@ -117,7 +117,7 @@ Any errors encountered during the upgrade process will fail the upgrade and prev
|
||||
1. **Upgrade to Grafana Alerting**:
|
||||
- **Enable Grafana Alerting**: [Modify custom configuration file]({{< relref "#enable-grafana-alerting" >}}).
|
||||
- **Restart Grafana**: Restart Grafana for the configuration changes to take effect. Grafana will automatically upgrade your existing alert rules and notification channels to the new Grafana Alerting system.
|
||||
2. **Review and Adjust Upgraded Alerts**:
|
||||
1. **Review and Adjust Upgraded Alerts**:
|
||||
- **Review the upgraded alerts**: Go to the `Alerting` section of the navigation panel to review the upgraded alerts.
|
||||
- **Export upgraded resources**: If you use provisioning methods to manage alert rules and notification channels, you can export the upgraded versions to generate provisioning files compatible with Grafana Alerting.
|
||||
|
||||
@@ -180,8 +180,8 @@ There are some differences between Grafana Alerting and legacy dashboard alerts,
|
||||
|
||||
1. `NoData` and `Error` settings are upgraded as is to the corresponding settings in Grafana Alerting, except in two situations:
|
||||
|
||||
- As there is no `Keep Last State` option in Grafana Alerting, this option becomes either [`NoData` or `Error`](/docs/sources/alerting/alerting-rules/create-grafana-managed-rule/#configure-no-data-and-error-handling). If using the `Simple Upgrade Method` Grafana automatically creates a 1 year silence for each alert rule with this configuration. If the alert evaluation returns no data or fails (error or timeout), then it creates a [special alert](/docs/sources/alerting/fundamentals/alert-rules/state-and-health/#special-alerts-for-nodata-and-error), which will be silenced by the silence created during the upgrade.
|
||||
- Due to lack of validation, legacy alert rules imported via JSON or provisioned along with dashboards can contain arbitrary values for [`NoData` or `Error`](/docs/sources/alerting/alerting-rules/create-grafana-managed-rule/#configure-no-data-and-error-handling). In this situation, Grafana will use the default setting: `NoData` for No data, and `Error` for Error.
|
||||
- As there is no `Keep Last State` option in Grafana Alerting, this option becomes either [`NoData` or `Error`][alerting_config_error_handling]. If using the `Simple Upgrade Method` Grafana automatically creates a 1 year silence for each alert rule with this configuration. If the alert evaluation returns no data or fails (error or timeout), then it creates a [special alert][special_alert], which will be silenced by the silence created during the upgrade.
|
||||
- Due to lack of validation, legacy alert rules imported via JSON or provisioned along with dashboards can contain arbitrary values for [`NoData` or `Error`][alerting_config_error_handling]. In this situation, Grafana will use the default setting: `NoData` for No data, and `Error` for Error.
|
||||
|
||||
1. Notification channels are upgraded to an Alertmanager configuration with the appropriate routes and receivers.
|
||||
|
||||
@@ -194,3 +194,11 @@ There are some differences between Grafana Alerting and legacy dashboard alerts,
|
||||
**Limitations**
|
||||
|
||||
1. Since `Hipchat` and `Sensu` notification channels are no longer supported, legacy alerts associated with these channels are not automatically upgraded to Grafana Alerting. Assign the legacy alerts to a supported notification channel so that you continue to receive notifications for those alerts.
|
||||
|
||||
{{% docs/reference %}}
|
||||
[alerting_config_error_handling]: "/docs/grafana/ -> /docs/grafana/<GRAFANA_VERSION>/alerting/alerting-rules/create-grafana-managed-rule#configure-no-data-and-error-handling"
|
||||
[alerting_config_error_handling]: "/docs/grafana-cloud/ -> /docs/grafana-cloud/alerting-and-irm/alerting/alerting-rules/create-grafana-managed-rule#configure-no-data-and-error-handling"
|
||||
|
||||
[special_alert]: "/docs/grafana/ -> /docs/grafana/<GRAFANA_VERSION>/alerting/fundamentals/alert-rules/state-and-health#special-alerts-for-nodata-and-error"
|
||||
[special_alert]: "/docs/grafana-cloud/ -> /docs/grafana-cloud/alerting-and-irm/alerting/fundamentals/alert-rules/state-and-health#special-alerts-for-nodata-and-error"
|
||||
{{% /docs/reference %}}
|
||||
|
||||
@@ -33,8 +33,10 @@ Choose from the options below to import (or provision) your Grafana Alerting res
|
||||
1. [Use configuration files to provision your alerting resources](/docs/grafana/<GRAFANA_VERSION>/alerting/set-up/provision-alerting-resources/file-provisioning), such as alert rules and contact points, through files on disk.
|
||||
|
||||
{{< admonition type="note" >}}
|
||||
File provisioning is not available in Grafana Cloud instances.
|
||||
{{< /admonition >}}
|
||||
|
||||
- You cannot edit provisioned resources from files in the Grafana UI.
|
||||
- Provisioning with configuration files is not available in Grafana Cloud.
|
||||
{{< /admonition >}}
|
||||
|
||||
1. Use [Terraform to provision alerting resources][alerting_tf_provisioning].
|
||||
|
||||
@@ -42,14 +44,15 @@ Choose from the options below to import (or provision) your Grafana Alerting res
|
||||
|
||||
{{< admonition type="note" >}}
|
||||
The JSON output from the majority of Alerting HTTP endpoints isn't compatible for provisioning via configuration files.
|
||||
Instead, use the [Export Alerting endpoints](/docs/grafana/<GRAFANA_VERSION>/alerting/set-up/provision-alerting-resources/export-alerting-resources#export-api-endpoints) to return or download the alerting resources in provisioning format.
|
||||
|
||||
If you need the alerting resources for file provisioning, use [Export Alerting endpoints](/docs/grafana/<GRAFANA_VERSION>/alerting/set-up/provision-alerting-resources/export-alerting-resources#export-api-endpoints) to return or download them in provisioning format.
|
||||
{{< /admonition >}}
|
||||
|
||||
## Export alerting resources
|
||||
|
||||
You can export both manually created and provisioned alerting resources. For more information, refer to [Export alerting resources][alerting_export].
|
||||
You can export both manually created and provisioned alerting resources. You can also edit and export an alert rule without applying the changes.
|
||||
|
||||
To modify imported alert rules, you can use the **Modify export** feature to edit and then export.
|
||||
For detailed instructions on the various export options, refer to [Export alerting resources][alerting_export].
|
||||
|
||||
## View provisioned alerting resources
|
||||
|
||||
@@ -61,10 +64,6 @@ To view your provisioned resources in Grafana, complete the following steps.
|
||||
|
||||
Provisioned resources are labeled **Provisioned**, so that it is clear that they were not created manually.
|
||||
|
||||
**Useful Links:**
|
||||
|
||||
[Grafana provisioning][provisioning]
|
||||
|
||||
{{% docs/reference %}}
|
||||
[alerting_tf_provisioning]: "/docs/grafana/ -> /docs/grafana/<GRAFANA_VERSION>/alerting/set-up/provision-alerting-resources/terraform-provisioning"
|
||||
[alerting_tf_provisioning]: "/docs/grafana-cloud/ -> /docs/grafana/<GRAFANA_VERSION>/alerting/set-up/provision-alerting-resources/terraform-provisioning"
|
||||
|
||||
@@ -22,9 +22,23 @@ weight: 300
|
||||
|
||||
Export your alerting resources, such as alert rules, contact points, and notification policies for provisioning, automatically importing single folders and single groups.
|
||||
|
||||
There are distinct methods to export your alerting resources:
|
||||
|
||||
- [Grafana UI](#export-from-the-grafana-ui) exports in Terraform format and YAML or JSON formats for file provisioning.
|
||||
- [HTTP Alerting API](#http-alerting-api) exports in JSON API format used by the HTTP Alerting API.
|
||||
- [HTTP Alerting API - Export endpoints](#export-api-endpoints) exports in YAML or JSON formats for file provisioning.
|
||||
|
||||
{{< admonition type="note" >}}
|
||||
Alerting resources imported through [file provisioning](/docs/grafana/<GRAFANA_VERSION>/alerting/set-up/provision-alerting-resources/file-provisioning) cannot be edited in the Grafana UI. This prevents changes made in the UI from being overridden by file provisioning during Grafana restarts.
|
||||
|
||||
If you need to modify provisioned alerting resources in Grafana, refer to [edit HTTP API alerting resources in the Grafana UI](/docs/grafana/<GRAFANA_VERSION>/alerting/set-up/provision-alerting-resources/http-api-provisioning#edit-resources-in-the-grafana-ui) or to [edit Terraform alerting resources in the Grafana UI](/docs/grafana/<GRAFANA_VERSION>/alerting/set-up/provision-alerting-resources/terraform-provisioning#enable-editing-resources-in-the-grafana-ui).
|
||||
{{< /admonition >}}
|
||||
|
||||
## Export from the Grafana UI
|
||||
|
||||
The export options listed below enable you to download resources in YAML, JSON, or Terraform format, facilitating their provisioning through [configuration files](/docs/grafana/<GRAFANA_VERSION>/alerting/set-up/provision-alerting-resources/file-provisioning) or [Terraform][alerting_tf_provisioning].
|
||||
|
||||
## Export alert rules
|
||||
### Export alert rules
|
||||
|
||||
To export alert rules from the Grafana UI, complete the following steps.
|
||||
|
||||
@@ -36,20 +50,16 @@ To export alert rules from the Grafana UI, complete the following steps.
|
||||
1. Find the group you want to export and click the **Export rule group** icon.
|
||||
1. Choose the format to export in.
|
||||
|
||||
The exported rule data appears in different formats - YAML, JSON, Terraform.
|
||||
The exported alert rule data appears in different formats - YAML, JSON, Terraform.
|
||||
|
||||
1. Click **Copy Code** or **Download**.
|
||||
|
||||
a. Choose **Copy Code** to go to an existing file and paste in the code.
|
||||
|
||||
b. Choose **Download** to download a file with the exported data.
|
||||
|
||||
## Modify and export alert rules without saving changes
|
||||
|
||||
Use the **Modify export** mode to edit and export an alert rule without updating it.
|
||||
### Modify alert rule and export rule group without saving changes
|
||||
|
||||
{{% admonition type="note" %}} This feature is for Grafana-managed alert rules only. It is available to Admin, Viewer, and Editor roles. {{% /admonition %}}
|
||||
|
||||
Use the **Modify export** mode to edit and export an alert rule without updating it. The exported data includes all alert rules within the same alert group.
|
||||
|
||||
To export a modified alert rule without saving the modifications, complete the following steps from the Grafana UI.
|
||||
|
||||
1. Click **Alerts & IRM** -> **Alert rules**.
|
||||
@@ -58,49 +68,145 @@ To export a modified alert rule without saving the modifications, complete the f
|
||||
1. Click **Export**.
|
||||
1. Choose the format to export in.
|
||||
|
||||
The exported rule data appears in different formats - YAML, JSON, Terraform.
|
||||
The exported alert rule group appears in different formats - YAML, JSON, Terraform.
|
||||
|
||||
1. Click **Copy Code** or **Download**.
|
||||
|
||||
a. Choose **Copy Code** to go to an existing file and paste in the code.
|
||||
### Export contact points
|
||||
|
||||
b. Choose **Download** to download a file with the exported data.
|
||||
To export contact points from the Grafana UI, complete the following steps.
|
||||
|
||||
## Export API endpoints
|
||||
1. Click **Alerts & IRM** -> **Contact points**.
|
||||
1. Find the contact point you want to export and click **More** -> **Export**.
|
||||
1. Choose the format to export in.
|
||||
|
||||
You can also use the **Alerting provisioning HTTP API** to export alerting resources in YAML or JSON formats for provisioning.
|
||||
The exported contact point appears in different formats - YAML, JSON, Terraform.
|
||||
|
||||
Note that most Alerting endpoints return a JSON format that is not compatible for provisioning via configuration files, except the ones listed below.
|
||||
1. Click **Copy Code** or **Download**.
|
||||
|
||||
| Method | URI | Summary |
|
||||
| ------ | ---------------------------------------------------------------- | ---------------------------------------------------------------------------------------- |
|
||||
| GET | /api/v1/provisioning/alert-rules/:uid/export | [Export an alert rule in provisioning file format.][export_rule] |
|
||||
| GET | /api/v1/provisioning/folder/:folderUid/rule-groups/:group/export | [Export an alert rule group in provisioning file format.][export_rule_group] |
|
||||
| GET | /api/v1/provisioning/alert-rules/export | [Export all alert rules in provisioning file format.][export_rules] |
|
||||
| GET | /api/v1/provisioning/contact-points/export | [Export all contact points in provisioning file format.][export_contacts] |
|
||||
| GET | /api/v1/provisioning/policies/export | [Export the notification policy tree in provisioning file format.][export_notifications] |
|
||||
### Export templates
|
||||
|
||||
Grafana currently doesn't offer an Export UI or [Export endpoint](#export-api-endpoints) for notification templates, unlike other Alerting resources presented in this documentation.
|
||||
|
||||
However, you can export it by manually copying the content template and title directly from the Grafana UI.
|
||||
|
||||
1. Click **Alerts & IRM** -> **Contact points** -> **Notification templates** tab.
|
||||
1. Find the template you want to export.
|
||||
1. Copy the content and title.
|
||||
1. Adjust it for the [file provisioning format][alerting_file_provisioning_template] or [Terraform resource][alerting_tf_provisioning_template].
|
||||
|
||||
### Export the notification policy tree
|
||||
|
||||
All notification policies are provisioned through a single resource: the root of the notification policy tree.
|
||||
|
||||
{{% admonition type="warning" %}}
|
||||
|
||||
Since the policy tree is a single resource, provisioning it will overwrite a policy tree created through any other means.
|
||||
|
||||
{{< /admonition >}}
|
||||
|
||||
To export the notification policy tree from the Grafana UI, complete the following steps.
|
||||
|
||||
1. Click **Alerts & IRM** -> **Notification policies**.
|
||||
1. In the **Default notification policy** section, click **...** -> **Export**.
|
||||
1. Choose the format to export in.
|
||||
|
||||
The exported contact point appears in different formats - YAML, JSON, Terraform.
|
||||
|
||||
1. Click **Copy Code** or **Download**.
|
||||
|
||||
### Export mute timings
|
||||
|
||||
To export mute timings from the Grafana UI, complete the following steps.
|
||||
|
||||
1. Click **Alerts & IRM** -> **Notification policies**, and then the **Mute timings** tab.
|
||||
1. Find the mute timing you want to export and click **Export**.
|
||||
1. Choose the format to export in.
|
||||
|
||||
The exported contact point appears in different formats - YAML, JSON, Terraform.
|
||||
|
||||
1. Click **Copy Code** or **Download**.
|
||||
|
||||
## HTTP Alerting API
|
||||
|
||||
You can use the [Alerting HTTP API][alerting_http_provisioning] to return existing alerting resources in JSON and import them to another Grafana instance using the same endpoint.
|
||||
|
||||
| Resource | URI |
|
||||
| -------------------------------------------------------------- | ----------------------------------- |
|
||||
| [Alert rules][alerting_http_alertrules] | /api/v1/provisioning/alert-rules |
|
||||
| [Contact points][alerting_http_contactpoints] | /api/v1/provisioning/contact-points |
|
||||
| [Notification policy tree][alerting_http_notificationpolicies] | /api/v1/provisioning/policies |
|
||||
| [Mute timings][alerting_http_mutetimings] | /api/v1/provisioning/mute-timings |
|
||||
| [Templates][alerting_http_templates] | /api/v1/provisioning/templates |
|
||||
|
||||
However, note the standard endpoints return a JSON format that is not compatible for provisioning through configuration files or Terraform, except the `/export` endpoints listed below.
|
||||
|
||||
### Export API endpoints
|
||||
|
||||
The **Alerting HTTP API** provides specific endpoints for exporting alerting resources in YAML or JSON formats, facilitating [provisioning via configuration files][alerting_file_provisioning]. Currently, Terraform format is not supported.
|
||||
|
||||
| Resource | Method / URI | Summary |
|
||||
| ------------------------ | -------------------------------------------------------------------- | ---------------------------------------------------------------------------------------- |
|
||||
| Alert rules | GET /api/v1/provisioning/alert-rules/export | [Export all alert rules in provisioning file format.][export_rules] |
|
||||
| Alert rules | GET /api/v1/provisioning/folder/:folderUid/rule-groups/:group/export | [Export an alert rule group in provisioning file format.][export_rule_group] |
|
||||
| Alert rules | GET /api/v1/provisioning/alert-rules/:uid/export | [Export an alert rule in provisioning file format.][export_rule] |
|
||||
| Contact points | GET /api/v1/provisioning/contact-points/export | [Export all contact points in provisioning file format.][export_contacts] |
|
||||
| Notification policy tree | GET /api/v1/provisioning/policies/export | [Export the notification policy tree in provisioning file format.][export_notifications] |
|
||||
| Mute timings | GET /api/v1/provisioning/mute-timings/export | [Export all mute timings in provisioning file format.][export_mute_timings] |
|
||||
| Mute timings | GET /api/v1/provisioning/mute-timings/:name/export | [Export a mute timing in provisioning file format.][export_mute_timing] |
|
||||
|
||||
These endpoints accept a `download` parameter to download a file containing the exported resources.
|
||||
|
||||
<!-- prettier-ignore-start -->
|
||||
|
||||
{{% docs/reference %}}
|
||||
|
||||
[alerting_http_alertrules]: "/docs/grafana/ -> /docs/grafana/<GRAFANA_VERSION>/alerting/set-up/provision-alerting-resources/http-api-provisioning#alert-rules"
|
||||
[alerting_http_alertrules]: "/docs/grafana-cloud/ -> /docs/grafana-cloud/alerting-and-irm/alerting/set-up/provision-alerting-resources/http-api-provisioning#alert-rules"
|
||||
|
||||
[alerting_http_contactpoints]: "/docs/grafana/ -> /docs/grafana/<GRAFANA_VERSION>/alerting/set-up/provision-alerting-resources/http-api-provisioning#contact-points"
|
||||
[alerting_http_contactpoints]: "/docs/grafana-cloud/ -> /docs/grafana-cloud/alerting-and-irm/alerting/set-up/provision-alerting-resources/http-api-provisioning#contact-points"
|
||||
|
||||
[alerting_http_notificationpolicies]: "/docs/grafana/ -> /docs/grafana/<GRAFANA_VERSION>/alerting/set-up/provision-alerting-resources/http-api-provisioning#notification-policies"
|
||||
[alerting_http_notificationpolicies]: "/docs/grafana-cloud/ -> /docs/grafana-cloud/alerting-and-irm/alerting/set-up/provision-alerting-resources/http-api-provisioning#notification-policies"
|
||||
|
||||
[alerting_http_mutetimings]: "/docs/grafana/ -> /docs/grafana/<GRAFANA_VERSION>/alerting/set-up/provision-alerting-resources/http-api-provisioning#mute-timings"
|
||||
[alerting_http_mutetimings]: "/docs/grafana-cloud/ -> /docs/grafana-cloud/alerting-and-irm/alerting/set-up/provision-alerting-resources/http-api-provisioning#mute-timings"
|
||||
|
||||
[alerting_http_templates]: "/docs/grafana/ -> /docs/grafana/<GRAFANA_VERSION>/alerting/set-up/provision-alerting-resources/http-api-provisioning#templates"
|
||||
[alerting_http_templates]: "/docs/grafana-cloud/ -> /docs/grafana-cloud/alerting-and-irm/alerting/set-up/provision-alerting-resources/http-api-provisioning#templates"
|
||||
|
||||
[alerting_tf_provisioning]: "/docs/grafana/ -> /docs/grafana/<GRAFANA_VERSION>/alerting/set-up/provision-alerting-resources/terraform-provisioning"
|
||||
[alerting_tf_provisioning]: "/docs/grafana-cloud/ -> /docs/grafana/<GRAFANA_VERSION>/alerting/set-up/provision-alerting-resources/terraform-provisioning"
|
||||
|
||||
[alerting_tf_provisioning_template]: "/docs/grafana/ -> /docs/grafana/<GRAFANA_VERSION>/alerting/set-up/provision-alerting-resources/terraform-provisioning#import-contact-points-and-templates"
|
||||
[alerting_tf_provisioning_template]: "/docs/grafana-cloud/ -> /docs/grafana-cloud/alerting-and-irm/alerting/set-up/provision-alerting-resources/terraform-provisioning#import-contact-points-and-templates"
|
||||
|
||||
[alerting_http_provisioning]: "/docs/grafana/ -> /docs/grafana/<GRAFANA_VERSION>/alerting/set-up/provision-alerting-resources/http-api-provisioning"
|
||||
[alerting_http_provisioning]: "/docs/grafana-cloud/ -> /docs/grafana/<GRAFANA_VERSION>/alerting/set-up/provision-alerting-resources/http-api-provisioning"
|
||||
|
||||
[export_rule]: "/docs/grafana/ -> /docs/grafana/<GRAFANA*VERSION>/alerting/set-up/provision-alerting-resources/http-api-provisioning/#span-idroute-get-alert-rule-exportspan-export-an-alert-rule-in-provisioning-file-format-\_routegetalertruleexport*"
|
||||
[export_rule]: "/docs/grafana-cloud/ -> /docs/grafana/<GRAFANA*VERSION>/alerting/set-up/provision-alerting-resources/http-api-provisioning/#span-idroute-get-alert-rule-exportspan-export-an-alert-rule-in-provisioning-file-format-\_routegetalertruleexport*"
|
||||
[alerting_file_provisioning_template]: "/docs/ -> /docs/grafana/<GRAFANA_VERSION>/alerting/set-up/provision-alerting-resources/file-provisioning#import-templates"
|
||||
|
||||
[export_rule_group]: "/docs/grafana/ -> /docs/grafana/<GRAFANA*VERSION>/alerting/set-up/provision-alerting-resources/http-api-provisioning/#span-idroute-get-alert-rule-group-exportspan-export-an-alert-rule-group-in-provisioning-file-format-\_routegetalertrulegroupexport*"
|
||||
[export_rule_group]: "/docs/grafana-cloud/ -> /docs/grafana/<GRAFANA*VERSION>/alerting/set-up/provision-alerting-resources/http-api-provisioning/#span-idroute-get-alert-rule-group-exportspan-export-an-alert-rule-group-in-provisioning-file-format-\_routegetalertrulegroupexport*"
|
||||
[export_rule]: "/docs/grafana/ -> /docs/grafana/<GRAFANA_VERSION>/alerting/set-up/provision-alerting-resources/http-api-provisioning/#span-idroute-get-alert-rule-exportspan-export-an-alert-rule-in-provisioning-file-format-_routegetalertruleexport_"
|
||||
[export_rule]: "/docs/grafana-cloud/ -> /docs/grafana/<GRAFANA_VERSION>/alerting/set-up/provision-alerting-resources/http-api-provisioning/#span-idroute-get-alert-rule-exportspan-export-an-alert-rule-in-provisioning-file-format-_routegetalertruleexport_"
|
||||
|
||||
[export_rules]: "/docs/grafana/ -> /docs/grafana/<GRAFANA*VERSION>/alerting/set-up/provision-alerting-resources/http-api-provisioning/#span-idroute-get-alert-rules-exportspan-export-all-alert-rules-in-provisioning-file-format-\_routegetalertrulesexport*"
|
||||
[export_rules]: "/docs/grafana-cloud/ -> /docs/grafana/<GRAFANA*VERSION>/alerting/set-up/provision-alerting-resources/http-api-provisioning/#span-idroute-get-alert-rules-exportspan-export-all-alert-rules-in-provisioning-file-format-\_routegetalertrulesexport*"
|
||||
[export_rule_group]: "/docs/grafana/ -> /docs/grafana/<GRAFANA_VERSION>/alerting/set-up/provision-alerting-resources/http-api-provisioning/#span-idroute-get-alert-rule-group-exportspan-export-an-alert-rule-group-in-provisioning-file-format-_routegetalertrulegroupexport_"
|
||||
[export_rule_group]: "/docs/grafana-cloud/ -> /docs/grafana/<GRAFANA_VERSION>/alerting/set-up/provision-alerting-resources/http-api-provisioning/#span-idroute-get-alert-rule-group-exportspan-export-an-alert-rule-group-in-provisioning-file-format-_routegetalertrulegroupexport_"
|
||||
|
||||
[export_contacts]: "/docs/grafana/ -> /docs/grafana/<GRAFANA*VERSION>/alerting/set-up/provision-alerting-resources/http-api-provisioning/#span-idroute-get-contactpoints-exportspan-export-all-contact-points-in-provisioning-file-format-\_routegetcontactpointsexport*"
|
||||
[export_contacts]: "/docs/grafana-cloud/ -> /docs/grafana/<GRAFANA*VERSION>/alerting/set-up/provision-alerting-resources/http-api-provisioning/#span-idroute-get-contactpoints-exportspan-export-all-contact-points-in-provisioning-file-format-\_routegetcontactpointsexport*"
|
||||
[export_rules]: "/docs/grafana/ -> /docs/grafana/<GRAFANA_VERSION>/alerting/set-up/provision-alerting-resources/http-api-provisioning/#span-idroute-get-alert-rules-exportspan-export-all-alert-rules-in-provisioning-file-format-_routegetalertrulesexport_"
|
||||
[export_rules]: "/docs/grafana-cloud/ -> /docs/grafana/<GRAFANA_VERSION>/alerting/set-up/provision-alerting-resources/http-api-provisioning/#span-idroute-get-alert-rules-exportspan-export-all-alert-rules-in-provisioning-file-format-_routegetalertrulesexport_"
|
||||
|
||||
[export_notifications]: "/docs/grafana/ -> /docs/grafana/<GRAFANA*VERSION>/alerting/set-up/provision-alerting-resources/http-api-provisioning/#span-idroute-get-policy-tree-exportspan-export-the-notification-policy-tree-in-provisioning-file-format-\_routegetpolicytreeexport*"
|
||||
[export_notifications]: "/docs/grafana-cloud/ -> /docs/grafana/<GRAFANA*VERSION>/alerting/set-up/provision-alerting-resources/http-api-provisioning/#span-idroute-get-policy-tree-exportspan-export-the-notification-policy-tree-in-provisioning-file-format-\_routegetpolicytreeexport*"
|
||||
[export_contacts]: "/docs/grafana/ -> /docs/grafana/<GRAFANA_VERSION>/alerting/set-up/provision-alerting-resources/http-api-provisioning/#span-idroute-get-contactpoints-exportspan-export-all-contact-points-in-provisioning-file-format-_routegetcontactpointsexport_"
|
||||
[export_contacts]: "/docs/grafana-cloud/ -> /docs/grafana/<GRAFANA_VERSION>/alerting/set-up/provision-alerting-resources/http-api-provisioning/#span-idroute-get-contactpoints-exportspan-export-all-contact-points-in-provisioning-file-format-_routegetcontactpointsexport_"
|
||||
|
||||
[export_mute_timing]: "/docs/grafana/ -> /docs/grafana/<GRAFANA_VERSION>/alerting/set-up/provision-alerting-resources/http-api-provisioning/#span-idroute-get-mute-timing-exportspan-export-a-mute-timing-in-provisioning-file-format-_routegetmutetimingexport_"
|
||||
[export_mute_timing]: "/docs/grafana-cloud/ -> /docs/grafana/<GRAFANA_VERSION>/alerting/set-up/provision-alerting-resources/http-api-provisioning/#span-idroute-get-mute-timing-exportspan-export-a-mute-timing-in-provisioning-file-format-_routegetmutetimingexport_"
|
||||
|
||||
[export_mute_timings]: "/docs/grafana/ -> /docs/grafana/<GRAFANA_VERSION>/alerting/set-up/provision-alerting-resources/http-api-provisioning/#span-idroute-get-mute-timings-exportspan-export-all-mute-timings-in-provisioning-file-format-_routegetmutetimingsexport_"
|
||||
[export_mute_timings]: "/docs/grafana-cloud/ -> /docs/grafana/<GRAFANA_VERSION>/alerting/set-up/provision-alerting-resources/http-api-provisioning/#span-idroute-get-mute-timings-exportspan-export-all-mute-timings-in-provisioning-file-format-_routegetmutetimingsexport_"
|
||||
|
||||
[export_notifications]: "/docs/grafana/ -> /docs/grafana/<GRAFANA_VERSION>/alerting/set-up/provision-alerting-resources/http-api-provisioning/#span-idroute-get-policy-tree-exportspan-export-the-notification-policy-tree-in-provisioning-file-format-_routegetpolicytreeexport_"
|
||||
[export_notifications]: "/docs/grafana-cloud/ -> /docs/grafana/<GRAFANA_VERSION>/alerting/set-up/provision-alerting-resources/http-api-provisioning/#span-idroute-get-policy-tree-exportspan-export-the-notification-policy-tree-in-provisioning-file-format-_routegetpolicytreeexport_"
|
||||
{{% /docs/reference %}}
|
||||
|
||||
<!-- prettier-ignore-end -->
|
||||
|
||||
@@ -20,34 +20,34 @@ weight: 100
|
||||
|
||||
# Use configuration files to provision alerting resources
|
||||
|
||||
Manage your alerting resources using files from disk. When you start Grafana, the data from these files is created in your Grafana system. Grafana adds any new resources you created, updates any that you changed, and deletes old ones.
|
||||
Manage your alerting resources using configuration files that can be version controlled. When Grafana starts, it provisions the resources defined in your configuration files. [Provisioning][provisioning] can create, update, or delete existing resources in your Grafana instance.
|
||||
|
||||
Arrange your files in a directory in a way that best suits your use case. For example, you can choose a team-based layout where every team has its own file, you can have one big file for all your teams; or you can have one file per resource type.
|
||||
|
||||
Details on how to set up the files and which fields are required for each object are listed below depending on which resource you are provisioning.
|
||||
|
||||
For a complete guide about how Grafana provisions resources, refer to the [Provision Grafana][provisioning] documentation.
|
||||
This guide outlines the steps and references to provision alerting resources using YAML files. For a practical demo, you can clone and try [this example using Grafana OSS and Docker Compose](https://github.com/grafana/provisioning-alerting-examples/tree/main/config-files).
|
||||
|
||||
{{< admonition type="note" >}}
|
||||
|
||||
- [Provisioning Grafana](/docs/grafana/<GRAFANA_VERSION>/administration/provisioning) with configuration files is not available in Grafana Cloud.
|
||||
|
||||
- You cannot edit provisioned resources from files in Grafana. You can only change the resource properties by changing the provisioning file and restarting Grafana or carrying out a hot reload. This prevents changes being made to the resource that would be overwritten if a file is provisioned again or a hot reload is carried out.
|
||||
|
||||
- Importing takes place during the initial set up of your Grafana system, but you can re-run it at any time using the [Grafana Admin API](/docs/grafana/<GRAFANA_VERSION>/developers/http_api/admin#reload-provisioning-configurations).
|
||||
- Provisioning using configuration files takes place during the initial set up of your Grafana system, but you can re-run it at any time using the [Grafana Admin API](/docs/grafana/<GRAFANA_VERSION>/developers/http_api/admin#reload-provisioning-configurations).
|
||||
|
||||
- Importing an existing alerting resource results in a conflict. First, when present, remove the resources you plan to import.
|
||||
{{< /admonition >}}
|
||||
|
||||
Details on how to set up the files and which fields are required for each object are listed below depending on which resource you are provisioning.
|
||||
|
||||
## Import alert rules
|
||||
|
||||
Create or delete alert rules in your Grafana instance(s).
|
||||
Create or delete alert rules using provisioning files in your Grafana instance(s).
|
||||
|
||||
1. Create alert rules in Grafana.
|
||||
1. [Export][alerting_export] and download a provisioning file for your alert rules.
|
||||
1. Copy the contents into a YAML or JSON configuration file in the `provisioning/alerting` directory.
|
||||
1. Find the alert rule group in Grafana.
|
||||
1. [Export][export_alert_rules] and download a provisioning file for your alert rules.
|
||||
1. Copy the contents into a YAML or JSON configuration file and add it to the `provisioning/alerting` directory of the Grafana instance you want to import the alerting resources to.
|
||||
|
||||
Example configuration files can be found below.
|
||||
|
||||
1. Add the file(s) to your GitOps workflow, so that they deploy alongside your Grafana instance(s).
|
||||
1. Restart your Grafana instance (or reload the provisioned files using the Admin API).
|
||||
|
||||
Here is an example of a configuration file for creating alert rules.
|
||||
|
||||
@@ -138,15 +138,15 @@ deleteRules:
|
||||
|
||||
## Import contact points
|
||||
|
||||
Create or delete contact points in your Grafana instance(s).
|
||||
Create or delete contact points using provisioning files in your Grafana instance(s).
|
||||
|
||||
1. Create a contact point in Grafana.
|
||||
1. [Export][alerting_export] and download a provisioning file for your contact point.
|
||||
1. Copy the contents into a YAML or JSON configuration file in the `provisioning/alerting` directory.
|
||||
1. Find the contact point in Grafana.
|
||||
1. [Export][export_contact_points] and download a provisioning file for your contact point.
|
||||
1. Copy the contents into a YAML or JSON configuration file and add it to the `provisioning/alerting` directory of the Grafana instance you want to import the alerting resources to.
|
||||
|
||||
Example configuration files can be found below.
|
||||
|
||||
1. Add the file(s) to your GitOps workflow, so that they deploy alongside your Grafana instance(s).
|
||||
1. Restart your Grafana instance (or reload the provisioned files using the Admin API).
|
||||
|
||||
Here is an example of a configuration file for creating contact points.
|
||||
|
||||
@@ -569,9 +569,54 @@ settings:
|
||||
|
||||
{{< /collapse >}}
|
||||
|
||||
## Import templates
|
||||
|
||||
Create or delete templates using provisioning files in your Grafana instance(s).
|
||||
|
||||
1. Find the notification template in Grafana.
|
||||
1. [Export][export_templates] a template by copying the template content and title.
|
||||
1. Copy the contents into a YAML or JSON configuration file and add it to the `provisioning/alerting` directory of the Grafana instance you want to import the alerting resources to.
|
||||
|
||||
Example configuration files can be found below.
|
||||
|
||||
1. Restart your Grafana instance (or reload the provisioned files using the Admin API).
|
||||
|
||||
Here is an example of a configuration file for creating templates.
|
||||
|
||||
```yaml
|
||||
# config file version
|
||||
apiVersion: 1
|
||||
|
||||
# List of templates to import or update
|
||||
templates:
|
||||
# <int> organization ID, default = 1
|
||||
- orgId: 1
|
||||
# <string, required> name of the template, must be unique
|
||||
name: my_first_template
|
||||
# <string, required> content of the the template
|
||||
template: |
|
||||
{{ define "my_first_template" }}
|
||||
Custom notification message
|
||||
{{ end }}
|
||||
```
|
||||
|
||||
Here is an example of a configuration file for deleting templates.
|
||||
|
||||
```yaml
|
||||
# config file version
|
||||
apiVersion: 1
|
||||
|
||||
# List of alert rule UIDs that should be deleted
|
||||
deleteTemplates:
|
||||
# <int> organization ID, default = 1
|
||||
- orgId: 1
|
||||
# <string, required> name of the template, must be unique
|
||||
name: my_first_template
|
||||
```
|
||||
|
||||
## Import notification policies
|
||||
|
||||
Create or reset the notification policy tree in your Grafana instance(s).
|
||||
Create or reset the notification policy tree using provisioning files in your Grafana instance(s).
|
||||
|
||||
In Grafana, the entire notification policy tree is considered a single, large resource. Add new specific policies as sub-policies under the root policy. Since specific policies may depend on each other, you cannot provision subsets of the policy tree; the entire tree must be defined in a single place.
|
||||
|
||||
@@ -581,13 +626,13 @@ Since the policy tree is a single resource, provisioning it will overwrite a pol
|
||||
|
||||
{{< /admonition >}}
|
||||
|
||||
1. Create a notification policy in Grafana.
|
||||
1. [Export][alerting_export] and download a provisioning file for your notification policy.
|
||||
1. Copy the contents into a YAML or JSON configuration file in the `provisioning/alerting` directory.
|
||||
1. Find the notification policy tree in Grafana.
|
||||
1. [Export][export_policies] and download a provisioning file for your notification policy tree.
|
||||
1. Copy the contents into a YAML or JSON configuration file and add it to the `provisioning/alerting` directory of the Grafana instance you want to import the alerting resources to.
|
||||
|
||||
Example configuration files can be found below.
|
||||
|
||||
1. Add the file(s) to your GitOps workflow, so that they deploy alongside your Grafana instance(s).
|
||||
1. Restart your Grafana instance (or reload the provisioned files using the Admin API).
|
||||
|
||||
Here is an example of a configuration file for creating notification policies.
|
||||
|
||||
@@ -685,7 +730,7 @@ templates:
|
||||
- orgId: 1
|
||||
# <string, required> name of the template, must be unique
|
||||
name: my_first_template
|
||||
# <string, required> content of the the template
|
||||
# <string, required> content of the template
|
||||
template: Alerting with a custom text template
|
||||
```
|
||||
|
||||
@@ -705,13 +750,15 @@ deleteTemplates:
|
||||
|
||||
## Import mute timings
|
||||
|
||||
Create or delete mute timings in your Grafana instance(s).
|
||||
Create or delete mute timings via provisioning files using provisioning files in your Grafana instance(s).
|
||||
|
||||
1. Create a YAML or JSON configuration file.
|
||||
1. Find the mute timing in Grafana.
|
||||
1. [Export][export_mute_timings] and download a provisioning file for your mute timing.
|
||||
1. Copy the contents into a YAML or JSON configuration file and add it to the `provisioning/alerting` directory of the Grafana instance you want to import the alerting resources to.
|
||||
|
||||
Example configuration files can be found below.
|
||||
|
||||
1. Add the file(s) to your GitOps workflow, so that they deploy alongside your Grafana instance(s).
|
||||
1. Restart your Grafana instance (or reload the provisioned files using the Admin API).
|
||||
|
||||
Here is an example of a configuration file for creating mute timings.
|
||||
|
||||
@@ -752,68 +799,33 @@ deleteMuteTimes:
|
||||
name: mti_1
|
||||
```
|
||||
|
||||
## File provisioning using Kubernetes
|
||||
## More examples
|
||||
|
||||
If you are a Kubernetes user, you can leverage file provisioning using Kubernetes configuration maps.
|
||||
For more examples on the concept of this guide:
|
||||
|
||||
1. Create one or more configuration maps as follows.
|
||||
|
||||
```yaml
|
||||
apiVersion: v1
|
||||
kind: ConfigMap
|
||||
metadata:
|
||||
name: grafana-alerting
|
||||
data:
|
||||
provisioning.yaml: |
|
||||
templates:
|
||||
- name: my_first_template
|
||||
template: the content for my template
|
||||
```
|
||||
|
||||
1. Add the file(s) to your GitOps workflow, so that they deploy alongside your Grafana instance(s).
|
||||
|
||||
```yaml
|
||||
apiVersion: apps/v1
|
||||
kind: Deployment
|
||||
metadata:
|
||||
name: grafana
|
||||
spec:
|
||||
replicas: 1
|
||||
selector:
|
||||
matchLabels:
|
||||
app: grafana
|
||||
template:
|
||||
metadata:
|
||||
name: grafana
|
||||
labels:
|
||||
app: grafana
|
||||
spec:
|
||||
containers:
|
||||
- name: grafana
|
||||
image: grafana/grafana:latest
|
||||
ports:
|
||||
- name: grafana
|
||||
containerPort: 3000
|
||||
volumeMounts:
|
||||
- mountPath: /etc/grafana/provisioning/alerting
|
||||
name: grafana-alerting
|
||||
readOnly: false
|
||||
volumes:
|
||||
- name: grafana-alerting
|
||||
configMap:
|
||||
defaultMode: 420
|
||||
name: grafana-alerting
|
||||
```
|
||||
|
||||
This eliminates the need for a persistent database to use Grafana Alerting in Kubernetes; all your provisioned resources appear after each restart or re-deployment. Grafana still requires a database for normal operation, you do not need to persist the contents of the database between restarts if all objects are provisioned using files.
|
||||
|
||||
**Useful Links:**
|
||||
|
||||
[Grafana provisioning][provisioning]
|
||||
- Try provisioning alerting resources in Grafana OSS with YAML files through a demo project using [Docker Compose](https://github.com/grafana/provisioning-alerting-examples/tree/main/config-files) or [Kubernetes deployments](https://github.com/grafana/provisioning-alerting-examples/tree/main/kubernetes).
|
||||
- Review the distinct options about how Grafana provisions resources in the [Provision Grafana documentation][provisioning].
|
||||
- For Helm support, review the examples provisioning alerting resources in the [Grafana Helm Chart documentation](https://github.com/grafana/helm-charts/blob/main/charts/grafana/README.md).
|
||||
|
||||
{{% docs/reference %}}
|
||||
[alerting_export]: "/docs/grafana/ -> /docs/grafana/<GRAFANA_VERSION>/alerting/set-up/provision-alerting-resources/export-alerting-resources"
|
||||
[alerting_export]: "/docs/grafana-cloud/ -> /docs/grafana/<GRAFANA_VERSION>/alerting/set-up/provision-alerting-resources/export-alerting-resources"
|
||||
[provisioning]: "/docs/grafana/ -> /docs/grafana/<GRAFANA_VERSION>/administration/provisioning"
|
||||
[provisioning]: "/docs/grafana-cloud/ -> /docs/grafana/<GRAFANA_VERSION>/administration/provisioning"
|
||||
|
||||
[export_alert_rules]: "/docs/grafana/ -> /docs/grafana/<GRAFANA_VERSION>/alerting/set-up/provision-alerting-resources/export-alerting-resources#export-alert-rules"
|
||||
[export_alert_rules]: "/docs/grafana-cloud/ -> /docs/grafana-cloud/alerting-and-irm/alerting/set-up/provision-alerting-resources/export-alerting-resources#export-alert-rules"
|
||||
|
||||
[export_contact_points]: "/docs/grafana/ -> /docs/grafana/<GRAFANA_VERSION>/alerting/set-up/provision-alerting-resources/export-alerting-resources#export-contact-points"
|
||||
[export_contact_points]: "/docs/grafana-cloud/ -> /docs/grafana-cloud/alerting-and-irm/alerting/set-up/provision-alerting-resources/export-alerting-resources#export-contact-points"
|
||||
|
||||
[export_templates]: "/docs/grafana/ -> /docs/grafana/<GRAFANA_VERSION>/alerting/set-up/provision-alerting-resources/export-alerting-resources#export-templates"
|
||||
[export_templates]: "/docs/grafana-cloud/ -> /docs/grafana-cloud/alerting-and-irm/alerting/set-up/provision-alerting-resources/export-alerting-resources#export-templates"
|
||||
|
||||
[export_policies]: "/docs/grafana/ -> /docs/grafana/<GRAFANA_VERSION>/alerting/set-up/provision-alerting-resources/export-alerting-resources#export-the-notification-policy-tree"
|
||||
[export_policies]: "/docs/grafana-cloud/ -> /docs/grafana-cloud/alerting-and-irm/alerting/set-up/provision-alerting-resources/export-alerting-resources#export-the-notification-policy-tree"
|
||||
|
||||
[export_mute_timings]: "/docs/grafana/ -> /docs/grafana/<GRAFANA_VERSION>/alerting/set-up/provision-alerting-resources/export-alerting-resources#export-mute-timings"
|
||||
[export_mute_timings]: "/docs/grafana-cloud/ -> /docs/grafana-cloud/alerting-and-irm/alerting/set-up/provision-alerting-resources/export-alerting-resources#export-mute-timings"
|
||||
|
||||
[provisioning]: "/docs/ -> /docs/grafana/<GRAFANA_VERSION>/administration/provisioning"
|
||||
|
||||
[reload-provisioning-configurations]: "/docs/ -> /docs/grafana/<GRAFANA_VERSION>/developers/http_api/admin#reload-provisioning-configurations"
|
||||
|
||||
{{% /docs/reference %}}
|
||||
|
||||
@@ -23,267 +23,103 @@ weight: 200
|
||||
|
||||
Use Terraform’s Grafana Provider to manage your alerting resources and provision them into your Grafana system. Terraform provider support for Grafana Alerting makes it easy to create, manage, and maintain your entire Grafana Alerting stack as code.
|
||||
|
||||
Refer to [Grafana Provider](https://registry.terraform.io/providers/grafana/grafana/latest/docs) documentation for more examples and information on Terraform Alerting schemas.
|
||||
This guide outlines the steps and references to provision alerting resources with Terraform. For a practical demo, you can clone and try this [example using Grafana OSS and Docker Compose](https://github.com/grafana/provisioning-alerting-examples/tree/main/terraform).
|
||||
|
||||
Complete the following tasks to create and manage your alerting resources using Terraform.
|
||||
|
||||
1. Create an API key for provisioning.
|
||||
1. Configure the Terraform provider.
|
||||
1. Define your alerting resources in Terraform. [Export alerting resources][alerting_export] in Terraform format, or implement the [Terraform Alerting schemas](https://registry.terraform.io/providers/grafana/grafana/latest/docs).
|
||||
To create and manage your alerting resources using Terraform, you have to complete the following tasks.
|
||||
|
||||
1. Create an API key to configure the Terraform provider.
|
||||
1. Create your alerting resources in Terraform format by
|
||||
- [exporting configured alerting resources][alerting_export]
|
||||
- or writing the [Terraform Alerting schemas](https://registry.terraform.io/providers/grafana/grafana/latest/docs).
|
||||
> By default, you cannot edit provisioned resources. Enable [`disable_provenance` in the Terraform resource](#enable-editing-resources-in-the-grafana-ui) to allow changes in the Grafana UI.
|
||||
1. Run `terraform apply` to provision your alerting resources.
|
||||
|
||||
{{< admonition type="note" >}}
|
||||
Before you begin, you should have available a Grafana instance and [Terraform installed](https://www.terraform.io/downloads) on your machine.
|
||||
|
||||
- By default, you cannot edit resources provisioned from Terraform from the UI. This ensures that your alerting stack always stays in sync with your code. To change the default behaviour, refer to [Edit provisioned resources in the Grafana UI](#edit-provisioned-resources-in-the-grafana-ui).
|
||||
## Create an API key and configure the Terraform provider
|
||||
|
||||
- Before you begin, ensure you have the [Grafana Terraform Provider](https://registry.terraform.io/providers/grafana/grafana/) 1.27.0 or higher, and are using Grafana 9.1 or higher.
|
||||
|
||||
{{< /admonition >}}
|
||||
|
||||
## Create an API key for provisioning
|
||||
|
||||
You can create a [service account token][service-accounts] to authenticate Terraform with Grafana. Most existing tooling using API keys should automatically work with the new Grafana Alerting support.
|
||||
|
||||
There are also dedicated RBAC roles for alerting provisioning. This lets you easily authenticate as a service account with the minimum permissions needed to provision your Alerting infrastructure.
|
||||
|
||||
To create an API key for provisioning, complete the following steps.
|
||||
You can create a [service account token][service-accounts] to authenticate Terraform with Grafana. To create an API key for provisioning alerting resources, complete the following steps.
|
||||
|
||||
1. Create a new service account.
|
||||
1. Assign the role or permission to access the [Alerting provisioning API][alerting_http_provisioning].
|
||||
1. Create a new service account token.
|
||||
1. Name and save the token for use in Terraform.
|
||||
|
||||
Alternatively, you can use basic authentication. To view all the supported authentication formats, see [here](https://registry.terraform.io/providers/grafana/grafana/latest/docs#authentication).
|
||||
You can now move to the working directory for your Terraform configurations, and create a file named `main.tf` like:
|
||||
|
||||
## Configure the Terraform provider
|
||||
|
||||
Grafana Alerting support is included as part of the [Grafana Terraform provider](https://registry.terraform.io/providers/grafana/grafana/latest/docs).
|
||||
|
||||
The following is an example you can use to configure the Terraform provider.
|
||||
|
||||
```HCL
|
||||
```main.tf
|
||||
terraform {
|
||||
required_providers {
|
||||
grafana = {
|
||||
source = "grafana/grafana"
|
||||
version = ">= 1.28.2"
|
||||
version = ">= 2.9.0"
|
||||
}
|
||||
}
|
||||
}
|
||||
|
||||
provider "grafana" {
|
||||
url = <YOUR_GRAFANA_URL>
|
||||
auth = <YOUR_GRAFANA_API_KEY>
|
||||
url = <grafana-url>
|
||||
auth = <api-key>
|
||||
}
|
||||
```
|
||||
|
||||
## Import contact points and templates
|
||||
Replace the following values:
|
||||
|
||||
Contact points connect an alerting stack to the outside world. They tell Grafana how to connect to your external systems and where to deliver notifications.
|
||||
- `<grafana-url>` with the URL of the Grafana instance.
|
||||
- `<api-key>` with the API token previously created.
|
||||
|
||||
To provision contact points and templates, refer to the [grafana_contact_point schema](https://registry.terraform.io/providers/grafana/grafana/latest/docs/resources/contact_point) and [grafana_message_template schema](https://registry.terraform.io/providers/grafana/grafana/latest/docs/resources/message_template), and complete the following steps.
|
||||
This Terraform configuration installs the [Grafana Terraform provider](https://registry.terraform.io/providers/grafana/grafana/latest/docs) and authenticates against your Grafana instance using an API token. For other authentication alternatives including basic authentication, refer to the [`auth` option documentation](https://registry.terraform.io/providers/grafana/grafana/latest/docs#authentication).
|
||||
|
||||
1. Copy this code block into a `.tf` file on your local machine.
|
||||
For Grafana Cloud, refer to the [instructions to manage a Grafana Cloud stack with Terraform][provision-cloud-with-terraform]. For role-based access control, refer to [Provisioning RBAC with Terraform][rbac-terraform-provisioning] and the [alerting provisioning roles (`fixed:alerting.provisioning.*`)][rbac-role-definitions].
|
||||
|
||||
This example creates a contact point that sends alert notifications to Slack.
|
||||
## Create Terraform configurations for alerting resources
|
||||
|
||||
```HCL
|
||||
resource "grafana_contact_point" "my_slack_contact_point" {
|
||||
name = "Send to My Slack Channel"
|
||||
[Grafana Terraform provider](https://registry.terraform.io/providers/grafana/grafana/latest/docs) enables you to manage the following alerting resources.
|
||||
|
||||
slack {
|
||||
url = <YOUR_SLACK_WEBHOOK_URL>
|
||||
text = <<EOT
|
||||
{{ len .Alerts.Firing }} alerts are firing!
|
||||
| Alerting resource | Terraform resource |
|
||||
| ----------------------------------------------- | -------------------------------------------------------------------------------------------------------------------------------- |
|
||||
| [Alert rules][alerting-rules] | [grafana_rule_group](https://registry.terraform.io/providers/grafana/grafana/latest/docs/resources/rule_group) |
|
||||
| [Contact points][contact-points] | [grafana_contact_point](https://registry.terraform.io/providers/grafana/grafana/latest/docs/resources/contact_point) |
|
||||
| [Notification templates][notification-template] | [grafana_message_template](https://registry.terraform.io/providers/grafana/grafana/latest/docs/resources/message_template) |
|
||||
| [Notification policy tree][notification-policy] | [grafana_notification_policy](https://registry.terraform.io/providers/grafana/grafana/latest/docs/resources/notification_policy) |
|
||||
| [Mute timings][mute-timings] | [grafana_mute_timing](https://registry.terraform.io/providers/grafana/grafana/latest/docs/resources/mute_timing) |
|
||||
|
||||
Alert summaries:
|
||||
{{ range .Alerts.Firing }}
|
||||
{{ template "Alert Instance Template" . }}
|
||||
{{ end }}
|
||||
EOT
|
||||
}
|
||||
}
|
||||
```
|
||||
In this section, we'll create Terraform configurations for each alerting resource and demonstrate how to link them together.
|
||||
|
||||
You can create multiple external integrations in a single contact point. Notifications routed to this contact point will be sent to all integrations. This example shows multiple integrations in the same Terraform resource.
|
||||
### Add alert rules
|
||||
|
||||
```
|
||||
resource "grafana_contact_point" "my_multi_contact_point" {
|
||||
name = "Send to Many Places"
|
||||
[Alert rules][alerting-rules] enable you to receive alerts by querying any backend Grafana data sources.
|
||||
|
||||
slack {
|
||||
url = "webhook1"
|
||||
...
|
||||
}
|
||||
slack {
|
||||
url = "webhook2"
|
||||
...
|
||||
}
|
||||
teams {
|
||||
...
|
||||
}
|
||||
email {
|
||||
...
|
||||
}
|
||||
}
|
||||
```
|
||||
|
||||
1. Enter text for your notification in the text field.
|
||||
|
||||
The `text` field supports [Go-style templating](https://pkg.go.dev/text/template). This enables you to manage your Grafana Alerting notification templates directly in Terraform.
|
||||
|
||||
1. Run the command `terraform apply`.
|
||||
|
||||
1. Go to the Grafana UI and check the details of your contact point.
|
||||
|
||||
1. Click **Test** to verify that the contact point works correctly.
|
||||
|
||||
### Reuse templates
|
||||
|
||||
You can reuse the same templates across many contact points. In the example above, a shared template ie embedded using the statement `{{ template “Alert Instance Template” . }}`
|
||||
|
||||
This fragment can then be managed separately in Terraform:
|
||||
|
||||
```HCL
|
||||
resource "grafana_message_template" "my_alert_template" {
|
||||
name = "Alert Instance Template"
|
||||
|
||||
template = <<EOT
|
||||
{{ define "Alert Instance Template" }}
|
||||
Firing: {{ .Labels.alertname }}
|
||||
Silence: {{ .SilenceURL }}
|
||||
{{ end }}
|
||||
EOT
|
||||
}
|
||||
```
|
||||
|
||||
## Import notification policies and routing
|
||||
|
||||
Notification policies tell Grafana how to route alert instances to your contact points. They connect firing alerts to your previously defined contact points using a system of labels and matchers.
|
||||
|
||||
To provision notification policies and routing, refer to the [grafana_notification_policy schema](https://registry.terraform.io/providers/grafana/grafana/latest/docs/resources/notification_policy), and complete the following steps.
|
||||
|
||||
{{% admonition type="warning" %}}
|
||||
|
||||
Since the policy tree is a single resource, provisioning the `grafana_notification_policy` resource will overwrite a policy tree created through any other means.
|
||||
|
||||
{{< /admonition >}}
|
||||
|
||||
1. Copy this code block into a `.tf` file on your local machine.
|
||||
|
||||
In this example, the alerts are grouped by `alertname`, which means that any notifications coming from alerts which share the same name, are grouped into the same Slack message. You can provide any set of label keys here, or you can use the special label `"..."` to route by all label keys, sending each alert in a separate notification.
|
||||
|
||||
If you want to route specific notifications differently, you can add sub-policies. Sub-policies allow you to apply routing to different alerts based on label matching. In this example, we apply a mute timing to all alerts with the label a=b.
|
||||
|
||||
```HCL
|
||||
resource "grafana_notification_policy" "my_policy" {
|
||||
group_by = ["alertname"]
|
||||
contact_point = grafana_contact_point.my_slack_contact_point.name
|
||||
|
||||
group_wait = "45s"
|
||||
group_interval = "6m"
|
||||
repeat_interval = "3h"
|
||||
|
||||
policy {
|
||||
matcher {
|
||||
label = "a"
|
||||
match = "="
|
||||
value = "b"
|
||||
}
|
||||
group_by = ["..."]
|
||||
contact_point = grafana_contact_point.a_different_contact_point.name
|
||||
mute_timings = [grafana_mute_timing.my_mute_timing.name]
|
||||
|
||||
policy {
|
||||
matcher {
|
||||
label = "sublabel"
|
||||
match = "="
|
||||
value = "subvalue"
|
||||
}
|
||||
contact_point = grafana_contact_point.a_third_contact_point.name
|
||||
group_by = ["..."]
|
||||
}
|
||||
}
|
||||
}
|
||||
```
|
||||
|
||||
1. In the mute_timings field, link a mute timing to your notification policy.
|
||||
|
||||
1. Run the command `terraform apply`.
|
||||
|
||||
1. Go to the Grafana UI and check the details of your notification policy.
|
||||
|
||||
1. Click **Test** to verify that the notification point is working correctly.
|
||||
|
||||
## Import mute timings
|
||||
|
||||
Mute timings provide the ability to mute alert notifications for defined time periods.
|
||||
|
||||
To provision mute timings, refer to the [grafana_mute_timing schema](https://registry.terraform.io/providers/grafana/grafana/latest/docs/resources/mute_timing), and complete the following steps.
|
||||
|
||||
1. Copy this code block into a `.tf` file on your local machine.
|
||||
|
||||
In this example, alert notifications are muted on weekends.
|
||||
|
||||
```HCL
|
||||
resource "grafana_mute_timing" "my_mute_timing" {
|
||||
name = "My Mute Timing"
|
||||
|
||||
intervals {
|
||||
times {
|
||||
start = "04:56"
|
||||
end = "14:17"
|
||||
}
|
||||
weekdays = ["saturday", "sunday", "tuesday:thursday"]
|
||||
months = ["january:march", "12"]
|
||||
years = ["2025:2027"]
|
||||
}
|
||||
}
|
||||
```
|
||||
|
||||
1. Run the command `terraform apply`.
|
||||
1. Go to the Grafana UI and check the details of your mute timing.
|
||||
1. Reference your newly created mute timing in a notification policy using the `mute_timings` field.
|
||||
This will apply your mute timing to some or all of your notifications.
|
||||
|
||||
1. Click **Test** to verify that the mute timing is working correctly.
|
||||
|
||||
## Import alert rules
|
||||
|
||||
[Alert rules][alerting-rules] enable you to alert against any Grafana data source. This can be a data source that you already have configured, or you can [define your data sources in Terraform](https://registry.terraform.io/providers/grafana/grafana/latest/docs/resources/data_source) alongside your alert rules.
|
||||
|
||||
To provision alert rules, refer to the [grafana_rule_group schema](https://registry.terraform.io/providers/grafana/grafana/latest/docs/resources/rule_group), and complete the following steps.
|
||||
|
||||
1. Create a data source to query and a folder to store your rules in.
|
||||
1. First, create a data source to query and a folder to store your rules in.
|
||||
|
||||
In this example, the [TestData][testdata] data source is used.
|
||||
|
||||
Alerts can be defined against any backend datasource in Grafana.
|
||||
|
||||
```HCL
|
||||
resource "grafana_data_source" "testdata_datasource" {
|
||||
```terraform
|
||||
resource "grafana_data_source" "<terraform_data_source_name>" {
|
||||
name = "TestData"
|
||||
type = "testdata"
|
||||
}
|
||||
|
||||
resource "grafana_folder" "rule_folder" {
|
||||
resource "grafana_folder" "<terraform_folder_name>" {
|
||||
title = "My Rule Folder"
|
||||
}
|
||||
```
|
||||
|
||||
1. Define an alert rule.
|
||||
Replace the following field values:
|
||||
|
||||
For more information on alert rules, refer to [how to create Grafana-managed alerts](/blog/2022/08/01/grafana-alerting-video-how-to-create-alerts-in-grafana-9/).
|
||||
- `<terraform_data_source_name>` with the terraform name of the data source.
|
||||
- `<terraform_folder_name>` with the terraform name of the folder.
|
||||
|
||||
1. Create a rule group containing one or more rules.
|
||||
1. Create or find an alert rule you want to import in Grafana.
|
||||
|
||||
In this example, the `grafana_rule_group` resource group is used.
|
||||
1. [Export][alerting_export] the alert rule group in Terraform format. This exports the alert rule group as [`grafana_rule_group` Terraform resource](https://registry.terraform.io/providers/grafana/grafana/latest/docs/resources/rule_group).
|
||||
|
||||
```HCL
|
||||
resource "grafana_rule_group" "my_rule_group" {
|
||||
You can edit the exported resource, or alternatively, consider creating the resource from scratch.
|
||||
|
||||
```terraform
|
||||
resource "grafana_rule_group" "<terraform_rule_group_name>" {
|
||||
name = "My Alert Rules"
|
||||
folder_uid = grafana_folder.rule_folder.uid
|
||||
folder_uid = grafana_folder.<terraform_folder_name>.uid
|
||||
interval_seconds = 60
|
||||
org_id = 1
|
||||
|
||||
@@ -299,7 +135,7 @@ To provision alert rules, refer to the [grafana_rule_group schema](https://regis
|
||||
from = 600
|
||||
to = 0
|
||||
}
|
||||
datasource_uid = grafana_data_source.testdata_datasource.uid
|
||||
datasource_uid = grafana_data_source.<terraform_data_source_name>.uid
|
||||
// `model` is a JSON blob that sends datasource-specific data.
|
||||
// It's different for every datasource. The alert's query is defined here.
|
||||
model = jsonencode({
|
||||
@@ -343,40 +179,232 @@ To provision alert rules, refer to the [grafana_rule_group schema](https://regis
|
||||
}
|
||||
```
|
||||
|
||||
1. Run the command `terraform apply`.
|
||||
1. Go to the Grafana UI and check your alert rule.
|
||||
Replace the following field values:
|
||||
|
||||
You can see whether or not the alert rule is firing. You can also see a visualization of each of the alert rule’s query stages
|
||||
- `<terraform_rule_group_name>` with the name of the alert rule group.
|
||||
|
||||
When the alert fires, Grafana routes a notification through the policy you defined.
|
||||
Note that the distinct Grafana resources are connected through `uid` values in their Terraform configurations. The `uid` value will be randomly generated when provisioning.
|
||||
|
||||
For example, if you chose Slack as a contact point, Grafana’s embedded [Alertmanager](https://github.com/prometheus/alertmanager) automatically posts a message to Slack.
|
||||
To link the alert rule group with its respective data source and folder in this example, replace the following field values:
|
||||
|
||||
## Edit provisioned resources in the Grafana UI
|
||||
- `<terraform_data_source_name>` with the terraform name of the previously defined data source.
|
||||
- `<terraform_folder_name>` with the terraform name of the the previously defined folder.
|
||||
|
||||
By default, you cannot edit resources provisioned via Terraform in Grafana. To enable editing these resources in the Grafana UI, use the `disable_provenance` attribute on alerting resources:
|
||||
1. Continue to add more Grafana resources or [use the Terraform CLI for provisioning](#provision-grafana-resources-with-terraform).
|
||||
|
||||
```HCL
|
||||
provider "grafana" {
|
||||
url = "http://grafana.example.com/"
|
||||
auth = var.grafana_auth
|
||||
}
|
||||
### Add contact points
|
||||
|
||||
[Contact points][contact-points] are the receivers of alert notifications.
|
||||
|
||||
1. Create or find the contact points you want to import in Grafana. Alternatively, consider writing the resource in code as demonstrated in the example below.
|
||||
|
||||
1. [Export][alerting_export] the contact point in Terraform format. This exports the contact point as [`grafana_contact_point` Terraform resource](https://registry.terraform.io/providers/grafana/grafana/latest/docs/resources/contact_point)—edit it if necessary.
|
||||
|
||||
1. In this example, notifications are muted on weekends.
|
||||
|
||||
```terraform
|
||||
resource "grafana_contact_point" "<terraform_contact_point_name>" {
|
||||
name = "My contact point email"
|
||||
|
||||
email {
|
||||
addresses = ["<email_address>"]
|
||||
}
|
||||
}
|
||||
```
|
||||
|
||||
Replace the following field values:
|
||||
|
||||
- `<terraform_contact_point_name>` with the terraform name of the contact point. It will be used to reference the contact point in other Terraform resources.
|
||||
- `<email_address>` with the email to receive alert notifications.
|
||||
|
||||
1. Continue to add more Grafana resources or [use the Terraform CLI for provisioning](#provision-grafana-resources-with-terraform).
|
||||
|
||||
### Add and enable templates
|
||||
|
||||
[Notification templates][notification-template] allow customization of alert notifications across multiple contact points.
|
||||
|
||||
1. Create or find the notification template you want to import in Grafana. Alternatively, consider writing the resource in code as demonstrated in the example below.
|
||||
|
||||
1. [Export][alerting_export] the template as [`grafana_message_template` Terraform resource](https://registry.terraform.io/providers/grafana/grafana/latest/docs/resources/message_template).
|
||||
|
||||
This example is a simple demo template defined as `custom_email.message`.
|
||||
|
||||
```terraform
|
||||
resource "grafana_message_template" "<terraform_message_template_name>" {
|
||||
name = "custom_email.message"
|
||||
|
||||
template = <<EOT
|
||||
{{ define "custom_email.message" }}
|
||||
Lorem ipsum - Custom alert!
|
||||
{{ end }}
|
||||
EOT
|
||||
}
|
||||
```
|
||||
|
||||
1. In the previous contact point, enable the template by setting the `email.message` property as follows.
|
||||
|
||||
```terraform
|
||||
resource "grafana_contact_point" "<terraform_contact_point_name>" {
|
||||
name = "My contact point email"
|
||||
|
||||
email {
|
||||
addresses = ["<email_address>"]
|
||||
message = "{{ template \"custom_email.message\" .}}"
|
||||
}
|
||||
}
|
||||
```
|
||||
|
||||
1. Continue to add more Grafana resources or [use the Terraform CLI for provisioning](#provision-grafana-resources-with-terraform).
|
||||
|
||||
### Add mute timings
|
||||
|
||||
[Mute timings][mute-timings] pause alert notifications during predetermined intervals.
|
||||
|
||||
1. Create or find the mute timings you want to import in Grafana. Alternatively, consider writing the resource in code as demonstrated in the example below.
|
||||
|
||||
1. [Export][alerting_export] the mute timing in Terraform format. This exports the mute timing as [`grafana_mute_timing` Terraform resource](https://registry.terraform.io/providers/grafana/grafana/latest/docs/resources/mute_timing)—edit it if necessary.
|
||||
|
||||
1. This example turns off notifications on weekends.
|
||||
|
||||
```terraform
|
||||
resource "grafana_mute_timing" "<terraform_mute_timing_name>" {
|
||||
name = "No weekends"
|
||||
|
||||
intervals {
|
||||
weekdays = ["saturday", "sunday"]
|
||||
}
|
||||
}
|
||||
```
|
||||
|
||||
Replace the following field values:
|
||||
|
||||
- `<terraform_mute_timing_name>` with the name of the Terraform resource. It will be used to reference the mute timing in the Terraform notification policy tree.
|
||||
|
||||
1. Continue to add more Grafana resources or [use the Terraform CLI for provisioning](#provision-grafana-resources-with-terraform).
|
||||
|
||||
### Add the notification policy tree
|
||||
|
||||
[Notification policies][notification-policy] defines how to route alert instances to your contact points.
|
||||
|
||||
{{% admonition type="warning" %}}
|
||||
|
||||
Since the policy tree is a single resource, provisioning the `grafana_notification_policy` resource will overwrite a policy tree created through any other means.
|
||||
|
||||
{{< /admonition >}}
|
||||
|
||||
1. Find the default notification policy tree. Alternatively, consider writing the resource in code as demonstrated in the example below.
|
||||
|
||||
1. [Export][alerting_export] the notification policy tree in Terraform format. This exports it as [`grafana_notification_policy` Terraform resource](https://registry.terraform.io/providers/grafana/grafana/latest/docs/resources/notification_policy)—edit it if necessary.
|
||||
|
||||
```terraform
|
||||
resource "grafana_notification_policy" "my_policy_tree" {
|
||||
contact_point = grafana_contact_point.<terraform_contact_point_name>.name
|
||||
...
|
||||
|
||||
policy {
|
||||
contact_point = grafana_contact_point.<terraform_contact_point_name>.name
|
||||
|
||||
matcher {...}
|
||||
|
||||
mute_timings = [grafana_mute_timing.<terraform_mute_timing_name>.name]
|
||||
}
|
||||
}
|
||||
```
|
||||
|
||||
To configure the mute timing and contact point previously created in the notification policy tree, replace the following field values:
|
||||
|
||||
- `<terraform_data_source_name>` with the terraform name of the previously defined contact point.
|
||||
- `<terraform_folder_name>` with the terraform name of the the previously defined mute timing.
|
||||
|
||||
1. Continue to add more Grafana resources or [use the Terraform CLI for provisioning](#provision-grafana-resources-with-terraform).
|
||||
|
||||
### Enable editing resources in the Grafana UI
|
||||
|
||||
By default, you cannot edit resources provisioned via Terraform in Grafana. This ensures that your alerting stack always stays in sync with your Terraform code.
|
||||
|
||||
To make provisioned resources editable in the Grafana UI, enable the `disable_provenance` attribute on alerting resources.
|
||||
|
||||
```terraform
|
||||
resource "grafana_contact_point" "my_contact_point" {
|
||||
name = "My Contact Point"
|
||||
|
||||
resource "grafana_mute_timing" "mute_all" {
|
||||
name = "mute all"
|
||||
disable_provenance = true
|
||||
intervals {}
|
||||
}
|
||||
|
||||
resource "grafana_message_template" "my_template" {
|
||||
name = "My Reusable Template"
|
||||
template = "{{define \"My Reusable Template\" }}\n template content\n{{ end }}"
|
||||
|
||||
disable_provenance = true
|
||||
}
|
||||
...
|
||||
```
|
||||
|
||||
**Useful Links:**
|
||||
Note that `disable_provenance` is not supported for [grafana_mute_timing](https://registry.terraform.io/providers/grafana/grafana/latest/docs/resources/mute_timing).
|
||||
|
||||
[Grafana Terraform Provider documentation](https://registry.terraform.io/providers/grafana/grafana/latest/docs)
|
||||
## Provision Grafana resources with Terraform
|
||||
|
||||
To create the previous alerting resources in Grafana with the Terraform CLI, complete the following steps.
|
||||
|
||||
1. Initialize the working directory containing the Terraform configuration files.
|
||||
|
||||
```shell
|
||||
terraform init
|
||||
```
|
||||
|
||||
This command initializes the Terraform directory, installing the Grafana Terraform provider configured in the `main.tf` file.
|
||||
|
||||
1. Apply the Terraform configuration files to provision the resources.
|
||||
|
||||
```shell
|
||||
terraform apply
|
||||
```
|
||||
|
||||
Before applying any changes to Grafana, Terraform displays the execution plan and requests your approval.
|
||||
|
||||
```shell
|
||||
Plan: 4 to add, 0 to change, 0 to destroy.
|
||||
|
||||
Do you want to perform these actions?
|
||||
Terraform will perform the actions described above.
|
||||
Only 'yes' will be accepted to approve.
|
||||
|
||||
Enter a value:
|
||||
```
|
||||
|
||||
Once you have confirmed to proceed with the changes, Terraform will create the provisioned resources in Grafana!
|
||||
|
||||
```shell
|
||||
Apply complete! Resources: 4 added, 0 changed, 0 destroyed.
|
||||
```
|
||||
|
||||
You can now access Grafana to verify the creation of the distinct resources.
|
||||
|
||||
## More examples
|
||||
|
||||
For more examples on the concept of this guide:
|
||||
|
||||
- Try the demo [provisioning alerting resources in Grafana OSS using Terraform and Docker Compose](https://github.com/grafana/provisioning-alerting-examples/tree/main/terraform).
|
||||
- Review all the available options and examples of the Terraform Alerting schemas in the [Grafana Terraform Provider documentation](https://registry.terraform.io/providers/grafana/grafana/latest/docs).
|
||||
- Review the [tutorial to manage a Grafana Cloud stack using Terraform][provision-cloud-with-terraform].
|
||||
|
||||
{{% docs/reference %}}
|
||||
|
||||
[alerting-rules]: "/docs/grafana/ -> /docs/grafana/<GRAFANA_VERSION>/alerting/alerting-rules"
|
||||
[alerting-rules]: "/docs/grafana-cloud/ -> /docs/grafana-cloud/alerting-and-irm/alerting/alerting-rules"
|
||||
|
||||
[contact-points]: "/docs/grafana/ -> /docs/grafana/<GRAFANA_VERSION>/alerting/manage-notifications/manage-contact-points"
|
||||
[contact-points]: "/docs/grafana-cloud/ -> /docs/grafana-cloud/alerting-and-irm/alerting/manage-notifications/manage-contact-points"
|
||||
|
||||
[mute-timings]: "/docs/grafana/ -> /docs/grafana/<GRAFANA_VERSION>/alerting/manage-notifications/mute-timings"
|
||||
[mute-timings]: "/docs/grafana-cloud/ -> /docs/grafana-cloud/alerting-and-irm/alerting/manage-notifications/mute-timings"
|
||||
|
||||
[notification-policy]: "/docs/grafana/ -> /docs/grafana/<GRAFANA_VERSION>/alerting/alerting-rules/create-notification-policy"
|
||||
[notification-policy]: "/docs/grafana-cloud/ -> /docs/grafana-cloud/alerting-and-irm/alerting/alerting-rules/create-notification-policy"
|
||||
|
||||
[notification-template]: "/docs/grafana/ -> /docs/grafana/<GRAFANA_VERSION>/alerting/manage-notifications/template-notifications"
|
||||
[notification-template]: "/docs/grafana-cloud/ -> /docs/grafana-cloud/alerting-and-irm/alerting/manage-notifications/template-notifications"
|
||||
|
||||
[alerting_export]: "/docs/grafana/ -> /docs/grafana/<GRAFANA_VERSION>/alerting/set-up/provision-alerting-resources/export-alerting-resources"
|
||||
[alerting_export]: "/docs/grafana-cloud/ -> /docs/grafana/<GRAFANA_VERSION>/alerting/set-up/provision-alerting-resources/export-alerting-resources"
|
||||
|
||||
@@ -387,5 +415,12 @@ resource "grafana_mute_timing" "mute_all" {
|
||||
[service-accounts]: "/docs/grafana-cloud/ -> /docs/grafana/<GRAFANA_VERSION>/administration/service-accounts"
|
||||
|
||||
[testdata]: "/docs/grafana/ -> /docs/grafana/<GRAFANA_VERSION>/datasources/testdata"
|
||||
[testdata]: "/docs/grafana-cloud/ -> /docs/grafana/<GRAFANA_VERSION>/datasources/testdata"
|
||||
[testdata]: "/docs/grafana-cloud/ -> /docs/grafana-cloud/connect-externally-hosted/data-sources/testdata"
|
||||
|
||||
[provision-cloud-with-terraform]: "/docs/ -> /docs/grafana-cloud/developer-resources/infrastructure-as-code/terraform/terraform-cloud-stack"
|
||||
|
||||
[rbac-role-definitions]: "/docs/ -> /docs/grafana/<GRAFANA_VERSION>/administration/roles-and-permissions/access-control/rbac-fixed-basic-role-definitions"
|
||||
|
||||
[rbac-terraform-provisioning]: "/docs/ -> /docs/grafana/<GRAFANA_VERSION>/administration/roles-and-permissions/access-control/rbac-terraform-provisioning"
|
||||
|
||||
{{% /docs/reference %}}
|
||||
|
||||
@@ -28,46 +28,50 @@ Before you begin, ensure that you have configured a data source. See also:
|
||||
- [Playlist][]
|
||||
- [Reporting][]
|
||||
- [Version history][]
|
||||
- [Export and import][]
|
||||
- [Import][]
|
||||
- [Export and share][]
|
||||
- [JSON model][]
|
||||
|
||||
{{% docs/reference %}}
|
||||
[data source]: "/docs/grafana/ -> /docs/grafana/<GRAFANA VERSION>/datasources"
|
||||
[data source]: "/docs/grafana-cloud/ -> /docs/grafana/<GRAFANA VERSION>/datasources"
|
||||
[data source]: "/docs/grafana-cloud/ -> /docs/grafana-cloud/connect-externally-hosted/data-sources"
|
||||
|
||||
[Reporting]: "/docs/grafana/ -> /docs/grafana/<GRAFANA VERSION>/dashboards/create-reports"
|
||||
[Reporting]: "/docs/grafana-cloud/ -> /docs/grafana/<GRAFANA VERSION>/dashboards/create-reports"
|
||||
[Reporting]: "/docs/grafana-cloud/ -> /docs/grafana-cloud/visualizations/dashboards/create-reports"
|
||||
|
||||
[Public dashboards]: "/docs/grafana/ -> /docs/grafana/<GRAFANA VERSION>/dashboards/dashboard-public"
|
||||
[Public dashboards]: "/docs/grafana-cloud/ -> /docs/grafana/<GRAFANA VERSION>/dashboards/dashboard-public"
|
||||
[Public dashboards]: "/docs/grafana-cloud/ -> /docs/grafana-cloud/visualizations/dashboards/dashboard-public"
|
||||
|
||||
[Version history]: "/docs/grafana/ -> /docs/grafana/<GRAFANA VERSION>/dashboards/build-dashboards/manage-version-history"
|
||||
[Version history]: "/docs/grafana-cloud/ -> /docs/grafana/<GRAFANA VERSION>/dashboards/build-dashboards/manage-version-history"
|
||||
[Version history]: "/docs/grafana-cloud/ -> /docs/grafana-cloud/visualizations/dashboards/build-dashboards/manage-version-history"
|
||||
|
||||
[panels]: "/docs/grafana/ -> /docs/grafana/<GRAFANA VERSION>/panels-visualizations"
|
||||
[panels]: "/docs/grafana-cloud/ -> /docs/grafana/<GRAFANA VERSION>/panels-visualizations"
|
||||
[panels]: "/docs/grafana-cloud/ -> /docs/grafana-cloud/visualizations/panels-visualizations"
|
||||
|
||||
[Annotations]: "/docs/grafana/ -> /docs/grafana/<GRAFANA VERSION>/dashboards/build-dashboards/annotate-visualizations"
|
||||
[Annotations]: "/docs/grafana-cloud/ -> /docs/grafana/<GRAFANA VERSION>/dashboards/build-dashboards/annotate-visualizations"
|
||||
[Annotations]: "/docs/grafana-cloud/ -> /docs/grafana-cloud/visualizations/dashboards/build-dashboards/annotate-visualizations"
|
||||
|
||||
[Create dashboard folders]: "/docs/grafana/ -> /docs/grafana/<GRAFANA VERSION>/dashboards/manage-dashboards#create-a-dashboard-folder"
|
||||
[Create dashboard folders]: "/docs/grafana-cloud/ -> /docs/grafana/<GRAFANA VERSION>/dashboards/manage-dashboards#create-a-dashboard-folder"
|
||||
[Create dashboard folders]: "/docs/grafana-cloud/ -> /docs/grafana-cloud/visualizations/dashboards/manage-dashboards#create-a-dashboard-folder"
|
||||
|
||||
[JSON model]: "/docs/grafana/ -> /docs/grafana/<GRAFANA VERSION>/dashboards/build-dashboards/view-dashboard-json-model"
|
||||
[JSON model]: "/docs/grafana-cloud/ -> /docs/grafana/<GRAFANA VERSION>/dashboards/build-dashboards/view-dashboard-json-model"
|
||||
[JSON model]: "/docs/grafana-cloud/ -> /docs/grafana-cloud/visualizations/dashboards/build-dashboards/view-dashboard-json-model"
|
||||
|
||||
[Export and import]: "/docs/grafana/ -> /docs/grafana/<GRAFANA VERSION>/dashboards/manage-dashboards#export-and-import-dashboards"
|
||||
[Export and import]: "/docs/grafana-cloud/ -> /docs/grafana/<GRAFANA VERSION>/dashboards/manage-dashboards#export-and-import-dashboards"
|
||||
[Import]: "/docs/grafana/ -> /docs/grafana/<GRAFANA VERSION>/dashboards/build-dashboards/import-dashboards"
|
||||
[Import]: "/docs/grafana-cloud/ -> /docs/grafana-cloud/visualizations/dashboards/build-dashboards/import-dashboards"
|
||||
|
||||
[Export and share]: "/docs/grafana/ -> /docs/grafana/<GRAFANA VERSION>/dashboards/share-dashboards-panels"
|
||||
[Export and share]: "/docs/grafana-cloud/ -> /docs/grafana-cloud/visualizations/dashboards/share-dashboards-panels"
|
||||
|
||||
[Manage dashboards]: "/docs/grafana/ -> /docs/grafana/<GRAFANA VERSION>/dashboards/manage-dashboards"
|
||||
[Manage dashboards]: "/docs/grafana-cloud/ -> /docs/grafana/<GRAFANA VERSION>/dashboards/manage-dashboards"
|
||||
[Manage dashboards]: "/docs/grafana-cloud/ -> /docs/grafana-cloud/visualizations/dashboards/manage-dashboards"
|
||||
|
||||
[Build dashboards]: "/docs/grafana/ -> /docs/grafana/<GRAFANA VERSION>/dashboards/build-dashboards"
|
||||
[Build dashboards]: "/docs/grafana-cloud/ -> /docs/grafana/<GRAFANA VERSION>/dashboards/build-dashboards"
|
||||
[Build dashboards]: "/docs/grafana-cloud/ -> /docs/grafana-cloud/visualizations/dashboards/build-dashboards"
|
||||
|
||||
[Use dashboards]: "/docs/grafana/ -> /docs/grafana/<GRAFANA VERSION>/dashboards/use-dashboards"
|
||||
[Use dashboards]: "/docs/grafana-cloud/ -> /docs/grafana/<GRAFANA VERSION>/dashboards/use-dashboards"
|
||||
[Use dashboards]: "/docs/grafana-cloud/ -> /docs/grafana-cloud/visualizations/dashboards/use-dashboards"
|
||||
|
||||
[Playlist]: "/docs/grafana/ -> /docs/grafana/<GRAFANA VERSION>/dashboards/create-manage-playlists"
|
||||
[Playlist]: "/docs/grafana-cloud/ -> /docs/grafana/<GRAFANA VERSION>/dashboards/create-manage-playlists"
|
||||
[Playlist]: "/docs/grafana-cloud/ -> /docs/grafana-cloud/visualizations/dashboards/create-manage-playlists"
|
||||
{{% /docs/reference %}}
|
||||
|
||||
@@ -86,6 +86,10 @@ Alternatively, to add an annotation, press Ctrl/Cmd and click the panel, and the
|
||||
|
||||
In the dashboard settings, under **Annotations**, you can add new queries to fetch annotations using any data source, including the built-in data annotation data source. Annotation queries return events that can be visualized as event markers in graphs across the dashboard.
|
||||
|
||||
Check out the video below for a quick tutorial.
|
||||
|
||||
{{< youtube id="2istdJpPj2Y" >}}
|
||||
|
||||
### Add new annotation queries
|
||||
|
||||
To add a new annotation query to a dashboard, take the following steps:
|
||||
|
||||
@@ -284,8 +284,8 @@ filters = report:debug
|
||||
```
|
||||
|
||||
{{% docs/reference %}}
|
||||
[time range controls]: "/docs/grafana/ -> /docs/grafana/<GRAFANA VERSION>/dashboards/manage-dashboards"
|
||||
[time range controls]: "/docs/grafana-cloud/ -> /docs/grafana/<GRAFANA VERSION>/dashboards/manage-dashboards"
|
||||
[time range controls]: "/docs/grafana/ -> /docs/grafana/<GRAFANA VERSION>/dashboards/use-dashboards#set-dashboard-time-range"
|
||||
[time range controls]: "/docs/grafana-cloud/ -> /docs/grafana-cloud/visualizations/dashboards/use-dashboards#set-dashboard-time-range"
|
||||
|
||||
[image rendering]: "/docs/grafana/ -> /docs/grafana/<GRAFANA VERSION>/setup-grafana/image-rendering"
|
||||
[image rendering]: "/docs/grafana-cloud/ -> /docs/grafana/<GRAFANA VERSION>/setup-grafana/image-rendering"
|
||||
@@ -306,10 +306,10 @@ filters = report:debug
|
||||
[SMTP]: "/docs/grafana-cloud/ -> /docs/grafana/<GRAFANA VERSION>/setup-grafana/configure-grafana#smtp"
|
||||
|
||||
[Repeat panels or rows]: "/docs/grafana/ -> /docs/grafana/<GRAFANA VERSION>/panels-visualizations/configure-panel-options#configure-repeating-rows-or-panels"
|
||||
[Repeat panels or rows]: "/docs/grafana-cloud/ -> /docs/grafana/<GRAFANA VERSION>/panels-visualizations/configure-panel-options#configure-repeating-rows-or-panels"
|
||||
[Repeat panels or rows]: "/docs/grafana-cloud/ -> /docs/grafana-cloud/visualizations/panels-visualizations/configure-panel-options#configure-repeating-rows-or-panels"
|
||||
|
||||
[Templates and variables]: "/docs/grafana/ -> /docs/grafana/<GRAFANA VERSION>/dashboards/variables"
|
||||
[Templates and variables]: "/docs/grafana-cloud/ -> /docs/grafana/<GRAFANA VERSION>/dashboards/variables"
|
||||
[Templates and variables]: "/docs/grafana-cloud/ -> /docs/grafana-cloud/visualizations/dashboards/variables"
|
||||
|
||||
[temp-data-lifetime]: "/docs/grafana/ -> /docs/grafana/<GRAFANA VERSION>/setup-grafana/configure-grafana#temp-data-lifetime"
|
||||
[temp-data-lifetime]: "/docs/grafana-cloud/ -> /docs/grafana/<GRAFANA VERSION>/setup-grafana/configure-grafana#temp-data-lifetime"
|
||||
|
||||
@@ -93,9 +93,26 @@ You can publish snapshots to your local instance or to [snapshots.raintank.io](h
|
||||
|
||||
If you created a snapshot by mistake, click **Delete snapshot** to remove the snapshot from your Grafana instance.
|
||||
|
||||
### Dashboard export
|
||||
### Export a dashboard as JSON
|
||||
|
||||
Grafana dashboards can easily be exported and imported. For more information, refer to [Export and import dashboards][].
|
||||
The dashboard export action creates a Grafana JSON file that contains everything you need, including layout, variables, styles, data sources, queries, and so on, so that you can later import the dashboard.
|
||||
|
||||
1. Click **Dashboards** in the main menu.
|
||||
1. Open the dashboard you want to export.
|
||||
1. Click the **Share** icon in the top navigation bar.
|
||||
1. Click **Export**.
|
||||
|
||||
If you're exporting the dashboard to use in another instance, with different data source UIDs, enable the **Export for sharing externally** switch.
|
||||
|
||||
1. Click **Save to file**.
|
||||
|
||||
Grafana downloads a JSON file to your local machine.
|
||||
|
||||
#### Make a dashboard portable
|
||||
|
||||
If you want to export a dashboard for others to use, you can add template variables for things like a metric prefix (use a constant variable) and server name.
|
||||
|
||||
A template variable of the type `Constant` is automatically hidden in the dashboard, and is also added as a required input when the dashboard is imported.
|
||||
|
||||
## Export dashboard as PDF
|
||||
|
||||
@@ -192,9 +209,6 @@ To create a library panel from the **Share Panel** dialog:
|
||||
1. Save the dashboard.
|
||||
|
||||
{{% docs/reference %}}
|
||||
[Export and import dashboards]: "/docs/grafana/ -> /docs/grafana/<GRAFANA VERSION>/dashboards/manage-dashboards#export-and-import-dashboards"
|
||||
[Export and import dashboards]: "/docs/grafana-cloud/ -> /docs/grafana/<GRAFANA VERSION>/dashboards/manage-dashboards#export-and-import-dashboards"
|
||||
|
||||
[Grafana Enterprise]: "/docs/grafana/ -> /docs/grafana/<GRAFANA VERSION>/introduction/grafana-enterprise"
|
||||
[Grafana Enterprise]: "/docs/grafana-cloud/ -> /docs/grafana/<GRAFANA VERSION>/introduction/grafana-enterprise"
|
||||
|
||||
|
||||
@@ -197,7 +197,7 @@ Click the **Copy time range to clipboard** icon to copy the current time range t
|
||||
|
||||
<img class="no-shadow" src="/media/docs/grafana/dashboards/screenshot-copy-paste-time-range.png" max-width="900">
|
||||
|
||||
You can also copy and paste a time range using the the keyboard shortcuts `t+c` and `t+v` respectively.
|
||||
You can also copy and paste a time range using the keyboard shortcuts `t+c` and `t+v` respectively.
|
||||
|
||||
#### Zoom out (Cmd+Z or Ctrl+Z)
|
||||
|
||||
|
||||
@@ -32,14 +32,29 @@ This documentation describes how to manage data sources in general,
|
||||
and how to configure or query the built-in data sources.
|
||||
For other data sources, refer to the list of [datasource plugins](/grafana/plugins/).
|
||||
|
||||
To develop a custom plugin, refer to [Build a plugin](/developers/plugin-tools).
|
||||
To develop a custom plugin, refer to [Create a data source plugin](#create-a-data-source-plugin).
|
||||
|
||||
## Manage data sources
|
||||
|
||||
Only users with the [organization administrator role][organization-roles] can add or remove data sources.
|
||||
To access data source management tools in Grafana as an administrator, navigate to **Configuration > Data Sources** in the Grafana sidebar.
|
||||
|
||||
For details on data source management, including instructions on how to add data sources and configure user permissions for queries, refer to the [administration documentation][data-source-management].
|
||||
For details on data source management, including instructions on how configure user permissions for queries, refer to the [administration documentation][data-source-management].
|
||||
|
||||
## Add a data source
|
||||
|
||||
Before you can create your first dashboard, you need to add your data source.
|
||||
|
||||
{{% admonition type="note" %}}
|
||||
Only users with the organization admin role can add data sources.
|
||||
{{% /admonition %}}
|
||||
|
||||
**To add a data source:**
|
||||
|
||||
1. Click **Connections** in the left-side menu.
|
||||
1. Enter the name of a specific data source in the search dialog. You can filter by **Data source** to only see data sources.
|
||||
1. Click the data source you want to add.
|
||||
1. Configure the data source following instructions specific to that data source.
|
||||
|
||||
## Use query editors
|
||||
|
||||
@@ -55,7 +70,7 @@ For example, this video demonstrates the visual Prometheus query builder:
|
||||
|
||||
{{< vimeo 720004179 >}}
|
||||
|
||||
For general information about querying in Grafana, and common options and user interface elements across all query editors, refer to [Query and transform data][query-transform-data] .
|
||||
For general information about querying in Grafana, and common options and user interface elements across all query editors, refer to [Query and transform data][query-transform-data].
|
||||
|
||||
## Special data sources
|
||||
|
||||
@@ -68,6 +83,7 @@ Grafana includes three special data sources:
|
||||
- You can't change an existing query to use the **Mixed** data source.
|
||||
- Grafana Play example: [Mixed data sources](https://play.grafana.org/d/000000100/mixed-datasources?orgId=1)
|
||||
- **Dashboard:** A data source that uses the result set from another panel in the same dashboard. The dashboard data source can use data either directly from the selected panel or from annotations attached to the selected panel.
|
||||
- Grafana Play example: [Panel as Data source](https://play.grafana.org/d/ede8zps8ndb0gc/panel-as-data-source?orgId=1)
|
||||
|
||||
## Built-in core data sources
|
||||
|
||||
@@ -91,6 +107,24 @@ These built-in core data sources are also included in the Grafana documentation:
|
||||
- [Testdata]({{< relref "./testdata" >}})
|
||||
- [Zipkin]({{< relref "./zipkin" >}})
|
||||
|
||||
## Add additional data source plugins
|
||||
|
||||
You can add additional data sources as plugins (that are not available in core Grafana), which you can install or create yourself.
|
||||
|
||||
### Find data source plugins in the plugin catalog
|
||||
|
||||
To view available data source plugins, go to the [plugin catalog](/grafana/plugins/?type=datasource) and select the "Data sources" filter.
|
||||
For details about the plugin catalog, refer to [Plugin management][Plugin-management].
|
||||
|
||||
You can further filter the plugin catalog's results for data sources provided by the Grafana community, Grafana Labs, and partners.
|
||||
If you use [Grafana Enterprise][Grafana-Enterprise], you can also filter by Enterprise-supported plugins.
|
||||
|
||||
For more documentation on a specific data source plugin's features, including its query language and editor, refer to its plugin catalog page.
|
||||
|
||||
### Create a data source plugin
|
||||
|
||||
To build your own data source plugin, refer to the [Build a data source plugin](/developers/plugin-tools/tutorials/build-a-data-source-plugin) tutorial and [Plugin tools](/developers/plugin-tools).
|
||||
|
||||
{{% docs/reference %}}
|
||||
[alerts]: "/docs/grafana/ -> /docs/grafana/<GRAFANA VERSION>/alerting"
|
||||
[alerts]: "/docs/grafana-cloud/ -> /docs/grafana/<GRAFANA VERSION>/alerting"
|
||||
@@ -109,4 +143,10 @@ These built-in core data sources are also included in the Grafana documentation:
|
||||
|
||||
[query-transform-data]: "/docs/grafana/ -> /docs/grafana/<GRAFANA VERSION>/panels-visualizations/query-transform-data"
|
||||
[query-transform-data]: "/docs/grafana-cloud/ -> /docs/grafana/<GRAFANA VERSION>/panels-visualizations/query-transform-data"
|
||||
|
||||
[Plugin-management]: "/docs/grafana/ -> /docs/grafana/<GRAFANA VERSION>/administration/plugin-management"
|
||||
[Plugin-management]: "/docs/grafana-cloud -> /docs/grafana/<GRAFANA VERSION>/administration/plugin-management"
|
||||
|
||||
[Grafana-Enterprise]: "/docs/grafana/ -> /docs/grafana/<GRAFANA VERSION>/introduction/grafana-enterprise"
|
||||
|
||||
{{% /docs/reference %}}
|
||||
|
||||
@@ -159,7 +159,7 @@ To use the Grafana Assume Role:
|
||||
1. Put in a request to Customer Support to enable`awsDatasourcesTempCredentials`.
|
||||
2. Once the feature is enabled, create a new CloudWatch data source (or update an existing one) and select **Grafana Assume Role** as an authentication provider.
|
||||
3. In the AWS Console, create a new IAM role, and under **Trusted entity type**, select **Another AWS account** as the trusted Entity.
|
||||
4. Enter Grafana's account id (displayed in the instructions box on the the **Settings** tab of the CloudWatch data source configuration) and check the **Require external ID** box.
|
||||
4. Enter Grafana's account id (displayed in the instructions box on the **Settings** tab of the CloudWatch data source configuration) and check the **Require external ID** box.
|
||||
5. Enter the external ID specified in the instructions box on the **Settings** tab of the CloudWatch data source configuration in Grafana. This external ID will be unique to your Grafana instance.
|
||||
6. Attach any required permissions you would like Grafana to be able to access on your behalf (for example, CloudWatch Logs and CloudWatch Metrics policies).
|
||||
7. Give the role a name and description, and click **Create role**.
|
||||
|
||||
@@ -86,17 +86,17 @@ For example:
|
||||
- `Blob Type: {{ blobtype }}` becomes `Blob Type: PageBlob`, `Blob Type: BlockBlob`
|
||||
- `{{ resourcegroup }} - {{ resourcename }}` becomes `production - web_server`
|
||||
|
||||
| Alias pattern | Description |
|
||||
| ----------------------------- | ------------------------------------------------------------------------------------------------------ |
|
||||
| `{{ subscriptionid }}` | Replaced with the subscription ID. |
|
||||
| `{{ subscription }}` | Replaced with the subscription name. |
|
||||
| `{{ resourcegroup }}` | Replaced with the the resource group. |
|
||||
| `{{ namespace }}` | Replaced with the resource type or namespace, such as `Microsoft.Compute/virtualMachines`. |
|
||||
| `{{ resourcename }}` | Replaced with the resource name. |
|
||||
| `{{ metric }}` | Replaced with the metric name, such as "Percentage CPU". |
|
||||
| _`{{ arbitaryDimensionID }}`_ | Replaced with the value of the specified dimension. For example, `{{ blobtype }}` becomes `BlockBlob`. |
|
||||
| `{{ dimensionname }}` | _(Legacy for backward compatibility)_ Replaced with the name of the first dimension. |
|
||||
| `{{ dimensionvalue }}` | _(Legacy for backward compatibility)_ Replaced with the value of the first dimension. |
|
||||
| Alias pattern | Description |
|
||||
| ------------------------------ | ------------------------------------------------------------------------------------------------------ |
|
||||
| `{{ subscriptionid }}` | Replaced with the subscription ID. |
|
||||
| `{{ subscription }}` | Replaced with the subscription name. |
|
||||
| `{{ resourcegroup }}` | Replaced with the resource group. |
|
||||
| `{{ namespace }}` | Replaced with the resource type or namespace, such as `Microsoft.Compute/virtualMachines`. |
|
||||
| `{{ resourcename }}` | Replaced with the resource name. |
|
||||
| `{{ metric }}` | Replaced with the metric name, such as "Percentage CPU". |
|
||||
| _`{{ arbitraryDimensionID }}`_ | Replaced with the value of the specified dimension. For example, `{{ blobtype }}` becomes `BlockBlob`. |
|
||||
| `{{ dimensionname }}` | _(Legacy for backward compatibility)_ Replaced with the name of the first dimension. |
|
||||
| `{{ dimensionvalue }}` | _(Legacy for backward compatibility)_ Replaced with the value of the first dimension. |
|
||||
|
||||
### Filter using dimensions
|
||||
|
||||
@@ -106,7 +106,7 @@ Grafana can display and filter metrics based on dimension values.
|
||||
|
||||
The data source supports the `equals`, `not equals`, and `starts with` operators as detailed in the [Monitor Metrics API documentation](https://docs.microsoft.com/en-us/rest/api/monitor/metrics/list).
|
||||
|
||||
For more information onmulti-dimensional metrics, refer to the [Azure Monitor data platform metrics documentation](https://docs.microsoft.com/en-us/azure/azure-monitor/essentials/data-platform-metrics#multi-dimensional-metrics) and [Azure Monitor filtering documentation](https://docs.microsoft.com/en-us/azure/azure-monitor/essentials/metrics-charts#filters).
|
||||
For more information on multi-dimensional metrics, refer to the [Azure Monitor data platform metrics documentation](https://docs.microsoft.com/en-us/azure/azure-monitor/essentials/data-platform-metrics#multi-dimensional-metrics) and [Azure Monitor filtering documentation](https://docs.microsoft.com/en-us/azure/azure-monitor/essentials/metrics-charts#filters).
|
||||
|
||||
## Query Azure Monitor Logs
|
||||
|
||||
|
||||
@@ -24,9 +24,13 @@ weight: 1150
|
||||
|
||||
Grafana Pyroscope is a horizontally scalable, highly available, multi-tenant, OSS, continuous profiling aggregation system. Add it as a data source, and you are ready to query your profiles in [Explore][explore].
|
||||
|
||||
To learn more about profiling and Pyroscope, refer to the [Introduction to Pyroscope](/docs/pyroscope/introduction/).
|
||||
Refer to [Introduction to Pyroscope](https://grafana.com/docs/pyroscope/<PYROSCOPE_VERSION>/introduction/) to understand profiling and Pyroscope.
|
||||
|
||||
For information on configuring the Pyroscope data source, refer to [Configure the Grafana Pyroscope data source](./configure-pyroscope-data-source).
|
||||
To use profiling data, you should:
|
||||
|
||||
- [Configure your application to send profiles](/docs/pyroscope/<PYROSCOPE_VERSION>/configure-client/)
|
||||
- [Configure the Grafana Pyroscope data source](./configure-pyroscope-data-source/).
|
||||
- [View and query profiling data in Explore](./query-profile-data/)
|
||||
|
||||
## Integrate profiles into dashboards
|
||||
|
||||
@@ -38,12 +42,13 @@ In this case, the screenshot shows memory profiles alongside panels for logs and
|
||||
## Visualize traces and profiles data using Traces to profiles
|
||||
|
||||
You can link profile and tracing data using your Pyroscope data source with the Tempo data source.
|
||||
To learn more about how profiles and tracing can work together, refer to [Profiling and tracing synergies](./profiling-and-tracing/).
|
||||
|
||||
Combined traces and profiles let you see granular line-level detail when available for a trace span. This allows you pinpoint the exact function that's causing a bottleneck in your application as well as a specific request.
|
||||
|
||||
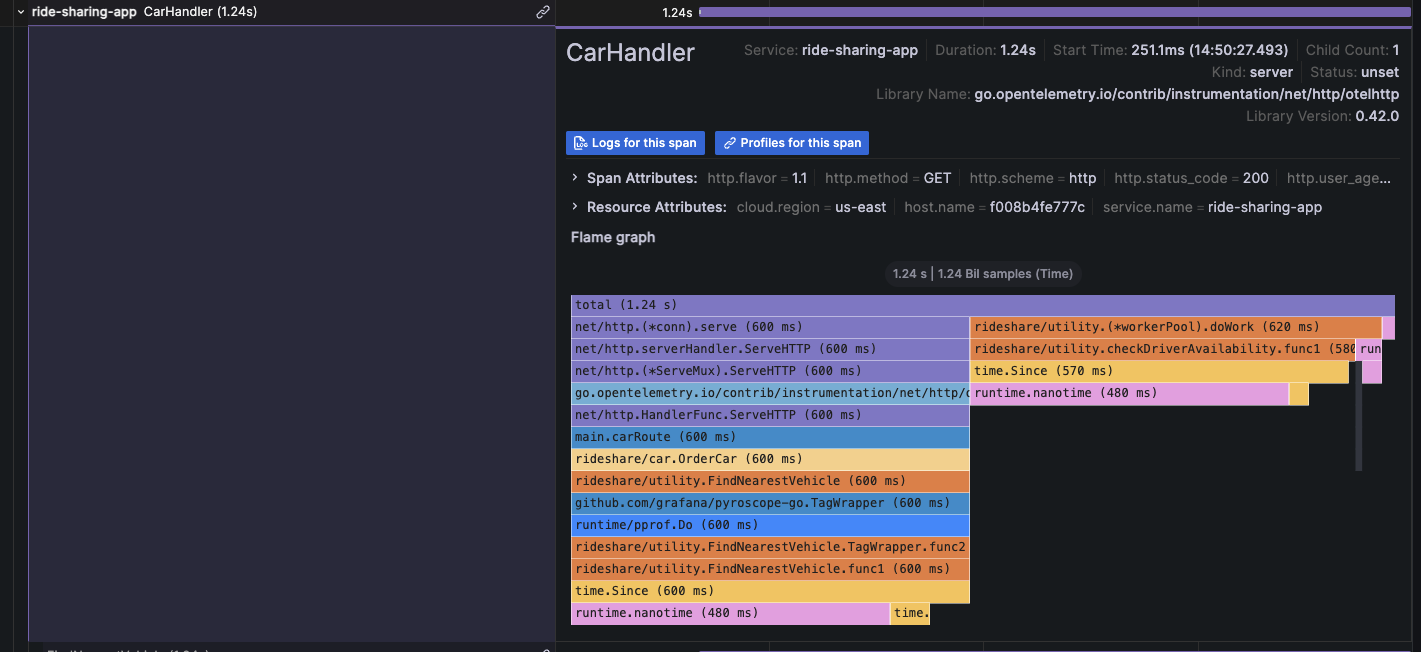
|
||||
|
||||
For more information, refer to the [Traces to profile section][configure-tempo-data-source] of the Tempo data source documentation.
|
||||
For more information, refer to the [Traces to profile section][configure-tempo-data-source] and [Link tracing and profiling with span profiles](https://grafana.com/docs/pyroscope/<PYROSCOPE_VERSION>/configure-client/trace-span-profiles/).
|
||||
|
||||
{{< youtube id="AG8VzfFMLxo" >}}
|
||||
|
||||
|
||||
16
docs/sources/datasources/pyroscope/profiling-and-tracing.md
Normal file
16
docs/sources/datasources/pyroscope/profiling-and-tracing.md
Normal file
@@ -0,0 +1,16 @@
|
||||
---
|
||||
title: How profiling and tracing work together
|
||||
menuTitle: How profiling and tracing work together
|
||||
description: Learn about how profiling and tracing work together.
|
||||
weight: 250
|
||||
keywords:
|
||||
- pyroscope data source
|
||||
- continuous profiling
|
||||
- tracing
|
||||
---
|
||||
|
||||
# How profiling and tracing work together
|
||||
|
||||
[//]: # 'Shared content for Trace to profiles in the Pyroscope data source'
|
||||
|
||||
{{< docs/shared source="grafana" lookup="datasources/pyroscope-profile-tracing-intro.md" version="<GRAFANA_VERSION>" >}}
|
||||
@@ -101,6 +101,10 @@ To query a particular trace:
|
||||
|
||||
## Query Loki for traces
|
||||
|
||||
{{< admonition type="caution" >}}
|
||||
Starting with Grafana v11.0, the Loki query tab will no longer be available.
|
||||
{{< /admonition >}}
|
||||
|
||||
To find traces to visualize, you can use the [Loki query editor]({{< relref "../../loki#loki-query-editor" >}}).
|
||||
For results, you must configure [derived fields]({{< relref "../../loki#configure-derived-fields" >}}) in the Loki data source that point to this data source.
|
||||
|
||||
|
||||
@@ -14,7 +14,20 @@ weight: 500
|
||||
|
||||
# Angular support deprecation
|
||||
|
||||
Angular plugin support is deprecated and will be removed in a future release. There are still many community plugins that rely on Grafana's Angular plugin support to work. The same is true for many internal (private) plugins that have been developed by Grafana users over the years. Grafana version 9 has a server configuration option that is global to the entire instance and controls whether Angular plugin support is available or not. By default, Angular support is still enabled, but that will change soon once we complete the migration of all Angular code in the core product.
|
||||
Angular plugin support is deprecated and will be removed in a future release.
|
||||
There are legacy core Grafana visualizations and external plugins that rely on Grafana's Angular plugin support to work. The same is likely true for [private plugins](https://grafana.com/legal/plugins/) that have been developed by Grafana users for use on their own instances over the years.
|
||||
From Grafana v9 and onwards, there is a [server configuration option](https://github.com/grafana/grafana/blob/d61bcdf4ca5e69489e0067c56fbe7f0bfdf84ee4/conf/defaults.ini#L362) that's global to the entire instance and controls whether Angular plugin support is available or not.
|
||||
In Grafana 11, we will change the default value for the configuration to remove support.
|
||||
|
||||
Warning messages are displayed if a dashboard depends on an a panel visualization or data source which requires AngularJS as shown in the following video:
|
||||
|
||||
{{< youtube id="XlEVs6g8dC8" >}}
|
||||
|
||||
To avoid disruption:
|
||||
|
||||
- Ensure that you are running the latest version of plugins by following this guide on [updating]({{< relref "../../administration/plugin-management/#update-a-plugin" >}}). Many panels and data sources have migrated from AngularJS.
|
||||
- If you are using legacy Core Grafana visualizations such as Graph or Table-old, migrate to their replacements using the provided [automatic migrations]({{< relref "./angular-plugins/#automatic-migration-of-plugins" >}}).
|
||||
- Review the [list of current Angular plugins]({{< relref "./angular-plugins/" >}}) to discover which Core and external plugins are impacted, and whether an update or alternative is required.
|
||||
|
||||
## Why are we deprecating Angular support?
|
||||
|
||||
@@ -22,17 +35,24 @@ AngularJS is an old frontend framework whose active development stopped many yea
|
||||
|
||||
## When will Angular plugins stop working?
|
||||
|
||||
Our goal is to transfer all the remaining Angular code to the core of Grafana before Grafana 10 is released in Summer 2023. Once this is done, the option "[angular_support_enabled](https://github.com/grafana/grafana/blob/d61bcdf4ca5e69489e0067c56fbe7f0bfdf84ee4/conf/defaults.ini#L362)" will be disabled by default for new Grafana Cloud users, resulting in the inability to use Angular plugins. In case you still rely on AngularJS-based plugins developed internally or by the community, you will need to enable this option to continue using them. Following the release of Grafana 10 we will be migrating Grafana Cloud users where possible and disabling Angular support when appropriate, we will also be introducing new features to help all users identify how they are impacted and to warn of the use of deprecated plugins within the Grafana UI.
|
||||
In Grafana 11, which will be released in preview in April 2024 and generally available in May, we will change the default behavior of the [angular_support_enabled](https://github.com/grafana/grafana/blob/d61bcdf4ca5e69489e0067c56fbe7f0bfdf84ee4/conf/defaults.ini#L362) configuration parameter to turn off support for AngularJS based plugins. In case you still rely on [AngularJS-based plugins]({{< relref "./angular-plugins/" >}}) developed internally or by the community, you will need to enable this option to continue using them.
|
||||
|
||||
New Grafana Cloud users will be unable to request for support to be added to their instance.
|
||||
|
||||
## When will we remove Angular support completely?
|
||||
|
||||
Our plan is to completely remove support for Angular plugins in version 11, which will be released in 2024. This means that all plugins that depend on Angular will stop working and the temporary option introduced in version 10 to enable Angular will be removed.
|
||||
Our current plan is to completely remove any remaining support for Angular plugins in version 12. Including the removal of the [angular_support_enabled](https://github.com/grafana/grafana/blob/d61bcdf4ca5e69489e0067c56fbe7f0bfdf84ee4/conf/defaults.ini#L362) configuration parameter.
|
||||
|
||||
## A dashboard I use is displaying a warning, what do I need to do?
|
||||
|
||||
A dashboard displays warnings when one or more panel visualizations or data sources in the dashboard have a dependency on Angular.
|
||||
Contact your system administrator to advise them of the issue or follow the preceding guidance on avoiding disruption.
|
||||
|
||||
## How do I migrate an Angular plugin to React?
|
||||
|
||||
Depending on if it’s a data source plugin, panel plugin, or app plugin the process will differ.
|
||||
|
||||
For panels, the rendering logic could in some cases be easily preserved but all options need to be redone to use the declarative options framework. For data source plugins the query editor and config options will likely need a total rewrite.
|
||||
For panels, the rendering logic could in some cases be easily preserved, but all options need to be redone to use the declarative options framework. For data source plugins the query editor and config options will likely need a total rewrite.
|
||||
|
||||
## How do I encourage a community plugin to migrate?
|
||||
|
||||
|
||||
@@ -48,7 +48,7 @@ Additionally, warning icons and messages will be displayed when browsing the cat
|
||||
|
||||
## Automatic migration of plugins
|
||||
|
||||
Certain legacy Grafana panel plugins automatically update to their React-based replacements when Angular support is disabled. This migration is usually available within the panel options, as shown in the screenshot below for World Map. Automatic migration can also be tested by appending `&__feature.autoMigrateOldPanels=true` to the dashboard URL in your browser.
|
||||
Certain legacy Grafana panel plugins automatically update to their React-based replacements when Angular support is disabled. This migration is usually available within the panel options, as shown in the screenshot below for World Map. Automatic migration can be triggered by setting the feature toggle `autoMigrateOldPanels` to `true`.
|
||||
|
||||
Automatic migration is supported for the plugins shown in the following table. Each of the target plugins are included in Grafana as Core plugins which don't require installation.
|
||||
|
||||
@@ -111,7 +111,7 @@ This table lists plugins which we have detected as having a dependency on Angula
|
||||
| blackmirror1-statusbygroup-panel | Status By Group Panel | Migrate - Browse included visualizations and plugins catalog for potential alternatives. |
|
||||
| novalabs-annotations-panel | Annotation Panel | Migrate - Browse included visualizations and plugins catalog for potential alternatives. |
|
||||
| jasonlashua-prtg-datasource | PRTG | Migrate - Browse included data sources and plugins catalog for potential alternatives. |
|
||||
| ryantxu-annolist-panel | Annotation List | Migrate - Consider [annotations list]({{< relref "../../panels-visualizations/visualizations/annotation-list" >}}) (core). |
|
||||
| ryantxu-annolist-panel | Annotation List | Migrate - Consider [annotations list]({{< relref "../../panels-visualizations/visualizations/annotations" >}}) (core). |
|
||||
| cloudflare-app | Cloudflare Grafana App | Migrate - Consider using the [Cloudflare Dashboard](https://dash.cloudflare.com/?to=/:account/:zone/analytics/dns) or [DNS Analytics API](https://developers.cloudflare.com/api/operations/dns-analytics-table). |
|
||||
| smartmakers-trafficlight-panel | TrafficLight | Migrate - Consider [Traffic Light](https://grafana.com/grafana/plugins/heywesty-trafficlight-panel/) as a potential alternative. |
|
||||
| zuburqan-parity-report-panel | Parity Report | Migrate - Browse included visualizations and plugins catalog for potential alternatives. |
|
||||
@@ -201,7 +201,6 @@ This table lists plugins which we have detected as having a dependency on Angula
|
||||
| stagemonitor-elasticsearch-app | stagemonitor Elasticsearch | Migrate - Browse included data sources and plugins catalog for potential alternatives. |
|
||||
| tdengine-datasource | TDengine Datasource | Update - Note the minimum version for React is 3.3.0. We recommend the latest. |
|
||||
| vertica-grafana-datasource | Vertica | Update - Note the minimum version for React is 2.0.0. We recommend the latest. |
|
||||
| vonage-status-panel | Status Panel | Wait - Updated version may become available, or browse included visualizations and plugins catalog for potential alternatives. |
|
||||
| voxter-app | Voxter VoIP Platform Metrics | Migrate - Browse included data sources and plugins catalog for potential alternatives. |
|
||||
| graph | Graph (old) | Migrate - Note that this is replaced by [Time Series]({{< relref "../../panels-visualizations/visualizations/time-series" >}}) (core) - This plugin should migrate when Angular is disabled. Also consider Bar Chart or Histogram if appropriate. |
|
||||
| table-old | Table (old) | Migrate - Note that this is replaced by [Table]({{< relref "../../panels-visualizations/visualizations/table" >}}) (core) - This plugin should migrate when AngularJS is disabled. |
|
||||
|
||||
@@ -383,12 +383,12 @@ Content-Type: application/json
|
||||
HTTP/1.1 200 OK
|
||||
Content-Type: application/json; charset=UTF-8
|
||||
|
||||
```
|
||||
|
||||
#### Status codes
|
||||
|
||||
| Code | Description |
|
||||
| ---- | ---------------------------------------------------------------------------------- |
|
||||
```
|
||||
|
||||
#### Status codes
|
||||
|
||||
| Code | Description |
|
||||
| ---- | ---------------------------------------------------------------------------------- |
|
||||
| 200 | Role is deleted. |
|
||||
| 400 | Bad request (invalid json, missing content-type, missing or invalid fields, etc.). |
|
||||
| 403 | Access denied |
|
||||
@@ -498,13 +498,13 @@ For more information, refer to [Create role validation errors]({{< ref "#create-
|
||||
```http
|
||||
HTTP/1.1 200 OK
|
||||
Content-Type: application/json; charset=UTF-8
|
||||
|
||||
```
|
||||
|
||||
#### Status codes
|
||||
|
||||
| Code | Description |
|
||||
| ---- | -------------------------------------------------------------------- |
|
||||
|
||||
```
|
||||
|
||||
#### Status codes
|
||||
|
||||
| Code | Description |
|
||||
| ---- | -------------------------------------------------------------------- |
|
||||
| 200 | Set of assigned permissions is returned. |
|
||||
| 403 | Access denied. |
|
||||
| 500 | Unexpected error. Refer to body and/or server logs for more details. |
|
||||
@@ -532,7 +532,7 @@ Accept: application/json
|
||||
```http
|
||||
POST /api/access-control/users/1/roles
|
||||
Accept: application/json
|
||||
Content-Type: application/json
|
||||
Content-Type: application/json
|
||||
|
||||
{
|
||||
"global": false,
|
||||
|
||||
@@ -32,7 +32,7 @@ and the bar height represents the frequency (such as count) of values that fell
|
||||
This _histogram_ shows the value distribution of a couple of time series. You can easily see that
|
||||
most values land between 240-300 with a peak between 260-280.
|
||||
|
||||

|
||||

|
||||
|
||||
Here is an example showing height distribution of people.
|
||||
|
||||
@@ -48,7 +48,7 @@ A _heatmap_ is like a histogram, but over time, where each time slice represents
|
||||
|
||||
In this example, you can clearly see what values are more common and how they trend over time.
|
||||
|
||||

|
||||

|
||||
|
||||
For more information about heatmap visualization options, refer to [Heatmap][heatmap].
|
||||
|
||||
|
||||
@@ -29,7 +29,7 @@ In [Introduction to time series][time-series-databases], the concept of _labels_
|
||||
|
||||
With time series data, the data often contain more than a single series, and is a set of multiple time series. Many Grafana data sources support this type of data.
|
||||
|
||||
{{< figure src="/static/img/docs/example_graph_multi_dim.png" class="docs-image--no-shadow" max-width="850px" >}}
|
||||
{{< figure src="/static/img/docs/example_graph_multi_dim.png" class="docs-image--no-shadow" max-width="850px" alt="Temperature by location" >}}
|
||||
|
||||
The common case is issuing a single query for a measurement with one or more additional properties as dimensions. For example, querying a temperature measurement along with a location property. In this case, multiple series are returned back from that single query and each series has unique location as a dimension.
|
||||
|
||||
|
||||
@@ -32,7 +32,7 @@ Temperature data like this is one example of what we call a _time series_ — a
|
||||
|
||||
Tables are useful when you want to identify individual measurements, but they make it difficult to see the big picture. A more common visualization for time series is the _graph_, which instead places each measurement along a time axis. Visual representations like the graph make it easier to discover patterns and features of the data that otherwise would be difficult to see.
|
||||
|
||||
{{< figure src="/static/img/docs/example_graph.png" class="docs-image--no-shadow" max-width="850px" >}}
|
||||
{{< figure src="/static/img/docs/example_graph.png" class="docs-image--no-shadow" max-width="850px" alt="Temperature data displayed on dashboard" >}}
|
||||
|
||||
Temperature data like the one in the example, is far from the only example of a time series. Other examples of time series are:
|
||||
|
||||
|
||||
@@ -77,7 +77,7 @@ Congratulations, you have created your first dashboard and it's displaying resul
|
||||
|
||||
#### Next steps
|
||||
|
||||
Continue to experiment with what you have built, try the [explore workflow]({{< relref "../explore" >}}) or another visualization feature. Refer to [Data sources]({{< relref "../datasources" >}}) for a list of supported data sources and instructions on how to [add a data source]({{< relref "../administration/data-source-management#add-a-data-source" >}}). The following topics will be of interest to you:
|
||||
Continue to experiment with what you have built, try the [explore workflow]({{< relref "../explore" >}}) or another visualization feature. Refer to [Data sources]({{< relref "../datasources" >}}) for a list of supported data sources and instructions on how to [add a data source]({{< relref "../datasources#add-a-data-source" >}}). The following topics will be of interest to you:
|
||||
|
||||
- [Panels and visualizations]({{< relref "../panels-visualizations" >}})
|
||||
- [Dashboards]({{< relref "../dashboards" >}})
|
||||
|
||||
@@ -38,7 +38,7 @@ Windows users might need to make additional adjustments. Look for special instru
|
||||
|
||||
You can have more than one InfluxDB data source defined in Grafana.
|
||||
|
||||
1. Follow the general instructions to [add a data source]({{< relref "../administration/data-source-management#add-a-data-source" >}}).
|
||||
1. Follow the general instructions to [add a data source]({{< relref "../datasources#add-a-data-source" >}}).
|
||||
1. Decide if you will use InfluxQL or Flux as your query language.
|
||||
- [Configure the data source]({{< relref "../datasources/influxdb#configure-the-data-source" >}}) for your chosen query language.
|
||||
Each query language has its own unique data source settings.
|
||||
|
||||
@@ -30,8 +30,13 @@ Panels can be dragged, dropped, and resized to rearrange them on the dashboard.
|
||||
|
||||
Before you add a panel, ensure that you have configured a data source.
|
||||
|
||||
- For more information about adding and managing data sources as an administrator, refer to [Data source management][].
|
||||
- For details about using specific data sources, refer to [Data sources][].
|
||||
- For details about using data sources, refer to [Data sources][].
|
||||
|
||||
- For more information about managing data sources as an administrator, refer to [Data source management][].
|
||||
|
||||
{{% admonition type="note" %}}
|
||||
[Data source management](https://grafana.com/docs/grafana/<GRAFANA_VERSION>/administration/data-source-management/) is only available in [Grafana Enterprise](https://grafana.com/docs/grafana/<GRAFANA_VERSION>/introduction/grafana-enterprise/) and [Grafana Cloud](https://grafana.com/docs/grafana-cloud/).
|
||||
{{% /admonition %}}
|
||||
|
||||
This section includes the following sub topics:
|
||||
|
||||
|
||||
@@ -76,6 +76,8 @@ These variables allow you to include the current time range in the data link URL
|
||||
| `__from` | For more information, refer to [Global variables][]. |
|
||||
| `__to` | For more information, refer to [Global variables][]. |
|
||||
|
||||
When you create data links using time range variables like `__url_time_range` in the URL, you have to form the query parameter syntax yourself; that is, you must format the URL by appending query parameters using the question mark (`?`) and ampersand (`&`) syntax. These characters aren't automatically generated.
|
||||
|
||||
### Series variables
|
||||
|
||||
Series-specific variables are available under `__series` namespace:
|
||||
@@ -107,6 +109,8 @@ Value-specific variables are available under `__value` namespace:
|
||||
|
||||
Using value-specific variables in data links can show different results depending on the set option of Tooltip mode.
|
||||
|
||||
When you create data links using time range variables like `__value.time` in the URL, you have to form the query parameter syntax yourself; that is, you must add the question mark (`?`) and ampersand (`&`). These characters aren't automatically generated.
|
||||
|
||||
### Data variables
|
||||
|
||||
To access values and labels from other fields use:
|
||||
|
||||
@@ -30,7 +30,7 @@ Legends are supported for the following visualizations:
|
||||
- [Trend][trend]
|
||||
<!-- - xy chart -->
|
||||
|
||||
[Geomaps][] and [heatmaps][] also have legends, but they only provide the the choice to display or not display a legend and don't support other legend options.
|
||||
[Geomaps][] and [heatmaps][] also have legends, but they only provide the choice to display or not display a legend and don't support other legend options.
|
||||
|
||||
## Legend options
|
||||
|
||||
|
||||
@@ -21,13 +21,61 @@ weight: 110
|
||||
|
||||
# Configure field overrides
|
||||
|
||||
Overrides allow you to customize visualization settings for specific fields or series. This is accomplished by adding an override rule that targets a particular set of fields and that can each define multiple options.
|
||||
Overrides allow you to customize visualization settings for specific fields or series. When you add an override rule, it targets a particular set of fields and lets you define multiple options for how that field is displayed.
|
||||
|
||||
For example, you set the unit for all fields that include the text 'bytes' by adding an override using the `Fields with name matching regex` matcher and then add the Unit option to the override rule.
|
||||
For example, you can override the default unit measurement for all fields that include the text "bytes" by adding an override using the **Fields with name matching regex** matcher and then the **Standard options > Unit** setting to the override rule:
|
||||
|
||||
## Example 1: Format temperature
|
||||

|
||||
|
||||
Let’s assume that our result set is a data frame that consists of two fields: time and temperature.
|
||||
After you've set them, your overrides appear in both the **All** and **Overrides** tabs of the panel editor pane:
|
||||
|
||||

|
||||
|
||||
## Supported visualizations
|
||||
|
||||
You can configure field overrides for the following visualizations:
|
||||
|
||||
| | | |
|
||||
| -------------------------- | ---------------------- | -------------------------------- |
|
||||
| [Bar chart][bar chart] | [Geomap][geomap] | [State timeline][state timeline] |
|
||||
| [Bar gauge][bar gauge] | [Heatmap][heatmap] | [Status history][status history] |
|
||||
| [Candlestick][candlestick] | [Histogram][histogram] | [Table][table] |
|
||||
| [Canvas][canvas] | [Pie chart][pie chart] | [Time series][time series] |
|
||||
| [Gauge][gauge] | [Stat][stat] | [Trend][trend] |
|
||||
|
||||
<!--Also xy chart-->
|
||||
|
||||
## Override rules
|
||||
|
||||
You can choose from five types of override rules, which are described in the following sections.
|
||||
|
||||
### Fields with name
|
||||
|
||||
Select a field from the list of all available fields. Properties you add to this type of rule are only applied to this single field.
|
||||
|
||||
### Fields with name matching regex
|
||||
|
||||
Specify fields to override with a regular expression. Properties you add to this type of rule are applied to all fields where the field name matches the regular expression. This override doesn't rename the field; to do this, use the [Rename by regex transformation][].
|
||||
|
||||
### Fields with type
|
||||
|
||||
Select fields by type, such as string, numeric, or time. Properties you add to this type of rule are applied to all fields that match the selected type.
|
||||
|
||||
### Fields returned by query
|
||||
|
||||
Select all fields returned by a specific query, such as A, B, or C. Properties you add to this type of rule are applied to all fields returned by the selected query.
|
||||
|
||||
### Fields with values
|
||||
|
||||
Select all fields returned by your defined reducer condition, such as **Min**, **Max**, **Count**, **Total**. Properties you add to this type of rule are applied to all fields returned by the selected condition.
|
||||
|
||||
## Examples
|
||||
|
||||
The following examples demonstrate how you can use override rules to alter the display of fields in visualizations.
|
||||
|
||||
### Example 1: Format temperature
|
||||
|
||||
The following result set is a data frame that consists of two fields: time and temperature.
|
||||
|
||||
| time | temperature |
|
||||
| :-----------------: | :---------: |
|
||||
@@ -35,7 +83,14 @@ Let’s assume that our result set is a data frame that consists of two fields:
|
||||
| 2020-01-02 03:05:00 | 47.0 |
|
||||
| 2020-01-02 03:06:00 | 48.0 |
|
||||
|
||||
Each field (column) of this structure can have field options applied that alter the way its values are displayed. This means that you can, for example, set the Unit to Temperature > Celsius, resulting in the following table:
|
||||
You can apply field options to each field (column) of this structure to alter the way its values are displayed. For example, you can set the following override rule:
|
||||
|
||||
- Rule: **Fields with type**
|
||||
- Field: temperature
|
||||
- Override property: **Standard options > Unit**
|
||||
- Selection: **Temperature > Celsius**
|
||||
|
||||
This results in the following table:
|
||||
|
||||
| time | temperature |
|
||||
| :-----------------: | :---------: |
|
||||
@@ -43,7 +98,7 @@ Each field (column) of this structure can have field options applied that alter
|
||||
| 2020-01-02 03:05:00 | 47.0 °C |
|
||||
| 2020-01-02 03:06:00 | 48.0 °C |
|
||||
|
||||
In addition, the decimal place is not required, so we can remove it. You can change the Decimals from `auto` to zero (`0`), resulting in the following table:
|
||||
In addition, the decimal place isn't required, so you can remove it by adding another override property that changes the **Standard options > Decimals** setting from **auto** to `0`. That results in the following table:
|
||||
|
||||
| time | temperature |
|
||||
| :-----------------: | :---------: |
|
||||
@@ -51,9 +106,9 @@ In addition, the decimal place is not required, so we can remove it. You can cha
|
||||
| 2020-01-02 03:05:00 | 47 °C |
|
||||
| 2020-01-02 03:06:00 | 48 °C |
|
||||
|
||||
## Example 2: Format temperature and humidity
|
||||
### Example 2: Format temperature and humidity
|
||||
|
||||
Let’s assume that our result set is a data frame that consists of four fields: time, high temp, low temp, and humidity.
|
||||
The following result set is a data frame that consists of four fields: time, high temp, low temp, and humidity.
|
||||
|
||||
| time | high temp | low temp | humidity |
|
||||
| ------------------- | --------- | -------- | -------- |
|
||||
@@ -61,7 +116,16 @@ Let’s assume that our result set is a data frame that consists of four fields:
|
||||
| 2020-01-02 03:05:00 | 47.0 | 34.0 | 68 |
|
||||
| 2020-01-02 03:06:00 | 48.0 | 31.0 | 68 |
|
||||
|
||||
Let's add the Celsius unit and get rid of the decimal place. This results in the following table:
|
||||
Use the following override rule and properties to add the **Celsius** unit option and remove the decimal place:
|
||||
|
||||
- Rule: **Fields with type**
|
||||
- Field: temperature
|
||||
- Override property: **Standard options > Unit**
|
||||
- Selection: **Temperature > Celsius**
|
||||
- Override property: **Standard options > Decimals**
|
||||
-Change setting from **auto** to `0`
|
||||
|
||||
This results in the following table:
|
||||
|
||||
| time | high temp | low temp | humidity |
|
||||
| ------------------- | --------- | -------- | -------- |
|
||||
@@ -69,7 +133,7 @@ Let's add the Celsius unit and get rid of the decimal place. This results in the
|
||||
| 2020-01-02 03:05:00 | 47 °C | 34 °C | 68 °C |
|
||||
| 2020-01-02 03:06:00 | 48 °C | 31 °C | 68 °C |
|
||||
|
||||
The temperature fields look good, but the humidity must now be changed. We can fix this by applying a field option override to the humidity field and change the unit to Misc > percent (0-100).
|
||||
The temperature fields are displaying correctly, but the humidity has incorrect units. You can fix this by applying a **Misc > Percent (0-100)** override to the humidity field. This results in the following table:
|
||||
|
||||
| time | high temp | low temp | humidity |
|
||||
| ------------------- | --------- | -------- | -------- |
|
||||
@@ -79,47 +143,86 @@ The temperature fields look good, but the humidity must now be changed. We can f
|
||||
|
||||
## Add a field override
|
||||
|
||||
A field override rule can customize the visualization settings for a specific field or series.
|
||||
To add a field override, follow these steps:
|
||||
|
||||
1. Edit the panel to which you want to add an override.
|
||||
1. In the panel options side pane, click **Add field override** at the bottom of the pane.
|
||||
|
||||
1. Select which fields an override rule will be applied to:
|
||||
- **Fields with name:** Select a field from the list of all available fields. Properties you add to a rule with this selector are only applied to this single field.
|
||||
- **Fields with name matching regex:** Specify fields to override with a regular expression. Properties you add to a rule with this selector are applied to all fields where the field name match the regex. This override doesn't rename the field; to do this, use the [Rename by regex transformation]({{< relref "../query-transform-data/transform-data/#rename-by-regex" >}}).
|
||||
- **Fields with type:** Select fields by type, such as string, numeric, and so on. Properties you add to a rule with this selector are applied to all fields that match the selected type.
|
||||
- **Fields returned by query:** Select all fields returned by a specific query, such as A, B, or C. Properties you add to a rule with this selector are applied to all fields returned by the selected query.
|
||||
1. Navigate to the panel to which you want to add the data link.
|
||||
1. Hover over any part of the panel to display the menu icon in the upper-right corner.
|
||||
1. Click the menu icon and select **Edit** to open the panel editor.
|
||||
1. At the bottom of the panel editor pane, click **Add field override**.
|
||||
1. Select the fields to which the override will be applied:
|
||||
- **Fields with name**
|
||||
- **Fields with name matching regex**
|
||||
- **Fields with type**
|
||||
- **Fields returned by query**
|
||||
- **Fields with values**
|
||||
1. Click **Add override property**.
|
||||
1. Select the field option that you want to apply.
|
||||
1. Enter options by adding values in the fields. To return options to default values, delete the white text in the fields.
|
||||
1. Continue to add overrides to this field by clicking **Add override property**, or you can click **Add override** and select a different field to add overrides to.
|
||||
1. When finished, click **Save** to save all panel edits to the dashboard.
|
||||
|
||||
## Delete a field override
|
||||
|
||||
Delete a field override when you no longer need it. When you delete an override, the appearance of value defaults to its original format. This change impacts dashboards and dashboard users that rely on an affected panel.
|
||||
|
||||
1. Edit the panel that contains the override you want to delete.
|
||||
1. In panel options side pane, scroll down until you see the overrides.
|
||||
1. Click the override you want to delete and then click the associated trash icon.
|
||||
|
||||
## View field overrides
|
||||
|
||||
You can view field overrides in the panel display options.
|
||||
|
||||
1. Edit the panel that contains the overrides you want to view.
|
||||
1. In panel options side pane, scroll down until you see the overrides.
|
||||
|
||||
> The override settings that appear on the **All** tab are the same as the settings that appear on the **Overrides** tab.
|
||||
1. Continue to add overrides to this field by clicking **Add override property**.
|
||||
1. Add as many overrides as you need.
|
||||
1. When you're finished, click **Save** to save all panel edits to the dashboard.
|
||||
|
||||
## Edit a field override
|
||||
|
||||
Edit a field override when you want to make changes to an override setting. The change you make takes effect immediately.
|
||||
To edit a field override, follow these steps:
|
||||
|
||||
1. Edit the panel that contains the overrides you want to edit.
|
||||
1. In panel options side pane, scroll down until you see the overrides.
|
||||
1. Locate the override that you want to change.
|
||||
1. Perform any of the following:
|
||||
1. Navigate to the panel to which you want to add the data link.
|
||||
1. Hover over any part of the panel to display the menu icon in the upper-right corner.
|
||||
1. Click the menu icon and select **Edit** to open the panel editor.
|
||||
1. In the panel editor pane, click the **Overrides** tab.
|
||||
1. Locate the override you want to change.
|
||||
1. Perform any of the following tasks:
|
||||
- Edit settings on existing overrides or field selection parameters.
|
||||
- Delete existing override properties by clicking the **X** next to the property.
|
||||
- Add an override properties by clicking **Add override property**.
|
||||
- Delete an override entirely by clicking the trash icon at the top-right corner.
|
||||
|
||||
The changes you make take effect immediately.
|
||||
|
||||
{{% docs/reference %}}
|
||||
[bar chart]: "/docs/grafana/ -> /docs/grafana/<GRAFANA VERSION>/panels-visualizations/visualizations/bar-chart"
|
||||
[bar chart]: "/docs/grafana-cloud/ -> /docs/grafana-cloud/visualizations/panels-visualizations/visualizations/bar-chart"
|
||||
|
||||
[bar gauge]: "/docs/grafana/ -> /docs/grafana/<GRAFANA VERSION>/panels-visualizations/visualizations/bar-gauge"
|
||||
[bar gauge]: "/docs/grafana-cloud/ -> /docs/grafana-cloud/visualizations/panels-visualizations/visualizations/bar-gauge"
|
||||
|
||||
[candlestick]: "/docs/grafana/ -> /docs/grafana/<GRAFANA VERSION>/panels-visualizations/visualizations/candlestick"
|
||||
[candlestick]: "/docs/grafana-cloud/ -> /docs/grafana-cloud/visualizations/panels-visualizations/visualizations/candlestick"
|
||||
|
||||
[canvas]: "/docs/grafana/ -> /docs/grafana/<GRAFANA VERSION>/panels-visualizations/visualizations/canvas"
|
||||
[canvas]: "/docs/grafana-cloud/ -> /docs/grafana-cloud/visualizations/panels-visualizations/visualizations/canvas"
|
||||
|
||||
[gauge]: "/docs/grafana/ -> /docs/grafana/<GRAFANA VERSION>/panels-visualizations/visualizations/gauge"
|
||||
[gauge]: "/docs/grafana-cloud/ -> /docs/grafana-cloud/visualizations/panels-visualizations/visualizations/gauge"
|
||||
|
||||
[geomap]: "/docs/grafana/ -> /docs/grafana/<GRAFANA VERSION>/panels-visualizations/visualizations/geomap"
|
||||
[geomap]: "/docs/grafana-cloud/ -> /docs/grafana-cloud/visualizations/panels-visualizations/visualizations/geomap"
|
||||
|
||||
[heatmap]: "/docs/grafana/ -> /docs/grafana/<GRAFANA VERSION>/panels-visualizations/visualizations/heatmap"
|
||||
[heatmap]: "/docs/grafana-cloud/ -> /docs/grafana-cloud/visualizations/panels-visualizations/visualizations/heatmap"
|
||||
|
||||
[histogram]: "/docs/grafana/ -> /docs/grafana/<GRAFANA VERSION>/panels-visualizations/visualizations/histogram"
|
||||
[histogram]: "/docs/grafana-cloud/ -> /docs/grafana-cloud/visualizations/panels-visualizations/visualizations/histogram"
|
||||
|
||||
[pie chart]: "/docs/grafana/ -> /docs/grafana/<GRAFANA VERSION>/panels-visualizations/visualizations/pie-chart"
|
||||
[pie chart]: "/docs/grafana-cloud/ -> /docs/grafana-cloud/visualizations/panels-visualizations/visualizations/pie-chart"
|
||||
|
||||
[stat]: "/docs/grafana/ -> /docs/grafana/<GRAFANA VERSION>/panels-visualizations/visualizations/stat"
|
||||
[stat]: "/docs/grafana-cloud/ -> /docs/grafana-cloud/visualizations/panels-visualizations/visualizations/stat"
|
||||
|
||||
[state timeline]: "/docs/grafana/ -> /docs/grafana/<GRAFANA VERSION>/panels-visualizations/visualizations/state-timeline"
|
||||
[state timeline]: "/docs/grafana-cloud/ -> /docs/grafana-cloud/visualizations/panels-visualizations/visualizations/state-timeline"
|
||||
|
||||
[status history]: "/docs/grafana/ -> /docs/grafana/<GRAFANA VERSION>/panels-visualizations/visualizations/status-history"
|
||||
[status history]: "/docs/grafana-cloud/ -> /docs/grafana-cloud/visualizations/panels-visualizations/visualizations/status-history"
|
||||
|
||||
[table]: "/docs/grafana/ -> /docs/grafana/<GRAFANA VERSION>/panels-visualizations/visualizations/table"
|
||||
[table]: "/docs/grafana-cloud/ -> /docs/grafana-cloud/visualizations/panels-visualizations/visualizations/table"
|
||||
|
||||
[time series]: "/docs/grafana/ -> /docs/grafana/<GRAFANA VERSION>/panels-visualizations/visualizations/time-series"
|
||||
[time series]: "/docs/grafana-cloud/ -> /docs/grafana-cloud/visualizations/panels-visualizations/visualizations/time-series"
|
||||
|
||||
[trend]: "/docs/grafana/ -> /docs/grafana/<GRAFANA VERSION>/panels-visualizations/visualizations/trend"
|
||||
[trend]: "/docs/grafana-cloud/ -> /docs/grafana-cloud/visualizations/panels-visualizations/visualizations/trend"
|
||||
|
||||
[Rename by regex transformation]: "/docs/grafana/ -> /docs/grafana/<GRAFANA_VERSION>/panels-visualizations/query-transform-data/transform-data#rename-by-regex"
|
||||
[Rename by regex transformation]: "/docs/grafana-cloud -> /docs/grafana-cloud/visualizations/panels-visualizations/query-transform-data/transform-data#rename-by-regex"
|
||||
{{% /docs/reference %}}
|
||||
|
||||
@@ -25,111 +25,66 @@ weight: 50
|
||||
|
||||
# Configure panel options
|
||||
|
||||
A Grafana panel is a visual representation of data that you can customize by defining a data source query, transforming and formatting data, and configuring visualization settings.
|
||||
There are settings common to all visualizations, which you set in the **Panel options** section of the panel editor pane. The following sections describe these options as well as how to set them.
|
||||
|
||||
A panel editor includes a query builder and a series of options that you can use to transform data and add information to your panels.
|
||||
## Panel options
|
||||
|
||||
This topic describes how to:
|
||||
Set the following options to provide basic information about a panel and define basic display elements:
|
||||
|
||||
- Open a panel for editing
|
||||
- Add a panel title and description
|
||||
- View a panel JSON model
|
||||
- Configure repeating rows and panels
|
||||
| Option | Description |
|
||||
| ---------------------- | ------------------------------------------------------------------------------------------------------------------------------------------------------------------------------------------------------------------------------------------------------------------------------------------------------- |
|
||||
| Title | Text entered in this field appears at the top of your panel in the panel editor and in the dashboard. You can use [variables you have defined][] in the **Title** field, but not [global variables][]. |
|
||||
| Description | Text entered in this field appears in a tooltip in the upper-left corner of the panel. Add a description to a panel to share with users any important information about it, such as its purpose. You can use [variables you have defined][] in the **Description** field, but not [global variables][]. |
|
||||
| Transparent background | Toggle this switch on and off to control whether or not the panel has the same background color as the dashboard. |
|
||||
| Panel links | Add [links to the panel][] to create shortcuts to other dashboards, panels, and external websites. Access panel links by clicking the icon next to the panel title. |
|
||||
| Repeat options | Set whether to repeat the panel for each value in the selected variable. For more information, refer to [Configure repeating panels](#configure-repeating-panels). |
|
||||
|
||||
## Edit a panel
|
||||
|
||||
After you add a panel to a dashboard, you can open it at any time to change or update queries, add data transformation, and change visualization settings.
|
||||
|
||||
1. Open the dashboard that contains the panel you want to edit.
|
||||
|
||||
1. Hover over any part of the panel to display the actions menu on the top right corner.
|
||||
|
||||
1. Click the menu and select **Edit**.
|
||||
|
||||

|
||||
|
||||
To use a keyboard shortcut to open the panel, hover over the panel and press `e`.
|
||||
|
||||
The panel opens in edit mode.
|
||||
|
||||
## Add a title and description to a panel
|
||||
|
||||
You can use generative AI to create panel titles and descriptions with the [Grafana LLM plugin][], which is currently in public preview. To enable this, refer to the [Set up generative AI features for dashboards documentation][]. Alternatively, you can take the following steps to create them yourself.
|
||||
|
||||
Add a title and description to a panel to share with users any important information about the visualization. For example, use the description to document the purpose of the visualization.
|
||||
|
||||
1. [Edit a panel](#edit-a-panel).
|
||||
|
||||
1. In the panel display options pane, locate the **Panel options** section.
|
||||
|
||||
1. Enter a **Title**.
|
||||
|
||||
Text entered in this field appears at the top of your panel in the panel editor and in the dashboard.
|
||||
|
||||
1. Write a description of the panel and the data you are displaying.
|
||||
|
||||
Text entered in this field appears in a tooltip in the upper-left corner of the panel.
|
||||
|
||||
You can use [variables you have defined][] in the **Title** and **Description** field, but not [global variables][].
|
||||
|
||||

|
||||
|
||||
## View a panel JSON model
|
||||
|
||||
Explore and export panel, panel data, and data frame JSON models.
|
||||
|
||||
1. Open the dashboard that contains the panel.
|
||||
|
||||
1. Hover over any part of the panel to display the actions menu on the top right corner.
|
||||
1. Click the menu and select **Inspect > Panel JSON**.
|
||||
1. In the **Select source** field, select one of the following options:
|
||||
|
||||
- **Panel JSON:** Displays a JSON object representing the panel.
|
||||
- **Panel data:** Displays a JSON object representing the data that was passed to the panel.
|
||||
- **DataFrame structure:** Displays the data structure of the panel, including any transformations, field configurations, and override configurations that have been applied.
|
||||
|
||||
1. To explore the JSON, click `>` to expand or collapse portions of the JSON model.
|
||||
You can use generative AI to populate the **Title** and **Description** fields with the [Grafana LLM plugin][], which is currently in public preview. To enable this, refer to [Set up generative AI features for dashboards][].
|
||||
|
||||
## Configure repeating panels
|
||||
|
||||
You can configure Grafana to dynamically add panels or rows to a dashboard. A dynamic panel is a panel that the system creates based on the value of a variable. Variables dynamically change your queries across all panels in a dashboard. For more information about repeating rows, refer to [Configure repeating rows][].
|
||||
|
||||
{{% admonition type="note" %}}
|
||||
Repeating panels require variables to have one or more items selected; you can't repeat a panel zero times to hide it.
|
||||
{{% /admonition %}}
|
||||
|
||||
To see an example of repeating panels, refer to [this dashboard with repeating panels](https://play.grafana.org/d/testdata-repeating/testdata-repeating-panels?orgId=1).
|
||||
|
||||
**Before you begin:**
|
||||
|
||||
- Ensure that the query includes a multi-value variable.
|
||||
|
||||
**To configure repeating panels:**
|
||||
To configure repeating panels, follow these steps:
|
||||
|
||||
1. [Edit the panel](#edit-a-panel) you want to repeat.
|
||||
1. Navigate to the panel you want to update.
|
||||
1. Hover over any part of the panel to display the menu on the top right corner.
|
||||
1. Click the menu and select **Edit**.
|
||||
1. Open the **Panel options** section of the panel editor pane.
|
||||
1. Under **Repeat options**, select a variable in the **Repeat by variable** drop-down list.
|
||||
1. Under **Repeat direction**, choose one of the following:
|
||||
|
||||
1. On the display options pane, click **Panel options > Repeat options**.
|
||||
|
||||
1. Select a `direction`.
|
||||
|
||||
- Choose `horizontal` to arrange panels side-by-side. Grafana adjusts the width of a repeated panel. Currently, you can't mix other panels on a row with a repeated panel.
|
||||
- Choose `vertical` to arrange panels in a column. The width of repeated panels is the same as the original, repeated panel.
|
||||
- **Horizontal** - Arrange panels side-by-side. Grafana adjusts the width of a repeated panel. You can't mix other panels on a row with a repeated panel.
|
||||
- **Vertical** - Arrange panels in a column. The width of repeated panels is the same as the original, repeated panel.
|
||||
|
||||
1. If you selected **Horizontal** in the previous step, select a value in the **Max per row** drop-down list to control the maximum number of panels that can be in a row.
|
||||
1. Click **Save**.
|
||||
1. To propagate changes to all panels, reload the dashboard.
|
||||
|
||||
You can stop a panel from repeating by selecting **Disable repeating** in the **Repeat by variable** drop-down list.
|
||||
|
||||
{{% docs/reference %}}
|
||||
[variables you have defined]: "/docs/grafana/ -> /docs/grafana/<GRAFANA VERSION>/dashboards/variables"
|
||||
[variables you have defined]: "/docs/grafana-cloud/ -> /docs/grafana/<GRAFANA VERSION>/dashboards/variables"
|
||||
[variables you have defined]: "/docs/grafana/ -> /docs/grafana/<GRAFANA_VERSION>/dashboards/variables"
|
||||
[variables you have defined]: "/docs/grafana-cloud/ -> /docs/grafana-cloud/visualizations/dashboards/variables"
|
||||
|
||||
[global variables]: "/docs/grafana/ -> /docs/grafana/<GRAFANA VERSION>/dashboards/variables/add-template-variables#global-variables"
|
||||
[global variables]: "/docs/grafana-cloud/ -> /docs/grafana/<GRAFANA VERSION>/dashboards/variables/add-template-variables#global-variables"
|
||||
[global variables]: "/docs/grafana/ -> /docs/grafana/<GRAFANA_VERSION>/dashboards/variables/add-template-variables#global-variables"
|
||||
[global variables]: "/docs/grafana-cloud/ -> /docs/grafana-cloud/visualizations/dashboards/variables/add-template-variables#global-variables"
|
||||
|
||||
[Configure repeating rows]: "/docs/grafana/ -> /docs/grafana/<GRAFANA VERSION>/dashboards/build-dashboards/create-dashboard#configure-repeating-rows"
|
||||
[Configure repeating rows]: "/docs/grafana-cloud/ -> /docs/grafana/<GRAFANA VERSION>/dashboards/build-dashboards/create-dashboard#configure-repeating-rows"
|
||||
[Configure repeating rows]: "/docs/grafana/ -> /docs/grafana/<GRAFANA_VERSION>/dashboards/build-dashboards/create-dashboard#configure-repeating-rows"
|
||||
[Configure repeating rows]: "/docs/grafana-cloud/ -> /docs/grafana-cloud/visualizations/dashboards/build-dashboards/create-dashboard#configure-repeating-rows"
|
||||
|
||||
[Grafana LLM plugin]: "/docs/grafana/ -> /docs/grafana-cloud/alerting-and-irm/machine-learning/llm-plugin"
|
||||
[Grafana LLM plugin]: "/docs/grafana-cloud/ -> /docs/grafana-cloud/alerting-and-irm/machine-learning/llm-plugin"
|
||||
[Grafana LLM plugin]: "/docs/grafana/ -> /docs/grafana-cloud/alerting-and-irm/machine-learning/configure/llm-plugin"
|
||||
[Grafana LLM plugin]: "/docs/grafana-cloud/ -> /docs/grafana-cloud/alerting-and-irm/machine-learning/configure/llm-plugin"
|
||||
|
||||
[Set up generative AI features for dashboards documentation]: "/docs/grafana/ -> /docs/grafana/<GRAFANA VERSION>/dashboards/manage-dashboards#set-up-generative-ai-features-for-dashboards"
|
||||
[Set up generative AI features for dashboards documentation]: "/docs/grafana-cloud/ -> /docs/grafana-cloud/visualizations/dashboards/manage-dashboards#set-up-generative-ai-features-for-dashboards"
|
||||
[Set up generative AI features for dashboards]: "/docs/grafana/ -> /docs/grafana/<GRAFANA_VERSION>/dashboards/manage-dashboards#set-up-generative-ai-features-for-dashboards"
|
||||
[Set up generative AI features for dashboards]: "/docs/grafana-cloud/ -> /docs/grafana-cloud/visualizations/dashboards/manage-dashboards#set-up-generative-ai-features-for-dashboards"
|
||||
|
||||
[links to the panel]: "/docs/grafana/ -> /docs/grafana/<GRAFANA_VERSION>/dashboards/build-dashboards/manage-dashboard-links#panel-links"
|
||||
[links to the panel]: "/docs/grafana-cloud/ -> /docs/grafana-cloud/visualizations/dashboards/build-dashboards/manage-dashboard-links#panel-links"
|
||||
{{% /docs/reference %}}
|
||||
|
||||
@@ -101,7 +101,9 @@ You can disable or hide one or more transformations by clicking on the eye icon
|
||||
|
||||
If your panel uses more than one query, you can filter these and apply the selected transformation to only one of the queries. To do this, click the filter icon on the top right of the transformation row. This opens a drop-down with a list of queries used on the panel. From here, you can select the query you want to transform.
|
||||
|
||||
Note that the filter icon is always displayed if your panel has more than one query, but it may not work if previous transformations for merging the queries' outputs are applied. This is because one transformation takes the output of the previous one.
|
||||
You can also filter by annotations (which includes exemplars) to apply transformations to them. When you do so, the list of fields changes to reflect those in the annotation or exemplar tooltip.
|
||||
|
||||
The filter icon is always displayed if your panel has more than one query or source of data (that is, panel or annotation data) but it may not work if previous transformations for merging the queries’ outputs are applied. This is because one transformation takes the output of the previous one.
|
||||
|
||||
## Delete a transformation
|
||||
|
||||
|
||||
@@ -20,6 +20,8 @@ weight: 10
|
||||
|
||||
Grafana offers a variety of visualizations to support different use cases. This section of the documentation highlights the built-in visualizations, their options and typical usage.
|
||||
|
||||
{{< youtube id="JwF6FgeotaU" >}}
|
||||
|
||||
{{% admonition type="note" %}}
|
||||
If you are unsure which visualization to pick, Grafana can provide visualization suggestions based on the panel query. When you select a visualization, Grafana will show a preview with that visualization applied.
|
||||
{{% /admonition %}}
|
||||
@@ -33,6 +35,7 @@ If you are unsure which visualization to pick, Grafana can provide visualization
|
||||
- [Heatmap][] visualizes data in two dimensions, used typically for the magnitude of a phenomenon.
|
||||
- [Pie chart][] is typically used where proportionality is important.
|
||||
- [Candlestick][] is typically for financial data where the focus is price/data movement.
|
||||
- [Gauge][] is the traditional rounded visual showing how far a single metric is from a threshold.
|
||||
- Stats & numbers
|
||||
- [Stat][] for big stats and optional sparkline.
|
||||
- [Bar gauge][] is a horizontal or vertical bar gauge.
|
||||
@@ -42,12 +45,18 @@ If you are unsure which visualization to pick, Grafana can provide visualization
|
||||
- [Node graph][] for directed graphs or networks.
|
||||
- [Traces][] is the main visualization for traces.
|
||||
- [Flame graph][] is the main visualization for profiling.
|
||||
- [Canvas][] allows you to explicitly place elements within static and dynamic layouts.
|
||||
- [Geomap][] helps you visualize geospatial data.
|
||||
- Widgets
|
||||
- [Dashboard list][] can list dashboards.
|
||||
- [Alert list][] can list alerts.
|
||||
- [Text][] can show markdown and html.
|
||||
- [News][] can show RSS feeds.
|
||||
|
||||
The following video shows you how to create gauge, time series line graph, stats, logs, and node graph visualizations:
|
||||
|
||||
{{< youtube id="yNRnLyVntUw" >}}
|
||||
|
||||
## Get more
|
||||
|
||||
You can add more visualization types by installing panel [panel plugins](https://grafana.com/grafana/plugins/?type=panel).
|
||||
@@ -122,6 +131,12 @@ A state timeline shows discrete state changes over time. When used with time ser
|
||||
[Flame graph]: "/docs/grafana/ -> /docs/grafana/<GRAFANA VERSION>/panels-visualizations/visualizations/flame-graph"
|
||||
[Flame graph]: "/docs/grafana-cloud/ -> /docs/grafana/<GRAFANA VERSION>/panels-visualizations/visualizations/flame-graph"
|
||||
|
||||
[Canvas]: "/docs/grafana/ -> /docs/grafana/<GRAFANA VERSION>/panels-visualizations/visualizations/canvas"
|
||||
[Canvas]: "/docs/grafana-cloud/ -> /docs/grafana/<GRAFANA VERSION>/panels-visualizations/visualizations/canvas"
|
||||
|
||||
[Geomap]: "/docs/grafana/ -> /docs/grafana/<GRAFANA VERSION>/panels-visualizations/visualizations/geomap"
|
||||
[Geomap]: "/docs/grafana-cloud/ -> /docs/grafana/<GRAFANA VERSION>/panels-visualizations/visualizations/geomap"
|
||||
|
||||
[Status history]: "/docs/grafana/ -> /docs/grafana/<GRAFANA VERSION>/panels-visualizations/visualizations/status-history"
|
||||
[Status history]: "/docs/grafana-cloud/ -> /docs/grafana/<GRAFANA VERSION>/panels-visualizations/visualizations/status-history"
|
||||
|
||||
|
||||
@@ -19,9 +19,72 @@ weight: 100
|
||||
|
||||
# State timeline
|
||||
|
||||
State timelines show discrete state changes over time. Each field or series is rendered as its unique horizontal band. State regions can either be rendered with or without values. This visualization works well with string or boolean states but can also be used with time series. When used with time series, the thresholds are used to turn the numerical values into discrete state regions.
|
||||
A state timeline visualization displays data in a way that shows state changes over time. In a state timeline, the data is presented as a series of bars or bands called _state regions_. State regions can be rendered with or without values, and the region length indicates the duration or frequency of a state within a given time range.
|
||||
|
||||
{{< figure src="/static/img/docs/v8/state_timeline_strings.png" max-width="1025px" caption="state timeline with string states" >}}
|
||||
For example, if you're monitoring the CPU usage of a server, you can use a state timeline to visualize the different states, such as “LOW,” “NORMAL,” “HIGH,” or “CRITICAL,” over time. Each state is represented by a different color and the lengths represent the duration of time that the server remained in that state:
|
||||
|
||||
{{< figure src="/static/img/docs/state-timeline-panel/state-timeline-panel.png" max-width="1025px" alt="A state timeline panel showing CPU usage" >}}
|
||||
|
||||
The state timeline visualization is useful when you need to monitor and analyze changes in states or statuses of various entities over time. You can use one when you need to:
|
||||
|
||||
- Monitor the status of a server, application, or service to know when your infrastructure is experiencing issues over time.
|
||||
- Identify operational trends over time.
|
||||
- Spot any recurring issues with the health of your applications.
|
||||
|
||||
## Configure a state timeline
|
||||
|
||||
Once you have [created a dashboard](https://grafana.com/docs/grafana/<GRAFANA_VERSION>/dashboards/build-dashboards/create-dashboard/), the following video shows you how to configure a state timeline:
|
||||
|
||||
{{< youtube id="a9wZHM0mdxo" >}}
|
||||
|
||||
## Supported data formats
|
||||
|
||||
The state timeline panel works best if you have data capturing the various states of entities over time, formatted as a table. The data must include:
|
||||
|
||||
- **Timestamps** - Indicate when each state change occurred. This could also be the start time for the state change. You can also add an optional timestamp to indicate the end time for the state change.
|
||||
- **Entity name/identifier** - Represents the name of the entity you're trying to monitor.
|
||||
- **State value** - Represents the state value of the entity you're monitoring. These can be string, numerical, or boolean states.
|
||||
|
||||
Each state ends when the next state begins or when there is a `null` value.
|
||||
|
||||
### Examples
|
||||
|
||||
The following tables are examples of the type of data you need for a state timeline visualization and how it should be formatted.
|
||||
|
||||
#### Single time column with null values
|
||||
|
||||
| Timestamps | Server A | Server B |
|
||||
| ------------------- | -------- | -------- |
|
||||
| 2024-02-29 8:00:00 | Up | Up |
|
||||
| 2024-02-29 8:15:00 | null | Up |
|
||||
| 2024-02-29 8:30:00 | Down | null |
|
||||
| 2024-02-29 8:45:00 | | Up |
|
||||
| 2024-02-29 9:00:00 | Up | |
|
||||
| 2024-02-29 9:15:00 | Up | Down |
|
||||
| 2024-02-29 9:30:00 | Up | Down |
|
||||
| 2024-02-29 10:00:00 | Down | Down |
|
||||
| 2024-02-29 10:30:00 | Warning | Down |
|
||||
|
||||
The data is converted as follows, with the [null and empty values visualized as gaps](https://grafana.com/docs/grafana/latest/panels-visualizations/visualizations/state-timeline/#connect-null-values) in the state timeline:
|
||||
|
||||
{{< figure src="/static/img/docs/state-timeline-panel/state-timeline-with-null-values.png" max-width="1025px" alt="A state timeline panel with null values showing the status of two servers" >}}
|
||||
|
||||
#### Two time columns without null values
|
||||
|
||||
| Start time | End time | Server A | Server B |
|
||||
| ------------------- | ------------------- | -------- | -------- |
|
||||
| 2024-02-29 8:00:00 | 2024-02-29 8:15:00 | Up | Up |
|
||||
| 2024-02-29 8:15:00 | 2024-02-29 8:30:00 | Up | Up |
|
||||
| 2024-02-29 8:45:00 | 2024-02-29 9:00:00 | Down | Up |
|
||||
| 2024-02-29 9:00:00 | 2024-02-29 9:15:00 | Down | Up |
|
||||
| 2024-02-29 9:30:00 | 2024-02-29 10:00:00 | Down | Down |
|
||||
| 2024-02-29 10:00:00 | 2024-02-29 10:30:00 | Warning | Down |
|
||||
|
||||
The data is converted as follows:
|
||||
|
||||
{{< figure src="/static/img/docs/state-timeline-panel/state-timeline-with-two-timestamps.png" max-width="1025px" alt="A state timeline panel with two time columns showing the status of two servers" >}}
|
||||
|
||||
If your query results aren't in a table format like the preceding examples, especially for time-series data, you can apply specific [transformations](https://stackoverflow.com/questions/68887416/grafana-state-timeline-panel-with-values-states-supplied-by-label) to achieve this.
|
||||
|
||||
## State timeline options
|
||||
|
||||
|
||||
@@ -31,6 +31,10 @@ Tables are very flexible, supporting multiple modes for time series and for tabl
|
||||
|
||||
{{< figure src="/static/img/docs/tables/table_visualization.png" max-width="1200px" lightbox="true" caption="Table visualization" >}}
|
||||
|
||||
The following video provides a visual walkthrough of the options you can set in a table visualization. If you want to see a configuration in action, check out the video:
|
||||
|
||||
{{< youtube id="PCY7O8EJeJY" >}}
|
||||
|
||||
## Annotation and alert support
|
||||
|
||||
Annotations and alerts are not currently supported in tables.
|
||||
|
||||
@@ -23,7 +23,7 @@ After you add custom options, [uncomment](#remove-comments-in-the-ini-files) the
|
||||
|
||||
The default settings for a Grafana instance are stored in the `$WORKING_DIR/conf/defaults.ini` file. _Do not_ change this file.
|
||||
|
||||
Depending on your OS, your custom configuration file is either the `$WORKING_DIR/conf/defaults.ini` file or the `/usr/local/etc/grafana/grafana.ini` file. The custom configuration file path can be overridden using the `--config` parameter.
|
||||
Depending on your OS, your custom configuration file is either the `$WORKING_DIR/conf/custom.ini` file or the `/usr/local/etc/grafana/grafana.ini` file. The custom configuration file path can be overridden using the `--config` parameter.
|
||||
|
||||
### Linux
|
||||
|
||||
@@ -388,6 +388,10 @@ Set to `true` to log the sql calls and execution times.
|
||||
For Postgres, use use any [valid libpq `sslmode`](https://www.postgresql.org/docs/current/libpq-ssl.html#LIBPQ-SSL-SSLMODE-STATEMENTS), e.g.`disable`, `require`, `verify-full`, etc.
|
||||
For MySQL, use either `true`, `false`, or `skip-verify`.
|
||||
|
||||
### ssl_sni
|
||||
|
||||
For Postgres, set to `0` to disable [Server Name Indication](https://www.postgresql.org/docs/current/libpq-connect.html#LIBPQ-CONNECT-SSLSNI). This is enabled by default on SSL-enabled connections.
|
||||
|
||||
### isolation_level
|
||||
|
||||
Only the MySQL driver supports isolation levels in Grafana. In case the value is empty, the driver's default isolation level is applied. Available options are "READ-UNCOMMITTED", "READ-COMMITTED", "REPEATABLE-READ" or "SERIALIZABLE".
|
||||
@@ -2176,7 +2180,11 @@ Set to `true` if you want to test alpha panels that are not yet ready for genera
|
||||
|
||||
### disable_sanitize_html
|
||||
|
||||
If set to true Grafana will allow script tags in text panels. Not recommended as it enables XSS vulnerabilities. Default is false. This setting was introduced in Grafana v6.0.
|
||||
{{% admonition type="note" %}}
|
||||
This configuration is not available in Grafana Cloud instances.
|
||||
{{% /admonition %}}
|
||||
|
||||
If set to true Grafana will allow script tags in text panels. Not recommended as it enables XSS vulnerabilities. Default is false.
|
||||
|
||||
## [plugins]
|
||||
|
||||
|
||||
@@ -30,11 +30,11 @@ The enhanced LDAP integration adds additional functionality on top of the [LDAP
|
||||
|
||||
## LDAP group synchronization for teams
|
||||
|
||||
{{< figure src="/static/img/docs/enterprise/team_members_ldap.png" class="docs-image--no-shadow docs-image--right" max-width= "600px" >}}
|
||||
|
||||
With enhanced LDAP integration, you can set up synchronization between LDAP groups and teams. This enables LDAP users that are members
|
||||
of certain LDAP groups to automatically be added or removed as members to certain teams in Grafana.
|
||||
|
||||

|
||||
|
||||
Grafana keeps track of all synchronized users in teams, and you can see which users have been synchronized from LDAP in the team members list, see `LDAP` label in screenshot.
|
||||
This mechanism allows Grafana to remove an existing synchronized user from a team when its LDAP group membership changes. This mechanism also allows you to manually add
|
||||
a user as member of a team, and it will not be removed when the user signs in. This gives you flexibility to combine LDAP group memberships and Grafana team memberships.
|
||||
|
||||
@@ -111,6 +111,14 @@ automatically signed up.
|
||||
You may specify a domain to be passed as `hd` query parameter accepted by Google's
|
||||
OAuth 2.0 authentication API. Refer to Google's OAuth [documentation](https://developers.google.com/identity/openid-connect/openid-connect#hd-param).
|
||||
|
||||
{{% admonition type="note" %}}
|
||||
The `hd` parameter retrieved from Google ID token is also used to determine the user's hosted domain. The Google Oauth `allowed_domains` configuration option is used to restrict access to users from a specific domain. If the `allowed_domains` configuration option is set, the `hd` parameter from the Google ID token must match the `allowed_domains` configuration option. If the `hd` parameter from the Google ID token does not match the `allowed_domains` configuration option, the user is denied access.
|
||||
|
||||
When an account does not belong to a Google Workspace, the `hd` claim is not be available.
|
||||
|
||||
This validation will be enabled by default with Grafana 11.0. To disable this validation, set the `validate_hd` configuration option to `false`. The `allowed_domains` configuration option will use the email claim to validate the domain.
|
||||
{{% /admonition %}}
|
||||
|
||||
#### PKCE
|
||||
|
||||
IETF's [RFC 7636](https://datatracker.ietf.org/doc/html/rfc7636)
|
||||
|
||||
@@ -60,6 +60,25 @@ api_key_max_seconds_to_live = -1
|
||||
|
||||
You can make Grafana accessible without any login required by enabling anonymous access in the configuration file. For more information, refer to [Anonymous authentication]({{< relref "../../configure-authentication#anonymous-authentication" >}}).
|
||||
|
||||
#### Anonymous devices
|
||||
|
||||
The anonymous devices feature enhances the management and monitoring of anonymous access within your Grafana instance. This feature is part of ongoing efforts to provide more control and transparency over anonymous usage.
|
||||
|
||||
Users can now view anonymous usage statistics, including the count of devices and users over the last 30 days.
|
||||
|
||||
- Go to **Administration -> Users** to access the anonymous devices tab.
|
||||
- A new stat for the usage stats page -> Usage & Stats page shows the active anonymous devices last 30 days.
|
||||
|
||||
The number of anonymous devices is not limited by default. The configuration option `device_limit` allows you to enforce a limit on the number of anonymous devices. This enables you to have greater control over the usage within your Grafana instance and keep the usage within the limits of your environment. Once the limit is reached, any new devices that try to access Grafana will be denied access.
|
||||
|
||||
#### Anonymous users
|
||||
|
||||
{{< admonition type="note" >}}
|
||||
Anonymous users are charged as active users in Grafana Enterprise
|
||||
{{< /admonition >}}
|
||||
|
||||
#### Configuration
|
||||
|
||||
Example:
|
||||
|
||||
```bash
|
||||
@@ -81,17 +100,6 @@ device_limit =
|
||||
|
||||
If you change your organization name in the Grafana UI this setting needs to be updated to match the new name.
|
||||
|
||||
#### Anonymous devices
|
||||
|
||||
The anonymous devices feature enhances the management and monitoring of anonymous access within your Grafana instance. This feature is part of ongoing efforts to provide more control and transparency over anonymous usage.
|
||||
|
||||
Users can now view anonymous usage statistics, including the count of devices and users over the last 30 days.
|
||||
|
||||
- Go to **Administration -> Users** to access the anonymous devices tab.
|
||||
- A new stat for the usage stats page -> Usage & Stats page shows the active anonymous devices last 30 days.
|
||||
|
||||
The number of anonymous devices is not limited by default. The configuration option `device_limit` allows you to enforce a limit on the number of anonymous devices. This enables you to have greater control over the usage within your Grafana instance and keep the usage within the limits of your environment. Once the limit is reached, any new devices that try to access Grafana will be denied access.
|
||||
|
||||
### Basic authentication
|
||||
|
||||
Basic auth is enabled by default and works with the built in Grafana user password authentication system and LDAP
|
||||
|
||||
@@ -151,19 +151,19 @@ Grafana has an LDAP debug view built-in which allows you to test your LDAP confi
|
||||
|
||||
Within this view, you'll be able to see which LDAP servers are currently reachable and test your current configuration.
|
||||
|
||||
{{< figure src="/static/img/docs/ldap_debug.png" class="docs-image--no-shadow" max-width="600px" >}}
|
||||
{{< figure src="/static/img/docs/ldap_debug.png" class="docs-image--no-shadow" max-width="600px" alt="LDAP testing" >}}
|
||||
|
||||
To use the debug view, complete the following steps:
|
||||
|
||||
1. Type the username of a user that exists within any of your LDAP server(s)
|
||||
1. Then, press "Run"
|
||||
1. If the user is found within any of your LDAP instances, the mapping information is displayed
|
||||
1. If the user is found within any of your LDAP instances, the mapping information is displayed.
|
||||
|
||||
{{< figure src="/static/img/docs/ldap_debug_mapping_testing.png" class="docs-image--no-shadow" max-width="600px" >}}
|
||||
{{< figure src="/static/img/docs/ldap_debug_mapping_testing.png" class="docs-image--no-shadow" max-width="600px" alt="LDAP mapping displayed" >}}
|
||||
|
||||
[Grafana Enterprise]({{< relref "../../../../introduction/grafana-enterprise" >}}) users with [enhanced LDAP integration]({{< relref "../enhanced-ldap" >}}) enabled can also see sync status in the debug view. This requires the `ldap.status:read` permission.
|
||||
|
||||
{{< figure src="/static/img/docs/ldap_sync_debug.png" class="docs-image--no-shadow" max-width="600px" >}}
|
||||
{{< figure src="/static/img/docs/ldap_sync_debug.png" class="docs-image--no-shadow" max-width="600px" alt="LDAP sync status" >}}
|
||||
|
||||
### Bind and bind password
|
||||
|
||||
|
||||
@@ -8,7 +8,6 @@ labels:
|
||||
products:
|
||||
- cloud
|
||||
- enterprise
|
||||
- oss
|
||||
title: Configure request security
|
||||
weight: 1100
|
||||
---
|
||||
|
||||
@@ -40,11 +40,12 @@ This mechanism allows Grafana to remove an existing synchronized user from a tea
|
||||
|
||||
If you have already grouped some users into a team, then you can synchronize that team with an external group.
|
||||
|
||||
{{< figure src="/static/img/docs/enterprise/team_add_external_group.png" class="docs-image--no-shadow docs-image--right" max-width= "600px" >}}
|
||||
|
||||
1. In Grafana, navigate to **Administration > Users and access > Teams**.
|
||||
1. Select a team.
|
||||
1. Go to the External group sync tab, and click **Add group**.
|
||||
|
||||

|
||||
|
||||
1. Insert the value of the group you want to sync with. This becomes the Grafana `GroupID`.
|
||||
Examples:
|
||||
|
||||
|
||||
381
docs/sources/setup-grafana/installation/helm/index.md
Normal file
381
docs/sources/setup-grafana/installation/helm/index.md
Normal file
@@ -0,0 +1,381 @@
|
||||
---
|
||||
aliases:
|
||||
- ../../installation/helm/
|
||||
description: Guide for deploying Grafana using Helm Charts
|
||||
labels:
|
||||
products:
|
||||
- enterprise
|
||||
- oss
|
||||
menuTitle: Grafana on Helm Charts
|
||||
title: Deploy Grafana using Helm Charts
|
||||
weight: 500
|
||||
---
|
||||
|
||||
# Deploy Grafana using Helm Charts
|
||||
|
||||
This topic includes instructions for installing and running Grafana on Kubernetes using Helm Charts.
|
||||
|
||||
[Helm](https://helm.sh/) is an open-source command line tool used for managing Kubernetes applications. It is a graduate project in the [CNCF Landscape](https://www.cncf.io/projects/helm/).
|
||||
|
||||
{{% admonition type="note" %}}
|
||||
The Grafana open-source community offers Helm Charts for running it on Kubernetes. Please be aware that the code is provided without any warranties. If you encounter any problems, you can report them to the [Official GitHub repository](https://github.com/grafana/helm-charts/).
|
||||
{{% /admonition %}}
|
||||
|
||||
## Before you begin
|
||||
|
||||
To install Grafana using Helm, ensure you have completed the following:
|
||||
|
||||
- Install a Kubernetes server on your machine. For information about installing Kubernetes, refer to [Install Kubernetes](https://kubernetes.io/docs/setup/).
|
||||
- Install the latest stable version of Helm. For information on installing Helm, refer to [Install Helm](https://helm.sh/docs/intro/install/).
|
||||
|
||||
## Install Grafana using Helm
|
||||
|
||||
When you install Grafana using Helm, you complete the following tasks:
|
||||
|
||||
1. Set up the Grafana Helm repository, which provides a space in which you will install Grafana.
|
||||
|
||||
1. Deploy Grafana using Helm, which installs Grafana into a namespace.
|
||||
|
||||
1. Accessing Grafana, which provides steps to sign into Grafana.
|
||||
|
||||
### Set up the Grafana Helm repository
|
||||
|
||||
To set up the Grafana Helm repository so that you download the correct Grafana Helm charts on your machine, complete the following steps:
|
||||
|
||||
1. To add the Grafana repository, use the following command syntax:
|
||||
|
||||
`helm repo add <DESIRED-NAME> <HELM-REPO-URL>`
|
||||
|
||||
The following example adds the `grafana` Helm repository.
|
||||
|
||||
```bash
|
||||
helm repo add grafana https://grafana.github.io/helm-charts
|
||||
```
|
||||
|
||||
1. Run the following command to verify the repository was added:
|
||||
|
||||
```bash
|
||||
helm repo list
|
||||
```
|
||||
|
||||
After you add the repository, you should see an output similar to the following:
|
||||
|
||||
```bash
|
||||
NAME URL
|
||||
grafana https://grafana.github.io/helm-charts
|
||||
```
|
||||
|
||||
1. Run the following command to update the repository to download the latest Grafana Helm charts:
|
||||
|
||||
```bash
|
||||
helm repo update
|
||||
```
|
||||
|
||||
### Deploy the Grafana Helm charts
|
||||
|
||||
After you have set up the Grafana Helm repository, you can start to deploy it on your Kubernetes cluster.
|
||||
|
||||
When you deploy Grafana Helm charts, use a separate namespace instead of relying on the default namespace. The default namespace might already have other applications running, which can lead to conflicts and other potential issues.
|
||||
|
||||
When you create a new namespace in Kubernetes, you can better organize, allocate, and manage cluster resources. For more information, refer to [Namespaces](https://kubernetes.io/docs/concepts/overview/working-with-objects/namespaces/).
|
||||
|
||||
1. To create a namespace, run the following command:
|
||||
|
||||
```bash
|
||||
kubectl create namespace monitoring
|
||||
```
|
||||
|
||||
You will see an output similar to this, which means that the namespace has been successfully created:
|
||||
|
||||
```bash
|
||||
namespace/monitoring created
|
||||
```
|
||||
|
||||
1. Search for the official `grafana/grafana` repository using the command:
|
||||
|
||||
`helm search repo <repo-name/package-name>`
|
||||
|
||||
For example, the following command provides a list of the Grafana Helm Charts from which you will install the latest version of the Grafana chart.
|
||||
|
||||
```bash
|
||||
helm search repo grafana/grafana
|
||||
```
|
||||
|
||||
1. Run the following command to deploy the Grafana Helm Chart inside your namespace.
|
||||
|
||||
```bash
|
||||
helm install my-grafana grafana/grafana --namespace monitoring
|
||||
```
|
||||
|
||||
Where:
|
||||
|
||||
- `helm install`: Installs the chart by deploying it on the Kubernetes cluster
|
||||
- `my-grafana`: The logical chart name that you provided
|
||||
- `grafana/grafana`: The repository and package name to install
|
||||
- `--namespace`: The Kubernetes namespace (i.e. `monitoring`) where you want to deploy the chart
|
||||
|
||||
1. To verify the deployment status, run the following command and verify that `deployed` appears in the **STATUS** column:
|
||||
|
||||
```bash
|
||||
helm list -n monitoring
|
||||
```
|
||||
|
||||
You should see an output similar to the following:
|
||||
|
||||
```bash
|
||||
NAME NAMESPACE REVISION UPDATED STATUS CHART APP VERSION
|
||||
my-grafana monitoring 1 2024-01-13 23:06:42.737989554 +0000 UTC deployed grafana-6.59.0 10.1.0
|
||||
```
|
||||
|
||||
1. To check the overall status of all the objects in the namespace, run the following command:
|
||||
|
||||
```bash
|
||||
kubectl get all -n monitoring
|
||||
```
|
||||
|
||||
If you encounter errors or warnings in the **STATUS** column, check the logs and refer to the Troubleshooting section of this documentation.
|
||||
|
||||
### Access Grafana
|
||||
|
||||
This section describes the steps you must complete to access Grafana via web browser.
|
||||
|
||||
1. Run the following `helm get notes` command:
|
||||
|
||||
```bash
|
||||
helm get notes my-grafana -n monitoring
|
||||
```
|
||||
|
||||
This command will print out the chart notes. You will the output `NOTES` that provide the complete instructions about:
|
||||
|
||||
- How to decode the login password for the Grafana admin account
|
||||
- Access Grafana service to the web browser
|
||||
|
||||
1. To get the Grafana admin password, run the command as follows:
|
||||
|
||||
```bash
|
||||
kubectl get secret --namespace monitoring my-grafana -o jsonpath="{.data.admin-password}" | base64 --decode ; echo
|
||||
```
|
||||
|
||||
It will give you a decoded `base64` string output which is the password for the admin account.
|
||||
|
||||
1. Save the decoded password to a file on your machine.
|
||||
|
||||
1. To access Grafana service on the web browser, run the following command:
|
||||
|
||||
```bash
|
||||
export POD_NAME=$(kubectl get pods --namespace monitoring -l "app.kubernetes.io/name=grafana,app.kubernetes.io/instance=my-grafana" -o jsonpath="{.items[0].metadata.name}")
|
||||
```
|
||||
|
||||
The above command will export a shell variable named `POD_NAME` that will save the complete name of the pod which got deployed.
|
||||
|
||||
1. Run the following port forwarding command to direct the Grafana pod to listen to port `3000`:
|
||||
|
||||
```bash
|
||||
kubectl --namespace monitoring port-forward $POD_NAME 3000
|
||||
```
|
||||
|
||||
For more information about port-forwarding, refer to [Use Port Forwarding to Access Applications in a Cluster](https://kubernetes.io/docs/tasks/access-application-cluster/port-forward-access-application-cluster/).
|
||||
|
||||
1. Navigate to `127.0.0.1:3000` in your browser.
|
||||
|
||||
1. The Grafana sign-in page appears.
|
||||
|
||||
1. To sign in, enter `admin` for the username.
|
||||
|
||||
1. For the password paste it which you have saved to a file after decoding it earlier.
|
||||
|
||||
## Customize Grafana default configuration
|
||||
|
||||
Helm is a popular package manager for Kubernetes. It bundles Kubernetes resource manifests to be re-used across different environments. These manifests are written in a templating language, allowing you to provide configuration values via `values.yaml` file, or in-line using Helm, to replace the placeholders in the manifest where these configurations should reside.
|
||||
|
||||
The `values.yaml` file allows you to customize the chart's configuration by specifying values for various parameters such as image versions, resource limits, service configurations, etc.
|
||||
|
||||
By modifying the values in the `values.yaml` file, you can tailor the deployment of a Helm chart to your specific requirements by using the helm install or upgrade commands. For more information about configuring Helm, refer to [Values Files](https://helm.sh/docs/chart_template_guide/values_files/).
|
||||
|
||||
### Download the values.yaml file
|
||||
|
||||
In order to make any configuration changes, download the `values.yaml` file from the Grafana Helm Charts repository:
|
||||
|
||||
https://github.com/grafana/helm-charts/edit/main/charts/grafana/values.yaml
|
||||
|
||||
{{% admonition type="note" %}}
|
||||
Depending on your use case requirements, you can use a single YAML file that contains your configuration changes or you can create multiple YAML files.
|
||||
{{% /admonition %}}
|
||||
|
||||
### Enable persistent storage **(recommended)**
|
||||
|
||||
By default, persistent storage is disabled, which means that Grafana uses ephemeral storage, and all data will be stored within the container's file system. This data will be lost if the container is stopped, restarted, or if the container crashes.
|
||||
|
||||
It is highly recommended that you enable persistent storage in Grafana Helm charts if you want to ensure that your data persists and is not lost in case of container restarts or failures.
|
||||
|
||||
Enabling persistent storage in Grafana Helm charts ensures a reliable solution for running Grafana in production environments.
|
||||
|
||||
To enable the persistent storage in the Grafana Helm charts, complete the following steps:
|
||||
|
||||
1. Open the `values.yaml` file in your favorite editor.
|
||||
|
||||
1. Edit the values and under the section of `persistence`, change the `enable` flag from `false` to `true`
|
||||
|
||||
```yaml
|
||||
.......
|
||||
............
|
||||
......
|
||||
persistence:
|
||||
type: pvc
|
||||
enabled: true
|
||||
# storageClassName: default
|
||||
.......
|
||||
............
|
||||
......
|
||||
```
|
||||
|
||||
1. Run the following `helm upgrade` command by specifying the `values.yaml` file to make the changes take effect:
|
||||
|
||||
```bash
|
||||
helm upgrade my-grafana grafana/grafana -f values.yaml -n monitoring
|
||||
```
|
||||
|
||||
The PVC will now store all your data such as dashboards, data sources, and so on.
|
||||
|
||||
### Install plugins (e.g. Zabbix app, Clock panel, etc.)
|
||||
|
||||
You can install plugins in Grafana from the official and community [plugins page](https://grafana.com/grafana/plugins). These plugins allow you to add new visualization types, data sources, and applications to help you better visualize your data.
|
||||
|
||||
Grafana currently supports three types of plugins: panel, data source, and app. For more information on managing plugins, refer to [Plugin Management](https://grafana.com/docs/grafana/latest/administration/plugin-management/).
|
||||
|
||||
To install plugins in the Grafana Helm Charts, complete the following steps:
|
||||
|
||||
1. Open the `values.yaml` file in your favorite editor.
|
||||
|
||||
1. Find the line that says `plugins:` and under that section, define the plugins that you want to install.
|
||||
|
||||
```yaml
|
||||
.......
|
||||
............
|
||||
......
|
||||
plugins:
|
||||
# here we are installing two plugins, make sure to keep the indentation correct as written here.
|
||||
|
||||
- alexanderzobnin-zabbix-app
|
||||
- grafana-clock-panel
|
||||
.......
|
||||
............
|
||||
......
|
||||
```
|
||||
|
||||
1. Save the changes and use the `helm upgrade` command to get these plugins installed:
|
||||
|
||||
```bash
|
||||
helm upgrade my-grafana grafana/grafana -f values.yaml -n monitoring
|
||||
```
|
||||
|
||||
1. Navigate to `127.0.0.1:3000` in your browser.
|
||||
|
||||
1. Login with admin credentials when the Grafana sign-in page appears.
|
||||
|
||||
1. Navigate to UI -> Administration -> Plugins
|
||||
|
||||
1. Search for the above plugins and they should be marked as installed.
|
||||
|
||||
## Troubleshooting
|
||||
|
||||
This section includes troubleshooting tips you might find helpful when deploying Grafana on Kubernetes via Helm.
|
||||
|
||||
### Collect logs
|
||||
|
||||
It is important to view the Grafana server logs while troubleshooting any issues.
|
||||
|
||||
To check the Grafana logs, run the following command:
|
||||
|
||||
```bash
|
||||
# dump Pod logs for a Deployment (single-container case)
|
||||
|
||||
kubectl logs --namespace=monitoring deploy/my-grafana
|
||||
```
|
||||
|
||||
If you have multiple containers running in the deployment, run the following command to obtain the logs only for the Grafana deployment:
|
||||
|
||||
```bash
|
||||
# dump Pod logs for a Deployment (multi-container case)
|
||||
|
||||
kubectl logs --namespace=monitoring deploy/grafana -c my-grafana
|
||||
```
|
||||
|
||||
For more information about accessing Kubernetes application logs, refer to [Pods](https://kubernetes.io/docs/reference/kubectl/cheatsheet/#interacting-with-running-pods) and [Deployments](https://kubernetes.io/docs/reference/kubectl/cheatsheet/#interacting-with-deployments-and-services).
|
||||
|
||||
### Increase log levels
|
||||
|
||||
By default, the Grafana log level is set to `info`, but you can increase it to `debug` mode to fetch information needed to diagnose and troubleshoot a problem. For more information about Grafana log levels, refer to [Configuring logs](https://grafana.com/docs/grafana/latest/setup-grafana/configure-grafana#log).
|
||||
|
||||
To increase log level to `debug` mode, use the following steps:
|
||||
|
||||
1. Open the `values.yaml` file in your favorite editor and search for the string `grafana.ini` and there you will find a section about log mode.
|
||||
|
||||
1. Add level: `debug` just below the line `mode: console`
|
||||
|
||||
```yaml
|
||||
# This is the values.yaml file
|
||||
.....
|
||||
.......
|
||||
....
|
||||
grafana.ini:
|
||||
paths:
|
||||
data: /var/lib/grafana/
|
||||
.....
|
||||
.......
|
||||
....
|
||||
mode: console
|
||||
level: debug
|
||||
```
|
||||
|
||||
Make sure to keep the indentation level the same otherwise it will not work.
|
||||
|
||||
1. Now to apply this, run the `helm upgrade` command as follows:
|
||||
|
||||
```bash
|
||||
helm upgrade my-grafana grafana/grafana -f values.yaml -n monitoring
|
||||
```
|
||||
|
||||
1. To verify it, access the Grafana UI in the browser using the provided `IP:Port`. The Grafana sign-in page appears.
|
||||
|
||||
1. To sign in to Grafana, enter `admin` for the username and paste the password which was decoded earlier. Navigate to Server Admin > Settings and then search for log. You should see the level to `debug` mode.
|
||||
|
||||
### Reset Grafana admin secrets (login credentials)
|
||||
|
||||
By default the login credentials for the super admin account are generated via `secrets`. However, this can be changed easily. To achieve this, use the following steps:
|
||||
|
||||
1. Edit the `values.yaml` file and search for the string `adminPassword`. There you can define a new password:
|
||||
|
||||
```yaml
|
||||
# Administrator credentials when not using an existing secret (see below)
|
||||
adminUser: admin
|
||||
adminPassword: admin
|
||||
```
|
||||
|
||||
1. Then use the `helm upgrade` command as follows:
|
||||
|
||||
```bash
|
||||
helm upgrade my-grafana grafana/grafana -f values.yaml -n monitoring
|
||||
```
|
||||
|
||||
This command will now make your super admin login credentials as `admin` for both username and password.
|
||||
|
||||
1. To verify it, sign in to Grafana, enter `admin` for both username and password. You should be able to login as super admin.
|
||||
|
||||
## Uninstall the Grafana deployment
|
||||
|
||||
To uninstall the Grafana deployment, run the command:
|
||||
|
||||
`helm uninstall <RELEASE-NAME> <NAMESPACE-NAME>`
|
||||
|
||||
```bash
|
||||
helm uninstall my-grafana -n monitoring
|
||||
```
|
||||
|
||||
This deletes all of the objects from the given namespace monitoring.
|
||||
|
||||
If you want to delete the namespace `monitoring`, then run the command:
|
||||
|
||||
```bash
|
||||
kubectl delete namespace monitoring
|
||||
```
|
||||
@@ -36,14 +36,14 @@ For managing resources related to [data source-managed alerts]({{< relref "/docs
|
||||
| ------ | ---------------------------------------------------------------- | ----------------------------------------------------------------------- | --------------------------------------------------------------------- |
|
||||
| DELETE | /api/v1/provisioning/alert-rules/:uid | [route delete alert rule](#route-delete-alert-rule) | Delete a specific alert rule by UID. |
|
||||
| GET | /api/v1/provisioning/alert-rules/:uid | [route get alert rule](#route-get-alert-rule) | Get a specific alert rule by UID. |
|
||||
| POST | /api/v1/provisioning/alert-rules | [route post alert rule](#route-post-alert-rule) | Create a new alert rule. |
|
||||
| PUT | /api/v1/provisioning/alert-rules/:uid | [route put alert rule](#route-put-alert-rule) | Update an existing alert rule. |
|
||||
| GET | /api/v1/provisioning/alert-rules/:uid/export | [route get alert rule export](#route-get-alert-rule-export) | Export an alert rule in provisioning file format. |
|
||||
| GET | /api/v1/provisioning/folder/:folderUid/rule-groups/:group | [route get alert rule group](#route-get-alert-rule-group) | Get a rule group. |
|
||||
| PUT | /api/v1/provisioning/folder/:folderUid/rule-groups/:group | [route put alert rule group](#route-put-alert-rule-group) | Update the interval of a rule group or modify the rules of the group. |
|
||||
| GET | /api/v1/provisioning/folder/:folderUid/rule-groups/:group/export | [route get alert rule group export](#route-get-alert-rule-group-export) | Export an alert rule group in provisioning file format. |
|
||||
| GET | /api/v1/provisioning/alert-rules | [route get alert rules](#route-get-alert-rules) | Get all the alert rules. |
|
||||
| GET | /api/v1/provisioning/alert-rules/export | [route get alert rules export](#route-get-alert-rules-export) | Export all alert rules in provisioning file format. |
|
||||
| POST | /api/v1/provisioning/alert-rules | [route post alert rule](#route-post-alert-rule) | Create a new alert rule. |
|
||||
| PUT | /api/v1/provisioning/alert-rules/:uid | [route put alert rule](#route-put-alert-rule) | Update an existing alert rule. |
|
||||
| PUT | /api/v1/provisioning/folder/:folderUid/rule-groups/:group | [route put alert rule group](#route-put-alert-rule-group) | Update the interval of a rule group or modify the rules of the group. |
|
||||
|
||||
#### Example alert rules template
|
||||
|
||||
@@ -130,9 +130,9 @@ For managing resources related to [data source-managed alerts]({{< relref "/docs
|
||||
| ------ | ------------------------------------------ | ----------------------------------------------------------------- | ------------------------------------------------------ |
|
||||
| DELETE | /api/v1/provisioning/contact-points/:uid | [route delete contactpoints](#route-delete-contactpoints) | Delete a contact point. |
|
||||
| GET | /api/v1/provisioning/contact-points | [route get contactpoints](#route-get-contactpoints) | Get all the contact points. |
|
||||
| GET | /api/v1/provisioning/contact-points/export | [route get contactpoints export](#route-get-contactpoints-export) | Export all contact points in provisioning file format. |
|
||||
| POST | /api/v1/provisioning/contact-points | [route post contactpoints](#route-post-contactpoints) | Create a contact point. |
|
||||
| PUT | /api/v1/provisioning/contact-points/:uid | [route put contactpoint](#route-put-contactpoint) | Update an existing contact point. |
|
||||
| GET | /api/v1/provisioning/contact-points/export | [route get contactpoints export](#route-get-contactpoints-export) | Export all contact points in provisioning file format. |
|
||||
|
||||
### Notification policies
|
||||
|
||||
@@ -140,27 +140,29 @@ For managing resources related to [data source-managed alerts]({{< relref "/docs
|
||||
| ------ | ------------------------------------ | ------------------------------------------------------------- | ---------------------------------------------------------------- |
|
||||
| DELETE | /api/v1/provisioning/policies | [route reset policy tree](#route-reset-policy-tree) | Clears the notification policy tree. |
|
||||
| GET | /api/v1/provisioning/policies | [route get policy tree](#route-get-policy-tree) | Get the notification policy tree. |
|
||||
| GET | /api/v1/provisioning/policies/export | [route get policy tree export](#route-get-policy-tree-export) | Export the notification policy tree in provisioning file format. |
|
||||
| PUT | /api/v1/provisioning/policies | [route put policy tree](#route-put-policy-tree) | Sets the notification policy tree. |
|
||||
| GET | /api/v1/provisioning/policies/export | [route get policy tree export](#route-get-policy-tree-export) | Export the notification policy tree in provisioning file format. |
|
||||
|
||||
### Mute timings
|
||||
|
||||
| Method | URI | Name | Summary |
|
||||
| ------ | --------------------------------------- | ----------------------------------------------------- | -------------------------------- |
|
||||
| DELETE | /api/v1/provisioning/mute-timings/:name | [route delete mute timing](#route-delete-mute-timing) | Delete a mute timing. |
|
||||
| GET | /api/v1/provisioning/mute-timings/:name | [route get mute timing](#route-get-mute-timing) | Get a mute timing. |
|
||||
| GET | /api/v1/provisioning/mute-timings | [route get mute timings](#route-get-mute-timings) | Get all the mute timings. |
|
||||
| POST | /api/v1/provisioning/mute-timings | [route post mute timing](#route-post-mute-timing) | Create a new mute timing. |
|
||||
| PUT | /api/v1/provisioning/mute-timings/:name | [route put mute timing](#route-put-mute-timing) | Replace an existing mute timing. |
|
||||
| Method | URI | Name | Summary |
|
||||
| ------ | ---------------------------------------------- | --------------------------------------------------------------- | ---------------------------------------------------- |
|
||||
| DELETE | /api/v1/provisioning/mute-timings/:name | [route delete mute timing](#route-delete-mute-timing) | Delete a mute timing. |
|
||||
| GET | /api/v1/provisioning/mute-timings/:name | [route get mute timing](#route-get-mute-timing) | Get a mute timing. |
|
||||
| GET | /api/v1/provisioning/mute-timings | [route get mute timings](#route-get-mute-timings) | Get all the mute timings. |
|
||||
| POST | /api/v1/provisioning/mute-timings | [route post mute timing](#route-post-mute-timing) | Create a new mute timing. |
|
||||
| PUT | /api/v1/provisioning/mute-timings/:name | [route put mute timing](#route-put-mute-timing) | Replace an existing mute timing. |
|
||||
| GET | /api/v1/provisioning/mute-timings/export | [route get mute timings export](#route-get-mute-timings-export) | Export all mute timings in provisioning file format. |
|
||||
| GET | /api/v1/provisioning/mute-timings/:name/export | [route get mute timing export](#route-get-mute-timing-export) | Export a mute timing in provisioning file format. |
|
||||
|
||||
### Templates
|
||||
|
||||
| Method | URI | Name | Summary |
|
||||
| ------ | ------------------------------------ | ----------------------------------------------- | ------------------------------------------ |
|
||||
| DELETE | /api/v1/provisioning/templates/:name | [route delete template](#route-delete-template) | Delete a template. |
|
||||
| GET | /api/v1/provisioning/templates/:name | [route get template](#route-get-template) | Get a notification template. |
|
||||
| GET | /api/v1/provisioning/templates | [route get templates](#route-get-templates) | Get all notification templates. |
|
||||
| PUT | /api/v1/provisioning/templates/:name | [route put template](#route-put-template) | Updates an existing notification template. |
|
||||
| Method | URI | Name | Summary |
|
||||
| ------ | ------------------------------------ | ----------------------------------------------- | ----------------------------------------- |
|
||||
| DELETE | /api/v1/provisioning/templates/:name | [route delete template](#route-delete-template) | Delete a template. |
|
||||
| GET | /api/v1/provisioning/templates/:name | [route get template](#route-get-template) | Get a notification template. |
|
||||
| GET | /api/v1/provisioning/templates | [route get templates](#route-get-templates) | Get all notification templates. |
|
||||
| PUT | /api/v1/provisioning/templates/:name | [route put template](#route-put-template) | Create or update a notification template. |
|
||||
|
||||
## Edit resources in the Grafana UI
|
||||
|
||||
@@ -631,6 +633,83 @@ Status: OK
|
||||
|
||||
[MuteTimings](#mute-timings)
|
||||
|
||||
### <span id="route-get-mute-timings-export"></span> Export all mute timings in provisioning file format. (_RouteGetMuteTimingsExport_)
|
||||
|
||||
```
|
||||
GET /api/v1/provisioning/mute-timings/export
|
||||
```
|
||||
|
||||
#### Parameters
|
||||
|
||||
| Name | Source | Type | Go type | Separator | Required | Default | Description |
|
||||
| -------- | ------- | ------- | -------- | --------- | :------: | -------- | --------------------------------------------------------------------------------------------------------------------------------- |
|
||||
| download | `query` | boolean | `bool` | | | | Whether to initiate a download of the file or not. |
|
||||
| format | `query` | string | `string` | | | `"yaml"` | Format of the downloaded file, either yaml or json. Accept header can also be used, but the query parameter will take precedence. |
|
||||
|
||||
#### All responses
|
||||
|
||||
| Code | Status | Description | Has headers | Schema |
|
||||
| ----------------------------------------- | --------- | ----------------- | :---------: | --------------------------------------------------- |
|
||||
| [200](#route-get-mute-timings-export-200) | OK | MuteTimingsExport | | [schema](#route-get-mute-timings-export-200-schema) |
|
||||
| [403](#route-get-mute-timings-export-403) | Forbidden | PermissionDenied | | [schema](#route-get-mute-timings-export-403-schema) |
|
||||
|
||||
#### Responses
|
||||
|
||||
##### <span id="route-get-mute-timings-export-200"></span> 200 - MuteTimingsExport
|
||||
|
||||
Status: OK
|
||||
|
||||
###### <span id="route-get-mute-timings-export-200-schema"></span> Schema
|
||||
|
||||
[AlertingFileExport](#alerting-file-export)
|
||||
|
||||
##### <span id="route-get-mute-timings-export-403"></span> 403 - PermissionDenied
|
||||
|
||||
Status: Forbidden
|
||||
|
||||
###### <span id="route-get-mute-timings-export-403-schema"></span> Schema
|
||||
|
||||
[PermissionDenied](#permission-denied)
|
||||
|
||||
### <span id="route-get-mute-timing-export"></span> Export a mute timing in provisioning file format. (_RouteGetMuteTimingExport_)
|
||||
|
||||
```
|
||||
GET /api/v1/provisioning/mute-timings/:name/export
|
||||
```
|
||||
|
||||
#### Parameters
|
||||
|
||||
| Name | Source | Type | Go type | Separator | Required | Default | Description |
|
||||
| -------- | ------- | ------- | -------- | --------- | :------: | -------- | --------------------------------------------------------------------------------------------------------------------------------- |
|
||||
| name | `path` | string | `string` | | ✓ | | Mute timing name. |
|
||||
| download | `query` | boolean | `bool` | | | | Whether to initiate a download of the file or not. |
|
||||
| format | `query` | string | `string` | | | `"yaml"` | Format of the downloaded file, either yaml or json. Accept header can also be used, but the query parameter will take precedence. |
|
||||
|
||||
#### All responses
|
||||
|
||||
| Code | Status | Description | Has headers | Schema |
|
||||
| ---------------------------------------- | --------- | ---------------- | :---------: | --------------------------------------------------- |
|
||||
| [200](#route-get-mute-timing-export-200) | OK | MuteTimingExport | | [schema](#route-get-mute-timings-export-200-schema) |
|
||||
| [403](#route-get-mute-timing-export-403) | Forbidden | PermissionDenied | | [schema](#route-get-mute-timings-export-403-schema) |
|
||||
|
||||
#### Responses
|
||||
|
||||
##### <span id="route-get-mute-timing-export-200"></span> 200 - MuteTimingExport
|
||||
|
||||
Status: OK
|
||||
|
||||
###### <span id="route-get-mute-timing-export-200-schema"></span> Schema
|
||||
|
||||
[AlertingFileExport](#alerting-file-export)
|
||||
|
||||
##### <span id="route-get-mute-timing-export-403"></span> 403 - PermissionDenied
|
||||
|
||||
Status: Forbidden
|
||||
|
||||
###### <span id="route-get-mute-timing-export-403-schema"></span> Schema
|
||||
|
||||
[PermissionDenied](#permission-denied)
|
||||
|
||||
### <span id="route-get-policy-tree"></span> Get the notification policy tree. (_RouteGetPolicyTree_)
|
||||
|
||||
```
|
||||
@@ -1121,7 +1200,7 @@ Status: Bad Request
|
||||
|
||||
[ValidationError](#validation-error)
|
||||
|
||||
### <span id="route-put-template"></span> Updates an existing notification template. (_RoutePutTemplate_)
|
||||
### <span id="route-put-template"></span> Create or update a notification template. (_RoutePutTemplate_)
|
||||
|
||||
```
|
||||
PUT /api/v1/provisioning/templates/:name
|
||||
@@ -1393,6 +1472,14 @@ Status: Accepted
|
||||
|
||||
{{% /responsive-table %}}
|
||||
|
||||
### <span id="mute-timing-export"></span> MuteTimingExport
|
||||
|
||||
**Properties**
|
||||
|
||||
### <span id="mute-timings-export"></span> MuteTimingsExport
|
||||
|
||||
**Properties**
|
||||
|
||||
### <span id="mute-timings"></span> MuteTimings
|
||||
|
||||
[][MuteTimeInterval](#mute-time-interval)
|
||||
|
||||
@@ -17,8 +17,10 @@ Copy Grafana configuration files that you might have modified in your Grafana de
|
||||
|
||||
The Grafana configuration files are located in the following directories:
|
||||
|
||||
- Default configuration: `$WORKING_DIR/conf/defaults.ini`
|
||||
- Custom configuration: `$WORKING_DIR/conf/custom.ini`
|
||||
- Default configuration: `$WORKING_DIR/defaults.ini` (Don't change this file)
|
||||
- Custom configuration: `$WORKING_DIR/custom.ini`
|
||||
|
||||
For more information on where to find configuration files, refer to [Configuration file location](https://grafana.com/docs/grafana/<GRAFANA_VERSION>/setup-grafana/configure-grafana/#configuration-file-location).
|
||||
|
||||
{{% admonition type="note" %}}
|
||||
If you installed Grafana using the `deb` or `rpm` packages, then your configuration file is located at
|
||||
|
||||
@@ -0,0 +1,123 @@
|
||||
---
|
||||
headless: true
|
||||
labels:
|
||||
products:
|
||||
- enterprise
|
||||
- oss
|
||||
---
|
||||
|
||||
[//]: # 'This file documents the introductory material for traces to profiling for the Pyroscope data source.'
|
||||
[//]: # 'This shared file is included in these locations:'
|
||||
[//]: # '/grafana/docs/sources/datasources/pyroscope/profiling-and-tracing.md'
|
||||
[//]: # '/website/docs/grafana-cloud/data-configuration/traces/traces-query-editor.md'
|
||||
[//]: # '/docs/sources/view-and-analyze-profile-data/profile-tracing/_index.md'
|
||||
[//]: #
|
||||
[//]: # 'If you make changes to this file, verify that the meaning and content are not changed in any place where the file is included.'
|
||||
[//]: # 'Any links should be fully qualified and not relative: /docs/grafana/ instead of ../grafana/.'
|
||||
|
||||
<!-- Profiling and tracing integration -->
|
||||
|
||||
Profiles, continuous profiling, and distributed traces are all tools that can be used to improve the performance and reliability of applications.
|
||||
However, each tool has its own strengths and weaknesses, and it is important to choose the right tool for the job as well as understand when to use both.
|
||||
|
||||
## Profiling
|
||||
|
||||
Profiling offers a deep-dive into an application's performance at the code level, highlighting resource usage and performance hotspots.
|
||||
|
||||
<table>
|
||||
<tr>
|
||||
<th scope="row">Usage</th>
|
||||
<td>During development, major releases, or upon noticing performance quirks.</td>
|
||||
</tr>
|
||||
<tr>
|
||||
<th scope="row">Benefits</th>
|
||||
<td>
|
||||
<ul>
|
||||
<li>Business: Boosts user experience through enhanced application performance.</li>
|
||||
<li>Technical: Gives clear insights into code performance and areas of refinement.</li>
|
||||
</ul>
|
||||
</td>
|
||||
</tr>
|
||||
<tr>
|
||||
<th scope="row">Example</th>
|
||||
<td>A developer uses profiling upon noting slow app performance, identifies a CPU-heavy function, and optimizes it.</td>
|
||||
</tr>
|
||||
</table>
|
||||
|
||||
## Continuous profiling
|
||||
|
||||
Continuous profiling provides ongoing performance insights, capturing long-term trends and intermittent issues.
|
||||
|
||||
<table>
|
||||
<tr>
|
||||
<th scope="row">Usage</th>
|
||||
<td>Mainly in production, especially for high-priority applications.</td>
|
||||
</tr>
|
||||
<tr>
|
||||
<th scope="row">Benefits</th>
|
||||
<td>
|
||||
<ul>
|
||||
<li>Business: Preemptively addresses inefficiencies, potentially saving costs.</li>
|
||||
<li>Technical: Highlights performance trends and issues like potential memory leaks over time.</li>
|
||||
</ul>
|
||||
</td>
|
||||
</tr>
|
||||
<tr>
|
||||
<th scope="row">Example</th>
|
||||
<td>A month-long data from continuous profiling suggests increasing memory consumption, hinting at a memory leak.</td>
|
||||
</tr>
|
||||
</table>
|
||||
|
||||
## Distributed tracing
|
||||
|
||||
Traces requests as they cross multiple services, revealing interactions and service dependencies.
|
||||
|
||||
<table>
|
||||
<tr>
|
||||
<th scope="row">Usage</th>
|
||||
<td>Essential for systems like microservices where requests touch multiple services.</td>
|
||||
</tr>
|
||||
<tr>
|
||||
<th scope="row">Benefits</th>
|
||||
<td>
|
||||
<ul>
|
||||
<li>Business: Faster issue resolution, reduced downtimes, and strengthened customer trust.</li>
|
||||
<li>Technical: A broad view of the system's structure, revealing bottlenecks and inter-service dependencies.</li>
|
||||
</ul>
|
||||
</td>
|
||||
</tr>
|
||||
<tr>
|
||||
<th scope="row">Example</th>
|
||||
<td>In e-commerce, a user's checkout request might involve various services. Tracing depicts this route, pinpointing where time is most spent.</td>
|
||||
</tr>
|
||||
</table>
|
||||
|
||||
## Combined power of tracing and profiling
|
||||
|
||||
When used together, tracing and profiling provide a powerful tool for understanding system and application performance.
|
||||
|
||||
<table>
|
||||
<tr>
|
||||
<th scope="row">Usage</th>
|
||||
<td>For comprehensive system-to-code insights, especially when diagnosing complex issues spread across services and codebases.</td>
|
||||
</tr>
|
||||
<tr>
|
||||
<th scope="row">Benefits</th>
|
||||
<td>
|
||||
<ul>
|
||||
<li>Business: Reduces downtime, optimizes user experience, and safeguards revenues.</li>
|
||||
<li>Technical:
|
||||
<ul>
|
||||
<li>Holistic view: Tracing pinpoints bottle-necked services, while profiling delves into the responsible code segments.</li>
|
||||
<li>End-to-end insight: Visualizes a request's full journey and the performance of individual code parts.</li>
|
||||
<li>Efficient diagnosis: Tracing identifies service latency; profiling zeroes in on its cause, be it database queries, API calls, or specific code inefficiencies.</li>
|
||||
</ul>
|
||||
</li>
|
||||
</ul>
|
||||
</td>
|
||||
</tr>
|
||||
<tr>
|
||||
<th scope="row">Example</th>
|
||||
<td>Tracing reveals latency in a payment service. Combined with profiling, it's found that a particular function, making third-party validation calls, is the culprit. This insight guides optimization, refining system efficiency.</td>
|
||||
</tr>
|
||||
</table>
|
||||
@@ -95,7 +95,7 @@ Spans with the same color belong to the same service. The grey text to the right
|
||||
The Tempo data source supports streaming responses to TraceQL queries so you can see partial query results as they come in without waiting for the whole query to finish.
|
||||
|
||||
{{% admonition type="note" %}}
|
||||
To use this experimental feature, enable the `traceQLStreaming` feature toggle. If you’re using Grafana Cloud and would like to enable this feature, please contact customer support.
|
||||
To use this feature in Grafana OSS v10.1 and later, enable the `traceQLStreaming` feature toggle. This capability is enabled by default in Grafana Cloud.
|
||||
{{% /admonition %}}
|
||||
|
||||
Streaming is available for both the **Search** and **TraceQL** query types, and you'll get immediate visibility of incoming traces on the results table.
|
||||
|
||||
@@ -118,7 +118,7 @@ For additional information, refer to [Traces to metrics: Ad-hoc RED metrics in G
|
||||
When you use **Aggregate by**, the selections you make determine how the information is reported in the Table. Every combination that matches selections in your data is listed in the table.
|
||||
Each aggregate value, for example `intrinsic`:`name`, has a corresponding column in the results table.
|
||||
|
||||
For example, **names** matching `GET /:endpoint` with a **span.http.user_agent** of `k6/0.46` appeared in 31,466 spans. Instead of being listed by traces and associated spans, the query results are grouped by the the selections in **Aggregate by**.
|
||||
For example, **names** matching `GET /:endpoint` with a **span.http.user_agent** of `k6/0.46` appeared in 31,466 spans. Instead of being listed by traces and associated spans, the query results are grouped by the selections in **Aggregate by**.
|
||||
|
||||
The RED metrics are calculated for every name and user agent combination found in your data.
|
||||
|
||||
|
||||
@@ -29,14 +29,16 @@ There are two ways to configure the trace to profiles feature:
|
||||
- Configure a custom query where you can use a template language to interpolate variables from the trace or span.
|
||||
|
||||
{{< admonition type="note">}}
|
||||
Traces to profile requires a Tempo data source with Traces to profiles configured and a Pyroscope data source. This integration supports profile data generated using Go, Ruby, and Java instrumentation SDKs.
|
||||
Traces to profile requires a Tempo data source with Traces to profiles configured and a Pyroscope data source. This integration supports profile data generated using [Go](/docs/pyroscope/<PYROSCOPE_VERSION>/configure-client/trace-span-profiles/go-span-profiles/), [Ruby](/docs/pyroscope/<PYROSCOPE_VERSION>/configure-client/trace-span-profiles/ruby-span-profiles/), and [Java](/docs/pyroscope/<PYROSCOPE_VERSION>/configure-client/trace-span-profiles/java-span-profiles/) instrumentation SDKs.
|
||||
|
||||
As with traces, your application needs to be instrumented to emit profiling data. For more information, refer to [Linking tracing and profiling with span profiles](/docs/pyroscope/<PYROSCOPE_VERSION>/configure-client/trace-span-profiles/).
|
||||
{{< /admonition >}}
|
||||
|
||||
To use trace to profiles, navigate to **Explore** and query a trace. Each span now links to your queries. Clicking a link runs the query in a split panel. If tags are configured, Grafana dynamically inserts the span attribute values into the query. The query runs over the time range of the (span start time - 60) to (span end time + 60 seconds).
|
||||
|
||||

|
||||
|
||||
To use trace to profiles, you must have a configured Grafana Pyroscope data source. For more information, refer to the [Grafana Pyroscope data source](/docs/grafana/latest/datasources/grafana-pyroscope/) documentation.
|
||||
To use trace to profiles, you must have a configured Grafana Pyroscope data source. For more information, refer to the [Grafana Pyroscope data source](/docs/grafana/<GRAFANA_VERSION>/datasources/grafana-pyroscope/) documentation.
|
||||
|
||||
**Embedded flame graphs** are also inserted into each span details section that has a linked profile (requires a configured Grafana Pyroscope data source).
|
||||
This lets you see resource consumption in a flame graph visualization for each span without having to navigate away from the current view.
|
||||
@@ -70,7 +72,7 @@ To use a custom query with the configuration, follow these steps:
|
||||
1. Select a Pyroscope data source from the **Data source** drop-down.
|
||||
1. Optional: Choose any tags to use in the query. If left blank, the default values of `service.name` and `service.namespace` are used.
|
||||
|
||||
These tags can be used in the custom query with `${__tags}` variable. This variable interpolates the mapped tags as list in an appropriate syntax for the data source. Only the tags that were present in the span are included; tags that aren't present are omitted. You can also configure a new name for the tag. This is useful in cases where the tag has dots in the name and the target data source doesn't allow using dots in labels. For example, you can remap `service.name` to `service_name`. If you don’t map any tags here, you can still use any tag in the query, for example: `method="${__span.tags.method}"`. You can learn more about custom query variables [here](/docs/grafana/latest/datasources/tempo/configure-tempo-data-source/#custom-query-variables).
|
||||
These tags can be used in the custom query with `${__tags}` variable. This variable interpolates the mapped tags as list in an appropriate syntax for the data source. Only the tags that were present in the span are included; tags that aren't present are omitted. You can also configure a new name for the tag. This is useful in cases where the tag has dots in the name and the target data source doesn't allow using dots in labels. For example, you can remap `service.name` to `service_name`. If you don’t map any tags here, you can still use any tag in the query, for example: `method="${__span.tags.method}"`. You can learn more about custom query variables [here](/docs/grafana/<GRAFANA_VERSION>/datasources/tempo/configure-tempo-data-source/#custom-query-variables).
|
||||
|
||||
1. Select one or more profile types to use in the query. Select the drop-down and choose options from the menu.
|
||||
1. Switch on **Use custom query** to enter a custom query.
|
||||
|
||||
@@ -8,13 +8,13 @@ title: Upgrade guide common tasks
|
||||
|
||||
## Upgrade Grafana
|
||||
|
||||
The following sections provide instructions for how to upgrade Grafana based on your installation method.
|
||||
The following sections provide instructions for how to upgrade Grafana based on your installation method. For more information on where to find configuration files, refer to [Configuration file location](https://grafana.com/docs/grafana/<GRAFANA_VERSION>/setup-grafana/configure-grafana/#configuration-file-location).
|
||||
|
||||
### Debian
|
||||
|
||||
To upgrade Grafana installed from a Debian package (`.deb`), complete the following steps:
|
||||
|
||||
1. In your current installation of Grafana, save your custom configuration changes to a file named `<grafana_install_dir>/conf/custom.ini`.
|
||||
1. In your current installation of Grafana, save your custom configuration changes to a file named `<grafana_install_dir>/grafana.ini`.
|
||||
|
||||
This enables you to upgrade Grafana without the risk of losing your configuration changes.
|
||||
|
||||
@@ -32,7 +32,7 @@ To upgrade Grafana installed from a Debian package (`.deb`), complete the follow
|
||||
|
||||
To upgrade Grafana installed from the Grafana Labs APT repository, complete the following steps:
|
||||
|
||||
1. In your current installation of Grafana, save your custom configuration changes to a file named `<grafana_install_dir>/conf/custom.ini`.
|
||||
1. In your current installation of Grafana, save your custom configuration changes to a file named `<grafana_install_dir>/grafana.ini`.
|
||||
|
||||
This enables you to upgrade Grafana without the risk of losing your configuration changes.
|
||||
|
||||
@@ -49,7 +49,7 @@ Grafana automatically updates when you run `apt-get upgrade`.
|
||||
|
||||
To upgrade Grafana installed from the binary `.tar.gz` package, complete the following steps:
|
||||
|
||||
1. In your current installation of Grafana, save your custom configuration changes to a file named `<grafana_install_dir>/conf/custom.ini`.
|
||||
1. In your current installation of Grafana, save your custom configuration changes to the custom configuration file, `custom.ini` or `grafana.ini`.
|
||||
|
||||
This enables you to upgrade Grafana without the risk of losing your configuration changes.
|
||||
|
||||
@@ -61,7 +61,7 @@ To upgrade Grafana installed from the binary `.tar.gz` package, complete the fol
|
||||
|
||||
To upgrade Grafana installed using RPM or YUM complete the following steps:
|
||||
|
||||
1. In your current installation of Grafana, save your custom configuration changes to a file named `<grafana_install_dir>/conf/custom.ini`.
|
||||
1. In your current installation of Grafana, save your custom configuration changes to a file named `<grafana_install_dir>/grafana.ini`.
|
||||
|
||||
This enables you to upgrade Grafana without the risk of losing your configuration changes.
|
||||
|
||||
@@ -84,7 +84,7 @@ To upgrade Grafana installed using RPM or YUM complete the following steps:
|
||||
|
||||
To upgrade Grafana running in a Docker container, complete the following steps:
|
||||
|
||||
1. In your current installation of Grafana, save your custom configuration changes to a file named `<grafana_install_dir>/conf/custom.ini`.
|
||||
1. Use Grafana [environment variables](https://grafana.com/docs/grafana/<GRAFANA_VERSION>/setup-grafana/configure-grafana/#override-configuration-with-environment-variables) to save your custom configurations; this is the recommended method. Alternatively, you can view your configuration files manually by accessing the deployed container.
|
||||
|
||||
This enables you to upgrade Grafana without the risk of losing your configuration changes.
|
||||
|
||||
@@ -119,7 +119,7 @@ To upgrade Grafana installed on Windows, complete the following steps:
|
||||
|
||||
To upgrade Grafana installed on Mac, complete the following steps:
|
||||
|
||||
1. In your current installation of Grafana, save your custom configuration changes to a file named `<grafana_install_dir>/conf/custom.ini`.
|
||||
1. In your current installation of Grafana, save your custom configuration changes to the custom configuration file, `custom.ini`.
|
||||
|
||||
This enables you to upgrade Grafana without the risk of losing your configuration changes.
|
||||
|
||||
|
||||
@@ -8,6 +8,6 @@ Choose how null values, which are gaps in the data, appear on the graph. Null va
|
||||
|
||||

|
||||
|
||||
- **Never:** Time series data points with gaps in the the data are never connected.
|
||||
- **Always:** Time series data points with gaps in the the data are always connected.
|
||||
- **Never:** Time series data points with gaps in the data are never connected.
|
||||
- **Always:** Time series data points with gaps in the data are always connected.
|
||||
- **Threshold:** Specify a threshold above which gaps in the data are no longer connected. This can be useful when the connected gaps in the data are of a known size and/or within a known range, and gaps outside this range should no longer be connected.
|
||||
|
||||
@@ -8,5 +8,5 @@ Choose whether to set a threshold above which values in the data should be disco
|
||||
|
||||
{{< figure src="/media/docs/grafana/screenshot-grafana-10-1-disconnect-values.png" max-width="750px" alt="Disconnect values options" >}}
|
||||
|
||||
- **Never:** Time series data points in the the data are never disconnected.
|
||||
- **Never:** Time series data points in the data are never disconnected.
|
||||
- **Threshold:** Specify a threshold above which values in the data are disconnected. This can be useful when desired values in the data are of a known size and/or within a known range, and values outside this range should no longer be connected.
|
||||
|
||||
37
docs/sources/upgrade-guide/upgrade-v10.4/index.md
Normal file
37
docs/sources/upgrade-guide/upgrade-v10.4/index.md
Normal file
@@ -0,0 +1,37 @@
|
||||
---
|
||||
description: Guide for upgrading to Grafana v10.4
|
||||
keywords:
|
||||
- grafana
|
||||
- configuration
|
||||
- documentation
|
||||
- upgrade
|
||||
- '10.4'
|
||||
title: Upgrade to Grafana v10.4
|
||||
menuTitle: Upgrade to v10.4
|
||||
weight: 1300
|
||||
---
|
||||
|
||||
# Upgrade to Grafana v10.4
|
||||
|
||||
{{< docs/shared lookup="upgrade/intro.md" source="grafana" version="<GRAFANA VERSION>" >}}
|
||||
|
||||
{{< docs/shared lookup="back-up/back-up-grafana.md" source="grafana" version="<GRAFANA VERSION>" leveloffset="+1" >}}
|
||||
|
||||
{{< docs/shared lookup="upgrade/upgrade-common-tasks.md" source="grafana" version="<GRAFANA VERSION>" >}}
|
||||
|
||||
## Technical notes
|
||||
|
||||
### Legacy alerting -> Grafana Alerting dry-run on start
|
||||
|
||||
If you haven't already upgraded to Grafana Alerting from legacy Alerting, Grafana will initiate a dry-run of the upgrade every time the instance starts. This is in preparation for the removal of legacy Alerting in Grafana v11. The dry-run logs the results of the upgrade attempt and identifies any issues requiring attention before you can successfully execute the upgrade. No changes are made during the dry-run.
|
||||
|
||||
You can disable this behavior using the feature flag `alertingUpgradeDryrunOnStart`:
|
||||
|
||||
```toml
|
||||
[feature_toggles]
|
||||
alertingUpgradeDryrunOnStart=false
|
||||
```
|
||||
|
||||
{{% admonition type="note" %}}
|
||||
We strongly encourage you to review the [upgrade guide](https://grafana.com/docs/grafana/v10.4/alerting/set-up/migrating-alerts/) and perform the necessary upgrade steps prior to v11.
|
||||
{{% /admonition %}}
|
||||
@@ -76,6 +76,7 @@ For a complete list of every change, with links to pull requests and related iss
|
||||
|
||||
## Grafana 10
|
||||
|
||||
- [What's new in 10.4](https://grafana.com/docs/grafana/<GRAFANA_VERSION>/whatsnew/whats-new-in-v10-4/)
|
||||
- [What's new in 10.3](https://grafana.com/docs/grafana/<GRAFANA_VERSION>/whatsnew/whats-new-in-v10-3/)
|
||||
- [What's new in 10.2](https://grafana.com/docs/grafana/<GRAFANA_VERSION>/whatsnew/whats-new-in-v10-2/)
|
||||
- [What's new in 10.1]({{< relref "whats-new-in-v10-1/" >}})
|
||||
|
||||
@@ -365,7 +365,7 @@ Derived fields or data links are a concept to add correlations based on your log
|
||||
|
||||
The following example would add the derived field `traceID regex` based on a regular expression and another `app label` field based on the `app` label.
|
||||
|
||||
{{< figure src="/media/docs/grafana/2024-01-05_loki-derived-fields.png" >}}
|
||||
{{< figure src="/media/docs/grafana/2024-01-05_loki-derived-fields.png" alt="Derived fields added based on a regular expression and an app label">}}
|
||||
|
||||
### InfluxDB native SQL support
|
||||
|
||||
|
||||
282
docs/sources/whatsnew/whats-new-in-v10-4.md
Normal file
282
docs/sources/whatsnew/whats-new-in-v10-4.md
Normal file
@@ -0,0 +1,282 @@
|
||||
---
|
||||
description: Feature and improvement highlights for Grafana v10.4
|
||||
keywords:
|
||||
- grafana
|
||||
- new
|
||||
- documentation
|
||||
- '10.4'
|
||||
- release notes
|
||||
labels:
|
||||
products:
|
||||
- cloud
|
||||
- enterprise
|
||||
- oss
|
||||
title: What's new in Grafana v10.4
|
||||
weight: -41
|
||||
---
|
||||
|
||||
# What’s new in Grafana v10.4
|
||||
|
||||
Welcome to Grafana 10.4! This minor release contains some notable improvements in its own right, as well as early previews of functionality we intend to turn on by default in Grafana v11. Read on to learn about a quicker way to set up alert notifications, an all-new UI for configuring single sign-on, and improvements to our Canvas, Geomap, and Table panels.
|
||||
|
||||
For even more detail about all the changes in this release, refer to the [changelog](https://github.com/grafana/grafana/blob/main/CHANGELOG.md). For the specific steps we recommend when you upgrade to v10.4, check out our [Upgrade Guide](https://grafana.com/docs/grafana/<GRAFANA_VERSION>/upgrade-guide/upgrade-v10.4/).
|
||||
|
||||
<!-- Template below
|
||||
|
||||
## Feature
|
||||
<!-- Name of contributor -->
|
||||
<!--_[Generally available | Available in private/public preview | Experimental] in Grafana [Open Source, Enterprise, all editions of Grafana, some combination of self-managed and Cloud]_
|
||||
Description. Include an overview of the feature and problem it solves, and where to learn more (like a link to the docs).
|
||||
{{% admonition type="note" %}}
|
||||
Use full URLs for links. When linking to versioned docs, replace the version with the version interpolation placeholder (for example, <GRAFANA_VERSION>, <TEMPO_VERSION>, <MIMIR_VERSION>) so the system can determine the correct set of docs to point to. For example, "https://grafana.com/docs/grafana/latest/administration/" becomes "https://grafana.com/docs/grafana/<GRAFANA_VERSION>/administration/".
|
||||
{{% /admonition %}}
|
||||
|
||||
<!--Add an image, GIF or video as below-->
|
||||
|
||||
<!--{{< figure src="/media/docs/grafana/dashboards/WidgetVizSplit.png" max-width="750px" caption="DESCRIPTIVE CAPTION" >}}
|
||||
|
||||
<!--Learn how to upload images here: https://grafana.com/docs/writers-toolkit/write/image-guidelines/#where-to-store-media-assets-->
|
||||
<!---->
|
||||
|
||||
## Dashboards and visualizations
|
||||
|
||||
### AngularJS plugin warnings in dashboards
|
||||
|
||||
<!-- #grafana-deprecate-angularjs-->
|
||||
|
||||
_Generally available in all editions of Grafana_
|
||||
|
||||
AngularJS support in Grafana was deprecated in v9 and will be turned off by default in Grafana v11. When this happens, any plugin which depended on AngularJS will not load, and dashboard panels will be unable to show data.
|
||||
|
||||
To help you understand where you may be impacted, Grafana now displays a warning banner in any dashboard with a dependency on an AngularJS plugin. Additionally, warning icons are present in any panel where the panel plugin or underlying data source plugin has an AngularJS dependency.
|
||||
|
||||
This complements the existing warnings already present on the **Plugins** page under the administration menu.
|
||||
|
||||
In addition, you can use our [detect-angular-dashboards](https://github.com/grafana/detect-angular-dashboards) open source tool, which can be run against any Grafana instance to generate a report listing all dashboards that have a dependency on an AngularJS plugin, as well as which plugins are in use. This tool also supports the detection of [private plugins](https://grafana.com/legal/plugins/) that are dependent on AngularJS, however this particular feature requires Grafana v10.1.0 or higher.
|
||||
|
||||
Use the aforementioned tooling and warnings to plan migrations to React based [visualizations](https://grafana.com/docs/grafana/latest/panels-visualizations/) and [data sources](https://grafana.com/docs/grafana/latest/datasources/) included in Grafana or from the [Grafana plugins catalog](https://grafana.com/grafana/plugins/).
|
||||
|
||||
To learn more, refer to the [Angular support deprecation](https://grafana.com/docs/grafana/<GRAFANA_VERSION>/developers/angular_deprecation/), which includes [recommended alternative plugins](https://grafana.com/docs/grafana/<GRAFANA_VERSION>/developers/angular_deprecation/angular-plugins/).
|
||||
|
||||
{{< youtube id="XlEVs6g8dC8" >}}
|
||||
|
||||
[Documentation](https://grafana.com/docs/grafana/<GRAFANA_VERSION>/developers/angular_deprecation/)
|
||||
|
||||
### Data visualization quality of life improvements
|
||||
|
||||
<!-- Nathan Marrs -->
|
||||
|
||||
_Generally available in all editions of Grafana_
|
||||
|
||||
We’ve made a number of small improvements to the data visualization experience in Grafana.
|
||||
|
||||
#### Geomap geojson layer now supports styling
|
||||
|
||||
You can now visualize geojson styles such as polygons, point color/size, and line strings. To learn more, [refer to the documentation](https://grafana.com/docs/grafana/<GRAFANA_VERSION>/panels-visualizations/visualizations/geomap/#geojson-layer).
|
||||
|
||||

|
||||
|
||||
#### Canvas elements now support snapping and aligning
|
||||
|
||||
You can precisely place elements in a canvas with ease as elements now snap into place and align with one another.
|
||||
|
||||
{{< video-embed src="/media/docs/grafana/screen-recording-10-4-canvas-element-snapping.mp4" caption="Canvas element snapping and alignment" >}}
|
||||
|
||||
#### View data links inline in table visualizations
|
||||
|
||||
You can now view your data links inline to help you keep your tables visually streamlined.
|
||||
|
||||

|
||||
|
||||
### Create subtables in table visualizations with Group to nested tables
|
||||
|
||||
<!-- Nathan Marrs -->
|
||||
|
||||
_Available in public preview in all editions of Grafana_
|
||||
|
||||
You can now create subtables out of your data using the new **Group to nested tables** transformation. To use this feature, enable the `groupToNestedTableTransformation` [feature toggle](https://grafana.com/docs/grafana/<GRAFANA_VERSION>/setup-grafana/configure-grafana/feature-toggles/#preview-feature-toggles).
|
||||
|
||||
{{< video-embed src="/media/docs/grafana/screen-recording-10-4-table-group-to-nested-table-transformation.mp4" caption="Group to nested tables transformation" >}}
|
||||
|
||||
### Set library panel permissions with RBAC
|
||||
|
||||
<!-- #grafana-dashboards -->
|
||||
|
||||
_Generally available in Grafana Enterprise and Grafana Cloud_
|
||||
|
||||
We've added the option to manage library panel permissions through role-based access control (RBAC). With this feature, you can choose who can create, edit, and read library panels. RBAC provides a standardized way of granting, changing, and revoking access when it comes to viewing and modifying Grafana resources, such as dashboards, reports, and administrative settings.
|
||||
|
||||
[Documentation](https://grafana.com/docs/grafana/<GRAFANA_VERSION>/dashboards/build-dashboards/manage-library-panels/)
|
||||
|
||||
### Tooltip improvements
|
||||
|
||||
<!--Adela Almasan-->
|
||||
|
||||
_Available in public preview in all editions of Grafana_
|
||||
|
||||
We’ve made a number of small improvements to the way tooltips work in Grafana. To try out the new tooltips, enable the `newVizTooltips` [feature toggle](https://grafana.com/docs/grafana/<GRAFANA_VERSION>/setup-grafana/configure-grafana/feature-toggles/).
|
||||
|
||||
**Copy on click support**
|
||||
|
||||
You can now copy the content from within a tooltip by clicking on the text.
|
||||
|
||||

|
||||
|
||||
**Scrollable content**
|
||||
|
||||
You can now scroll the content of a tooltip, which allows you to view long lists. This is currently supported in the time series, candlestick, and trend visualizations. We'll add more improvements to the scrolling functionality in a future version.
|
||||
|
||||

|
||||
|
||||
**Added tooltip options for candlestick visualization**
|
||||
|
||||
The default tooltip options are now also visible in candlestick visualizations.
|
||||
|
||||
**Hover proximity option in time series**
|
||||
|
||||
We've added a tooltip hover proximity limit option (in pixels), which makes it possible to reduce the number of hovered-over data points under the cursor when two datasets are not aligned in time.
|
||||
|
||||

|
||||
|
||||
## Return to previous
|
||||
|
||||
<!-- #grafana-frontend-platform-->
|
||||
|
||||
_Available in public preview in all editions of Grafana_
|
||||
|
||||
When you're browsing Grafana - for example, exploring the dashboard and metrics related to an alert - it's easy to end up far from where you started and hard get back to where you came from. The ‘Return to previous’ button is an easy way to go back to the previous context, like the alert rule that kicked off your exploration. This first release works for Alerts, and we plan to expand to other apps and features in Grafana in future releases to make it easier to navigate around.
|
||||
|
||||
Return to Previous is rolling out across Grafana Cloud now. To try Return to Previous in self-managed Grafana, turn on the `returnToPrevious` [feature toggle](https://grafana.com/docs/grafana/latest/setup-grafana/configure-grafana/feature-toggles/) in Grafana v10.4 or newer.
|
||||
|
||||
{{< youtube id="-Y3qPfD2wrA" >}}
|
||||
|
||||
{{< admonition type="note" >}}
|
||||
The term **context** refers to applications in Grafana like Incident and OnCall, as well as core features like Explore and Dashboards.
|
||||
|
||||
To notice a change in your context, look at Grafana's breadcrumbs. If you go from _Home > **Dashboards**_ to _Home > **Explore**_, you've changed context. If you go from _Home > **Dashboards** > Playlist > Edit playlist_ to _Home > **Dashboards** > Reporting > Settings_, you are in the same context.
|
||||
{{< /admonition >}}
|
||||
|
||||
## Alerting
|
||||
|
||||
### Simplified Alert Notification Routing
|
||||
|
||||
<!-- #alerting -->
|
||||
|
||||
_Generally available in all editions of Grafana_
|
||||
|
||||
This feature simplifies your options for configuring where your notifications are sent when an alert rule fires. Choose an existing contact point directly from within the alert rule creation form without the need to label match notification policies. You can also set optional muting, grouping, and timing settings directly in the alert rule.
|
||||
|
||||
Simplified routing inherits the alert rule RBAC, increasing control over notification routing while preventing accidental notification policy updates, ensuring critical notifications make it to their intended contact point destination.
|
||||
|
||||
To try out Simplified Alert Notification Routing enable the `alertingSimplifiedRouting` feature toggle.
|
||||
|
||||
{{< youtube id="uBBQ-_pWSNs" >}}
|
||||
|
||||
### Grafana Alerting upgrade with rule preview
|
||||
|
||||
<!-- #alerting -->
|
||||
|
||||
_Generally available in all editions of Grafana_
|
||||
|
||||
Users looking to migrate to the new Grafana Alerting product can do so with confidence with the Grafana Alerting migration preview tool. The migration preview tool allows users to view, edit, and delete migrated rules prior cutting over, with the option to roll back to Legacy Alerting.
|
||||
|
||||
[Documentation](https://grafana.com/docs/grafana/<GRAFANA_VERSION>/alerting/set-up/migrating-alerts/#upgrade-with-preview-recommended)
|
||||
|
||||
### Rule evaluation spread over the entire evaluation interval
|
||||
|
||||
<!-- #alerting -->
|
||||
|
||||
_Generally available in all editions of Grafana_
|
||||
|
||||
Grafana Alerting previously evaluated rules at the start of the evaluation interval. This created a sudden spike of resource utilization, impacting data sources. Rule evaluation is now spread over the entire interval for smoother performance utilization of data sources.
|
||||
|
||||
### UTF-8 Support for Prometheus and Mimir Alertmanagers
|
||||
|
||||
<!-- #alerting -->
|
||||
|
||||
_Generally available in all editions of Grafana_
|
||||
|
||||
Grafana can now be used to manage both Prometheus and Mimir Alertmanagers with UTF-8 configurations. For more information, please see the
|
||||
[release notes for Alertmanager 0.27.0](https://github.com/prometheus/alertmanager/releases).
|
||||
|
||||
## Authentication and authorization
|
||||
|
||||
### SSO Settings UI and Terraform resource for configuring OAuth providers
|
||||
|
||||
<!-- #proj-grafana-sso-config, #identity-access or Mihaly Gyongyosi (@Misi) -->
|
||||
|
||||
_Available in public preview in all editions of Grafana_
|
||||
|
||||
Configuring OAuth providers was a bit cumbersome in Grafana: Grafana Cloud users had to reach out to Grafana Support, self-hosted users had to manually edit the configuration file, set up environment variables, and then they had to restart Grafana. On Cloud, the Advanced Auth page is there to configure some of the providers, but configuring Generic OAuth hasn’t been available until now and there was no way to manage the settings through the Grafana UI, nor was there a way to manage the settings through Terraform or the Grafana API.
|
||||
|
||||
Our goal is to make setting up SSO for your Grafana instance simple and fast.
|
||||
|
||||
To get there, we are introducing easier self-serve configuration options for OAuth in Grafana. All of the currently supported OAuth providers are now available for configuration through the Grafana UI, Terraform and via the API. From the UI, you can also now manage all of the settings for the Generic OAuth provider.
|
||||
|
||||
We are working on adding complete support for configuring all other supported OAuth providers as well, such as GitHub, GitLab, Google, Microsoft Azure AD and Okta. You can already manage some of these settings via the new self-serve configuration options, and we’re working on adding more at the moment.
|
||||
|
||||

|
||||
|
||||
{{< youtube id="xXW2eRTbjDY" >}}
|
||||
|
||||
[Documentation](https://grafana.com/docs/grafana/next/setup-grafana/configure-security/configure-authentication/)
|
||||
|
||||
## Data sources
|
||||
|
||||
{{< admonition type="note" >}}
|
||||
The following data sources are released separately from Grafana itself. They are included here for extra visibility.
|
||||
{{< /admonition >}}
|
||||
|
||||
### PagerDuty enterprise data source for Grafana
|
||||
|
||||
<!-- #enterprise-datasources -->
|
||||
|
||||
_Generally available in Grafana Enterprise and Grafana Cloud_
|
||||
|
||||
PagerDuty enterprise data source plugin for Grafana allows you to query incidents data or visualize incidents using annotations.
|
||||
|
||||
{{< admonition type="note" >}}
|
||||
Plugin is currently in a preview phase.
|
||||
{{< /admonition >}}
|
||||
|
||||
You can find more information and how to configure the plugin in the [documentation](https://grafana.com/docs/plugins/grafana-pagerduty-datasource/latest/).
|
||||
|
||||
Screenshots:
|
||||
|
||||
{{< figure src="/media/docs/plugins/PagerDuty-incidents-annotation.png" caption="PagerDuty data source annotation editor" alt="PagerDuty data source annotation editor" >}}
|
||||
|
||||
{{< figure src="/media/docs/plugins/PagerDuty-incidents-real-life-example.png" caption="Incidents annotations from PagerDuty data source on a dashboard panel" alt="Incidents annotations from PagerDuty data source on a dashboard panel" >}}
|
||||
|
||||
{{< youtube id="dCklm2DaVqQ" >}}
|
||||
|
||||
### SurrealDB Data Source
|
||||
|
||||
<!-- #grafana-partner-datasources, @adamyeats-->
|
||||
|
||||
_Experimental in all editions of Grafana_
|
||||
|
||||
A SurrealDB data source has been [added to the Plugin Catalog](https://grafana.com/grafana/plugins/grafana-surrealdb-datasource/), enabling the integration of [SurrealDB](https://surrealdb.com/), a real-time, multi-model database, with Grafana's visualization capabilities. This datasource allows users to directly query and visualize data from SurrealDB within Grafana, using SurrealDB's query language.
|
||||
|
||||
The SurrealDB data source launches with just the basics today. You can write queries in SurrealQL using the built-in query editor, although many Grafana features like macros are not supported for now.
|
||||
|
||||
You can find more information and how to configure the plugin [on Github](https://github.com/grafana/surrealdb-datasource).
|
||||
|
||||
{{< figure src="/media/images/dashboards/surrealdb-dashboard-example.png" alt="Grafana dashboard using SurrealDB data source" >}}
|
||||
|
||||
[Documentation](https://grafana.com/grafana/plugins/grafana-surrealdb-datasource/)
|
||||
|
||||
## Table Visualization for Logs
|
||||
|
||||
<!-- #observability-logs -->
|
||||
|
||||
_Generally available in all editions of Grafana_
|
||||
|
||||
The table visualization for logs, announced in public preview for Grafana 10.3, is generally available in Cloud (all editions) and with Grafana 10.4.
|
||||
|
||||
New to the table visualization with 10.4:
|
||||
|
||||
- the ability to sort columns
|
||||
- data type autodetection of fields
|
||||
- autodetection and clean formatting of json fields
|
||||
|
||||
Try it out today!
|
||||
@@ -1,4 +1,4 @@
|
||||
{
|
||||
"npmClient": "yarn",
|
||||
"version": "10.4.0-pre"
|
||||
"version": "10.4.1"
|
||||
}
|
||||
|
||||
@@ -3,7 +3,7 @@
|
||||
"license": "AGPL-3.0-only",
|
||||
"private": true,
|
||||
"name": "grafana",
|
||||
"version": "10.4.0-pre",
|
||||
"version": "10.4.1",
|
||||
"repository": "github:grafana/grafana",
|
||||
"scripts": {
|
||||
"prebuild": "yarn plugin:build",
|
||||
@@ -61,7 +61,7 @@
|
||||
"plugin:build:dev": "lerna run dev --ignore=\"@grafana/*\" --ignore=\"@grafana-plugins/input-datasource\""
|
||||
},
|
||||
"grafana": {
|
||||
"whatsNewUrl": "https://grafana.com/docs/grafana/next/whatsnew/whats-new-in-v10-3/",
|
||||
"whatsNewUrl": "https://grafana.com/docs/grafana/next/whatsnew/whats-new-in-v10-4/",
|
||||
"releaseNotesUrl": "https://grafana.com/docs/grafana/next/release-notes/"
|
||||
},
|
||||
"devDependencies": {
|
||||
|
||||
@@ -2,7 +2,7 @@
|
||||
"author": "Grafana Labs",
|
||||
"license": "Apache-2.0",
|
||||
"name": "@grafana/data",
|
||||
"version": "10.4.0-pre",
|
||||
"version": "10.4.1",
|
||||
"description": "Grafana Data Library",
|
||||
"keywords": [
|
||||
"typescript"
|
||||
@@ -36,7 +36,7 @@
|
||||
},
|
||||
"dependencies": {
|
||||
"@braintree/sanitize-url": "7.0.0",
|
||||
"@grafana/schema": "10.4.0-pre",
|
||||
"@grafana/schema": "10.4.1",
|
||||
"@types/d3-interpolate": "^3.0.0",
|
||||
"@types/string-hash": "1.1.3",
|
||||
"d3-interpolate": "3.0.1",
|
||||
|
||||
@@ -555,7 +555,7 @@ export interface DataQueryRequest<TQuery extends DataQuery = DataQuery> {
|
||||
rangeRaw?: RawTimeRange;
|
||||
timeInfo?: string; // The query time description (blue text in the upper right)
|
||||
panelId?: number;
|
||||
panelPluginType?: string;
|
||||
panelPluginId?: string;
|
||||
dashboardUID?: string;
|
||||
|
||||
/** Filters to dynamically apply to all queries */
|
||||
|
||||
@@ -2,7 +2,7 @@
|
||||
"author": "Grafana Labs",
|
||||
"license": "Apache-2.0",
|
||||
"name": "@grafana/e2e-selectors",
|
||||
"version": "10.4.0-pre",
|
||||
"version": "10.4.1",
|
||||
"description": "Grafana End-to-End Test Selectors Library",
|
||||
"keywords": [
|
||||
"cli",
|
||||
|
||||
@@ -2,7 +2,7 @@
|
||||
"author": "Grafana Labs",
|
||||
"license": "Apache-2.0",
|
||||
"name": "@grafana/e2e",
|
||||
"version": "10.4.0-pre",
|
||||
"version": "10.4.1",
|
||||
"description": "Grafana End-to-End Test Library",
|
||||
"keywords": [
|
||||
"cli",
|
||||
@@ -63,8 +63,8 @@
|
||||
"@babel/core": "7.23.2",
|
||||
"@babel/preset-env": "7.23.2",
|
||||
"@cypress/webpack-preprocessor": "5.17.1",
|
||||
"@grafana/e2e-selectors": "10.4.0-pre",
|
||||
"@grafana/schema": "10.4.0-pre",
|
||||
"@grafana/e2e-selectors": "10.4.1",
|
||||
"@grafana/schema": "10.4.1",
|
||||
"@grafana/tsconfig": "^1.2.0-rc1",
|
||||
"@mochajs/json-file-reporter": "^1.2.0",
|
||||
"babel-loader": "9.1.3",
|
||||
|
||||
@@ -1,7 +1,7 @@
|
||||
{
|
||||
"name": "@grafana/eslint-plugin",
|
||||
"description": "ESLint rules for use within the Grafana repo. Not suitable (or supported) for external use.",
|
||||
"version": "10.4.0-pre",
|
||||
"version": "10.4.1",
|
||||
"main": "./index.cjs",
|
||||
"author": "Grafana Labs",
|
||||
"license": "Apache-2.0",
|
||||
|
||||
@@ -2,7 +2,7 @@
|
||||
"author": "Grafana Labs",
|
||||
"license": "Apache-2.0",
|
||||
"name": "@grafana/flamegraph",
|
||||
"version": "10.4.0-pre",
|
||||
"version": "10.4.1",
|
||||
"description": "Grafana flamegraph visualization component",
|
||||
"keywords": [
|
||||
"grafana",
|
||||
@@ -44,8 +44,8 @@
|
||||
],
|
||||
"dependencies": {
|
||||
"@emotion/css": "11.11.2",
|
||||
"@grafana/data": "10.4.0-pre",
|
||||
"@grafana/ui": "10.4.0-pre",
|
||||
"@grafana/data": "10.4.1",
|
||||
"@grafana/ui": "10.4.1",
|
||||
"@leeoniya/ufuzzy": "1.0.14",
|
||||
"d3": "^7.8.5",
|
||||
"lodash": "4.17.21",
|
||||
|
||||
@@ -3,7 +3,7 @@
|
||||
"license": "AGPL-3.0-only",
|
||||
"name": "@grafana/o11y-ds-frontend",
|
||||
"private": true,
|
||||
"version": "10.4.0-pre",
|
||||
"version": "10.4.1",
|
||||
"description": "Library to manage traces in Grafana.",
|
||||
"sideEffects": false,
|
||||
"repository": {
|
||||
|
||||
@@ -2,7 +2,7 @@
|
||||
"name": "@grafana/plugin-configs",
|
||||
"description": "Shared dependencies and files for core plugins",
|
||||
"private": true,
|
||||
"version": "10.4.0-pre",
|
||||
"version": "10.4.1",
|
||||
"dependencies": {
|
||||
"tslib": "2.6.2"
|
||||
},
|
||||
|
||||
@@ -2,7 +2,7 @@
|
||||
"author": "Grafana Labs",
|
||||
"license": "AGPL-3.0-only",
|
||||
"name": "@grafana/prometheus",
|
||||
"version": "10.4.0-pre",
|
||||
"version": "10.4.1",
|
||||
"description": "Grafana Prometheus Library",
|
||||
"keywords": [
|
||||
"typescript"
|
||||
|
||||
@@ -2,7 +2,7 @@
|
||||
"author": "Grafana Labs",
|
||||
"license": "Apache-2.0",
|
||||
"name": "@grafana/runtime",
|
||||
"version": "10.4.0-pre",
|
||||
"version": "10.4.1",
|
||||
"description": "Grafana Runtime Library",
|
||||
"keywords": [
|
||||
"grafana",
|
||||
@@ -37,11 +37,11 @@
|
||||
"postpack": "mv package.json.bak package.json"
|
||||
},
|
||||
"dependencies": {
|
||||
"@grafana/data": "10.4.0-pre",
|
||||
"@grafana/e2e-selectors": "10.4.0-pre",
|
||||
"@grafana/data": "10.4.1",
|
||||
"@grafana/e2e-selectors": "10.4.1",
|
||||
"@grafana/faro-web-sdk": "^1.3.6",
|
||||
"@grafana/schema": "10.4.0-pre",
|
||||
"@grafana/ui": "10.4.0-pre",
|
||||
"@grafana/schema": "10.4.1",
|
||||
"@grafana/ui": "10.4.1",
|
||||
"history": "4.10.1",
|
||||
"lodash": "4.17.21",
|
||||
"rxjs": "7.8.1",
|
||||
|
||||
@@ -29,7 +29,7 @@ export interface DataRequestInfo extends Partial<DashboardInfo> {
|
||||
datasourceUid: string;
|
||||
datasourceType: string;
|
||||
panelId?: number;
|
||||
panelPluginType?: string;
|
||||
panelPluginId?: string;
|
||||
panelName?: string;
|
||||
duration: number;
|
||||
error?: string;
|
||||
|
||||
@@ -80,7 +80,7 @@ enum PluginRequestHeaders {
|
||||
DatasourceUID = 'X-Datasource-Uid', // can be used for routing/ load balancing
|
||||
DashboardUID = 'X-Dashboard-Uid', // mainly useful for debugging slow queries
|
||||
PanelID = 'X-Panel-Id', // mainly useful for debugging slow queries
|
||||
PanelPluginType = 'X-Panel-Plugin-Type',
|
||||
PanelPluginId = 'X-Panel-Plugin-Id',
|
||||
QueryGroupID = 'X-Query-Group-Id', // mainly useful to find related queries with query splitting
|
||||
FromExpression = 'X-Grafana-From-Expr', // used by datasources to identify expression queries
|
||||
SkipQueryCache = 'X-Cache-Skip', // used by datasources to skip the query cache
|
||||
@@ -227,8 +227,8 @@ class DataSourceWithBackend<
|
||||
if (request.panelId) {
|
||||
headers[PluginRequestHeaders.PanelID] = `${request.panelId}`;
|
||||
}
|
||||
if (request.panelPluginType) {
|
||||
headers[PluginRequestHeaders.PanelPluginType] = `${request.panelPluginType}`;
|
||||
if (request.panelPluginId) {
|
||||
headers[PluginRequestHeaders.PanelPluginId] = `${request.panelPluginId}`;
|
||||
}
|
||||
if (request.queryGroupId) {
|
||||
headers[PluginRequestHeaders.QueryGroupID] = `${request.queryGroupId}`;
|
||||
|
||||
@@ -2,7 +2,7 @@
|
||||
"author": "Grafana Labs",
|
||||
"license": "Apache-2.0",
|
||||
"name": "@grafana/schema",
|
||||
"version": "10.4.0-pre",
|
||||
"version": "10.4.1",
|
||||
"description": "Grafana Schema Library",
|
||||
"keywords": [
|
||||
"typescript"
|
||||
|
||||
@@ -9,7 +9,7 @@
|
||||
//
|
||||
// Run 'make gen-cue' from repository root to regenerate.
|
||||
|
||||
export const pluginVersion = "10.4.0-pre";
|
||||
export const pluginVersion = "10.4.1";
|
||||
|
||||
export interface Options {
|
||||
/**
|
||||
|
||||
@@ -9,7 +9,7 @@
|
||||
//
|
||||
// Run 'make gen-cue' from repository root to regenerate.
|
||||
|
||||
export const pluginVersion = "10.4.0-pre";
|
||||
export const pluginVersion = "10.4.1";
|
||||
|
||||
export interface Options {
|
||||
limit: number;
|
||||
|
||||
@@ -11,7 +11,7 @@
|
||||
|
||||
import * as common from '@grafana/schema';
|
||||
|
||||
export const pluginVersion = "10.4.0-pre";
|
||||
export const pluginVersion = "10.4.1";
|
||||
|
||||
export interface Options extends common.OptionsWithLegend, common.OptionsWithTooltip, common.OptionsWithTextFormatting {
|
||||
/**
|
||||
|
||||
@@ -11,7 +11,7 @@
|
||||
|
||||
import * as common from '@grafana/schema';
|
||||
|
||||
export const pluginVersion = "10.4.0-pre";
|
||||
export const pluginVersion = "10.4.1";
|
||||
|
||||
export interface Options extends common.SingleStatBaseOptions {
|
||||
displayMode: common.BarGaugeDisplayMode;
|
||||
|
||||
@@ -11,7 +11,7 @@
|
||||
|
||||
import * as common from '@grafana/schema';
|
||||
|
||||
export const pluginVersion = "10.4.0-pre";
|
||||
export const pluginVersion = "10.4.1";
|
||||
|
||||
export enum VizDisplayMode {
|
||||
Candles = 'candles',
|
||||
|
||||
@@ -11,7 +11,7 @@
|
||||
|
||||
import * as ui from '@grafana/schema';
|
||||
|
||||
export const pluginVersion = "10.4.0-pre";
|
||||
export const pluginVersion = "10.4.1";
|
||||
|
||||
export enum HorizontalConstraint {
|
||||
Center = 'center',
|
||||
|
||||
@@ -11,7 +11,7 @@
|
||||
|
||||
import * as common from '@grafana/schema';
|
||||
|
||||
export const pluginVersion = "10.4.0-pre";
|
||||
export const pluginVersion = "10.4.1";
|
||||
|
||||
export interface MetricStat {
|
||||
/**
|
||||
|
||||
@@ -9,7 +9,7 @@
|
||||
//
|
||||
// Run 'make gen-cue' from repository root to regenerate.
|
||||
|
||||
export const pluginVersion = "10.4.0-pre";
|
||||
export const pluginVersion = "10.4.1";
|
||||
|
||||
export interface Options {
|
||||
/**
|
||||
|
||||
@@ -9,7 +9,7 @@
|
||||
//
|
||||
// Run 'make gen-cue' from repository root to regenerate.
|
||||
|
||||
export const pluginVersion = "10.4.0-pre";
|
||||
export const pluginVersion = "10.4.1";
|
||||
|
||||
export interface Options {
|
||||
selectedSeries: number;
|
||||
|
||||
Some files were not shown because too many files have changed in this diff Show More
Reference in New Issue
Block a user